Introduction
UnitedHealth Group’s Chief Executive Officer Howard Solomon, received a total compensation package worth over $100,000 million in 2011. Between 2007 and 2011 John Martin, CEO of Gileaad Services, made over $204 million. In 2010, the top paid CEO was John Hammergren of McKesson, who earned total compensation of $131 million. Among the U.S. Fortune 500 firms in 1980, CEO compensation was 42 times that of an average worker. By 2011, that ratio increased to 380 times, and the CEO of a major corporation earned on average $13 million in total compensation (AFL-CIO, 2012). In that same year, President Obama’s salary was $400,000.
While publicity of these seemingly excessive pay practices garners much attention, it is important to note that not all CEOs are paid in the tens of millions of dollars. Further, much of reported compensation comes from the exercise of stock options which increased in value due to increases in the price of the company’s stock. Graef Crystal, a leading expert on executive compensation, notes that the question whether an executive’s pay is excessive is really one that cannot be answered by a simple yes or no response (Crystal, 1993). What may seem extreme in one situation may be justifiable in others. Even so, shareholders and other stakeholders hold little influence in setting CEO pay, and its ultimate impact on the corporation’s value is minute, at most.
This paper analyzes the pay of both CEOs and CFOs at 70 Fortune 500 companies over a six-year period from 2006 through 2011. Using data reported in the proxy statements distributed each year by publicly held companies to their shareholders, we examined base pay, annual bonuses, stock option grants, and stock awards paid to the CEOs and CFOs of each company to determine whether any trends, either upward or downward, existed during this relatively volatile economic period. We also tested whether company size, measured by gross revenues and net income, and performance, measured by earnings per share, affected the compensation packages paid to these executives. The paper first reviews the basic forms of compensation typically paid to executives. We then report the results of our analysis and discuss implications for practitioners and researchers.
Components of Executive Compensation
Over time, the components of executive pay have evolved and the compensation plans offered by most large corporations are remarkably similar, containing the following five elements: (1) base pay; (2) short-term bonus; (3) long term incentives; (4) employee benefits; and (5) perquisites (Ellig, 2002; Milkovich, Newman and Gerhart, 2011). While the primary focus of this paper is recent trends with respect to first three elements, all five are discussed below.
Base pay is a fixed part of compensation and is generally stated as an annual amount, paid over the course of the corporation’s fiscal year (Martoccio, 2011). While most executives receive some amount of base pay, only about 20 percent of a CEO’s total pay is base salary; the rest is made up of incentives based on the company’s performance (Ellig, 2002). This represents a significant difference between executive pay and the compensation of non-executive employees whose base pay represents a much higher percentage of overall compensation. Thus, base pay is thought to represent the corporation’s remuneration to the CEO for his or her core role of the day-to-day management of the organization.
A more likely explanation of the relatively low percentage of base pay to total compensation is that companies may limit annual salary to $1 million or less because of the limitations imposed by Section 162(m) of the Internal Revenue Code (IRC). Section 162 sets forth the provisions for deducting trade or business expenses. In the area of employee compensation, courts had previously applied the “reasonable” test to determine whether executive pay was excessive and, therefore, nondeductible by the company, but generally these cases arose only in connection with privately held concerns (Friedman, 1994). As the 1980’s brought with it a heightened public awareness of perceived corporate abuses, primarily as a result of increased institutional shareholdings (Davis and Thompson, 1994), Congress enacted Code Section 162(m) in an attempt to curb the escalation of executive pay increases (Friedman, 1994). Specifically, the Code denies a deduction to publicly traded corporations to the extent that compensation paid to the CEO and the four most highly compensated officers exceeds $1 million. An important exception to the disallowance is provided for compensation that is based on the attainment of performance goals, determined by a compensation committee comprised of two or more outside directors and approved by the shareholders. During the period between 1993 and 2003, research shows that CEO salaries remained at or below the $1million threshold (Valenti and Wolfe, 2007); however, although section 162 was designed to discourage corporations from providing their top executives with excessive pay packages, it did little to halt the spiraling increases in executive pay throughout the 1990s and into the 21st century, largely because the CEO’s compensation is based predominantly on non-base pay remuneration (Rose and Wolfram, 2000).
The second component of executive compensation is short-term bonuses, generally awarded annually for meeting a pre-established benchmark relating to company performance (Martoccio, 2011). Because bonuses are dependent on attaining performance objectives, they fall outside of the deduction limitation imposed by IRC Section 162(m). As a result, the use of annual bonuses as an essential part of executive pay has risen dramatically over the past few years. In the 1980’s, only 36 percent of U.S. companies gave annual bonuses. By 2010, over 90 percent of corporate executives received bonuses (Milkovich, et al., 2011).
While annual performance-based bonuses may be fully deductible if they qualify for the exception under Section 162(m), they must be disclosed separately in the corporation’s annual proxy statement. In order to assure that shareholders are well-informed of the facts surrounding the compensation of corporate executives and to foster better accountability of the board of directors to the shareholders, the Securities and Exchange Commission (SEC) substantially modified the proxy disclosure rules under Regulation S-K, effective in 1993. The most comprehensive of these changes was the requirement that corporations must present a Summary Compensation Table, replacing the cash compensation table previously used and including information for named executives individually for each of the last three fiscal years. Data required to be furnished includes: (1) base pay; (2) bonus; (3) other compensation; (4) stock awards; (5) option awards; (6) non-equity incentive compensation; and (7) nonqualified deferred compensation. According to one author, the inclusion of the Summary Compensation Table makes it virtually impossible to hide any compensation paid to the CEO, CFO, or another top executive (Heard, 1995). In addition, the regulations require companies to estimate the value of stock options granted to executives each year, provide a performance graph showing total shareholder returns for the past five years compared to both a broad market index and an industry peer group index, and include the report of the compensation committee describing its basis for pay awards in the previous year.
By enhancing the information provided to investors regarding CEO compensation, the SEC intended to place shareholders in a better position to challenge excessive pay practices. Thus, while the SEC had previously resisted demands by corporate governance experts to allow shareholders more input into corporate affairs, the amendments to the proxy statement rules were aimed at achieving a middle ground (Marino, 1999). Empirical evidence failed to show any increase in the number of shareholder proposals challenging executive compensation as a result of the SEC rule changes (Marino, 1999). Thus, effective April 4, 2011, section 951 of the Dodd-Frank Wall Street Reform and Consumer Protection Act (Pub. Law 111-203) was enacted to require public companies to provide an advisory shareholder vote on the compensation of the top executives of the company — typically, the CEO, the CFO, and at least three other named executive officers.
The third element of executive pay covers a wide range of long-term incentives, including both equity-based and non-equity-based pay. Long-term incentive payments are generally awarded for meeting performance objectives over a two- to five-year period. These awards are sometimes described as performance shares, performance units, or long-term cash incentives. They are reportable in the Summary Compensation Table as directed in the SEC proxy rules, but a deduction for payment of these awards is not limited by Section 162(m); accordingly, they have become very popular and account for over 40 percent of total executive compensation (Milkovich, 2011).
Equity-based pay consists mostly of stock option awards and restricted stock. Stock options are generally viewed as the largest component of CEO pay. Until recently, options had very favorable accounting treatment for the company, which is one reason why they were so popular (Murphy, 2002). Options also enjoy favorable tax treatment. If the option qualifies as an incentive stock option under Internal Revenue Code section 422, the employee does not have to recognize any income either when the grant is awarded or when the option is exercised, and when the stock is sold, the employee will recognize capital gain income. In the case of nonqualified options, the employee will have taxable income when the option is exercised, equal to the difference between the market price and the exercise price.
After several years of debate, the Financial Accounting Standards Board adopted FAS 123R which became effective on a prospective basis for quarterly reporting periods beginning after June 15, 2005, although many large public companies adopted the rule as of January 1, 2005. Accordingly, research has found that companies began to reduce their grants of employee stock options starting in 2002, in anticipation of the new rules, but that the use of stock option grants started to increase again in 2007, thus suggesting that favorable accounting treatment encouraged the use of stock options (Brown and Lee, 2011).
Due to these changes in the reporting requirements for stock option grants, stock awards rapidly became the largest component of executive pay at many companies. For example, in 2011 ExxonMobil paid its CEO nearly $19 million in ExxonMobil stock while it made no stock option grants to any of its five highest paid executives in that year. Most often restricted stock is provided to the executive, which is an outright transfer of employer equities, but subject to a restriction on transfer which typically lasts for five years. Until the restriction lapses, there is no income tax payable on the transfer.
Under the SEC disclosure rules, companies must separately report in the Summary Compensation Table the awards of stock and stock options to their CEOs, CFOs and their three highest paid executives. In addition, transactions between executives who classified as insiders under SEC Rule 16b and their employers are subject to disclosure rules. Such transactions include (1) stock option grants, restricted stock grants, and acquisitions of stock units under non-tax qualified deferred compensation plans, and (2) shares delivered to the company to pay income tax withholding on option exercises, options surrendered to the company in an option repricing, and sales of shares to a company.
The fourth component of executive pay, employee benefits, covers a wide variety of protection and retirement plans as well as health care plans that provide benefits over and above what the vast majority of employees receive. One such benefit is generically named the supplemental executive retirement plan or SERP. These plans pay benefits to the extent that an employer’s qualified plan cannot pay benefits to certain employees because of the limitations under the Internal Revenue Code. The limitations under the Code are designed both to prevent employers from providing benefits to highly compensated employees that are disproportionably more favorable than those provided to non-highly compensated employees as well as to limit the income tax deduction available for provision of the benefits.
Even though the value of these benefits can be very large, the SEC reporting requirements do not require disclosure of the actual amounts. All that is required is that the corporation report the increase in the present value of each executive’s pension benefits over the previous year. In the case of a deferred compensation plan, which allows executives to defer receipt of annual pay until after retirement, the company has to report earnings on the deferred compensation only if not limited to 120 percent of the applicable federal rate.
The final area of executive compensation is the provision of perquisites which refers to a broad range of benefits that are available only to the upper ranks of the organization. Perquisites often include membership in exclusive social or country clubs, personal use of company limousines or jets, tickets to sporting events, financial and estate planning, and vacations. Over the past 20 years, Congress has diminished the attractiveness of many of these perquisites by either eliminating the tax deduction or requiring that income be imputed to the recipients of these benefits. For example, effective January 1, 1994, companies may no longer deduct the cost of membership for any club organized for business, pleasure, recreation or social purposes. Business meals are deductible but only up to 50 percent of their cost, and private skyboxes are deductible only up to the fair value of non-luxury box seats.
Executive Compensation: 1936 through 2006
Before reporting the results of our analysis, we briefly describe several studies covering earlier periods and our expectations of current trends. In a long-term study covering 1936 through 2005, Frydman and Saks (2010) found that during the first 15 years of the study, executive pay actually declined, which covered the years during World War II until the early 1950s. Between 1950 and 1975, the level of executive pay grew slowly at about .8 percent annually. Starting in the mid 1970s, executive pay began to increase at a much more accelerated rate, dipping briefly from 2001 through 2003. The authors also observed changes in the structure of executive pay. While long-term bonuses were used as early as the 1930s, their use did not become popular until the 1960s. By the end of the study, long-term bonuses became the largest component of executive pay, reaching 35 percent in 2005, mostly due to the use of restricted stock awards. Stock options also grew in popularity over the study period, primarily due to favorable tax treatment. While only 16 percent of executives received option grants in the 1950s, that number reached almost 90 percent in the late 1990s, with stock options becoming a greater share of median pay beginning in the 1980s.
Two studies covered the period between 1993 and 2003. In the first, Conyon (2006) compared overall CEO pay to CEO pay of the S&P 500 firms, and found that in 2003 average compensation was approximately $4.5 million for all chief executives and $9 million for those in the S&P 500, confirming the well-accepted positive correlation between CEO pay and firm size. In addition, Conyon found that since 1993, the percentage of option pay had increased while the percentage of salary to total compensation decreased. Since 2001 restricted stock became a more important component of total CEO pay while options became slightly less important. In a second study, Kaplan (2008) examined both estimated pay and actual pay to CEOs and found that estimated pay increased significantly from 1993 to 2000, but then began to decline by approximately 50 percent since 2000. Average CEO pay peaked in 2000 at more than 300 times the median U.S. household income and since then has declined to approximately 225 times that amount. Actual pay (which includes the gains from options actually exercised by the CEO during a given year, not just their theoretical value) also peaked in 2000, dropped by almost 50 percent in 2002, and then continued to rise to a value just over $8 million in 2006. Kaplan surmised that the increase in actual pay is the likely result of increased use of restricted stock over stock options.
The most recent study published in November 2011 focused primarily on stock options but also examined the importance of cash, stock options, and restricted stock in the CEO compensation package between 2000 and 2006. Brown and Lee (2011) noted that the use of cash compensation which includes both salary and bonus increased steadily from 2000 to 2005 and sharply increased in 2006. On the other hand, there were two sharp drops in stock option grants to CEOs, one in 2001, after the Enron collapse, and after 2004 when FAS 123R took effect. Use of restricted stock grew steadily since 2003.
Our research is intended to extend the findings of the previous studies through 2011 and covers the years of recession which began in late 2007 and ended in the U.S. in mid 2009. We begin our study with 2006, when the SEC amended the Summary Compensation Table rules to require inclusion of stock option values consistent with the values used for purposes of FAS 123R reporting. In addition, we looked at the compensation paid to both the CEO and CFO as both jobs are required to be included in the Table since 2006. Since the IRC section 162(m) limit remains at $1 million, we anticipated that average CEO salary would not increase significantly during the study period and, consistent with prior findings, would continue to represent less than 20 percent of total compensation paid to the CEO. Since annual bonuses are typically based on profits, we anticipated that bonuses paid to the CEO in 2008 and 2009 would decrease due to the overall drop in profits. However, we also expected to see the continued trend of greater use of restricted stock and less use of stock options in the compensation packages to CEOs. Since prior studies typically focus on CEO pay as opposed to other members of the top management team (Devers, Cannella, Reilly and Yoder, 2007), we did not form any preconceived notions about the compensation paid to the CFO.
In addition, we estimated a regression model to determine the relationship between executive compensation, firm size, and firm performance. While much of the research in this area has assumed a positive relationship between executive pay and firm performance, prior research found that organization size is the main indicator of CEO compensation (Gomez-Mejia and Wiseman, 1997). Thus, we included two predictor variables equal to gross revenues and net income in our model and expected size to positively correlate with all components of executive compensation. Regardless of the weak relationship previously found between performance and CEO incentives, one might expect that a CEO’s effectiveness would have a positive impact on firm performance and thus should be rewarded. Moreover, when a CEO’s compensation contains variable pay elements, agency theory suggests that stronger links between compensation and firm performance presumably reduce risk aversion by managers if risk and returns are positively associated. According to this view, agents are motivated to improve personal wealth, and when their wealth is strongly linked to the wealth of firm owners (such that executives share more risk), executives will exhibit less risk-averse behavior and more risk neutral behavior when that risk is compensated (Mehran, 1995). Thus, we included earnings per share in the model and expected it to be positively correlated with annual bonuses, stock awards, and option grants.
Method and Results
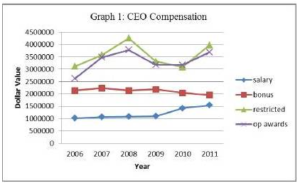
Eighty companies in the Fortune 500 as of 2006 were selected using a random number generator. Because of missing data, mergers, and acquisitions during the study period, the final sample consisted of 70 companies. Data were collected from proxy statements and Forms 10-K filed with the SEC. The data were first analyzed by calculating mean values of the four components of CEO and CFO pay over the study period and plotting the means as shown in Graphs 1 and 2. T-tests were then conducted to determine whether the change in the mean of any component during the six years or within any two-year period was significant
We see that average CEO base pay increased over the study period from $1,012,750 in 2006 to $1,541,634 in 2011, with the largest increases occurring in 2010 and 2011. Nevertheless, analysis using t-tests reveals that the increase was not significant. Thus, CEO base salary did not significantly change over the six-year period.
We also see that the average bonus paid to a CEO, to the extent a bonus was paid, remained steady at just over $2 million dropping slightly in 2011. We also note that fewer than half the companies actually paid bonuses to their CEOs, and the number steadily dropped during the study period; 27 companies in 2006 and only 20 companies in 2011. Accordingly, our expectation that bonuses to CEOs would decline only in the recession years of 2007 through 2009 did not materialize. Over the entire study period, bonuses became a less important component of the CEO pay package. The data with respect to stock awards and option grants showed that both peaked in 2008, and then declined in 2009 and 2010, increasing to near-2008 levels again in 2011. Thus, previous studies suggesting that stock awards would continuously become a more important part of CEO pay, and stock options a less important component, did not persist through 2011.
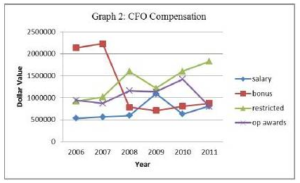
Regarding the data for CFO compensation, we see a much more erratic pattern. Of particular note is the high level of bonuses paid to CFOs in 2006 and 2007 and dropping precipitously for the rest of the study period. The difference is significant at a probability less than .01. Base salary, stock awards, and option grants also varied more for CFOs than CEOs, as seen in Graph 2.
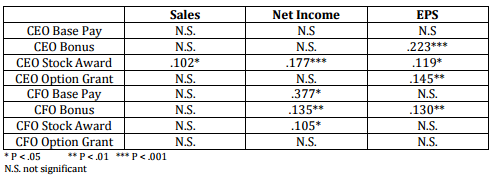
The last phase of our analysis involved estimating a regression model to test the effect of company size and performance on each component of CEO and CFO pay. As shown in Table 1, size, measured by total sales, did not impact pay at all, except with respect to CEO stock awards, and then the relationship was marginally significant. When measured by net income, however, size was positively correlated with CEO stock awards, and CFO base pay, bonuses and stock awards. This suggests that a combination of size and performance, measured by overall profitability, may be a better indicator of executive compensation. Earnings per share were positively associated with several forms of incentive pay including CEO bonuses, CEO stock and option awards, and CFO bonuses. Thus, incentive-based pay appears to be somewhat influenced by company performance.
Table 1: Significant Regression Estimates-Beta Coefficient
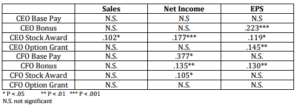
*P < .05 ** P < .01 *** P < .001
N.S. not significant
Implications for Managers and Future Research
Several observations from our data are worthy of comment. First, CEO base compensation, while remaining steady at around $1 million during the first years of the study, began to increase to an average of $1.5 million by 2011, even though the limit under IRC 162(m) remains at $1 million. This represents a departure from previous practices that limited executive base pay to under $1million (Valenti and Wolfe, 2007). Either companies are now no longer concerned that shareholders will object to part of the CEO’s pay as being non-deductible, or the excess $500,000 compensation expense is minimal relevant to corporations’ overall expenses. In addition, the increase in base pay may signal a trend to place less emphasis on short-term incentive pay as the CEO’s reward for good performance. This trend may also be reflected in the data that show CEOs’ annual bonuses remaining the same, and even declining slightly, over the study period. Whether base executive pay will continue to increase as an overall part of the compensation package should continue to be monitored. Nevertheless, compensation committees can rely on the increase in average CEO salaries to justify increasing the base pay for CEOs in their companies.
The study also shows that CFO bonuses exceeded $2 million in 2006 and 2007, approaching the average bonus paid to the CEO. In general, CEO pay is 40 to 100 percent higher than other executives in the corporation (Bebchuk and Grinstein, 2005). While CFO bonuses returned to more expected levels in 2008 and thereafter, at less than 50 percent of the average bonuses paid to the CEO, it is interesting that bonuses paid in at least two years of the study were, on average, not significantly different than those paid to the CEO. We speculate that bonuses paid to CFOs were higher in the earlier years when companies were struggling with compliance with the Sarbanes-Oxley Act of 2002 but then dropped to more normal levels once that process was resolved. However, these data show that under certain circumstances, compensation paid to non-CEO executives can equal or perhaps even exceed that paid to the CEO, at least with respect to a component of executive pay. Managers can take notice that traditional notions about non-CEO executive pay need may not always apply. Executives should be rewarded for outstanding performance, and the level CEO pay should not limit the amount of non-CEO bonuses or other incentive pay. A limitation to this study is that it begins with the 2006 reporting year as that was the first year CFO pay was required to be included in the Summary Compensation Table. Research on CFO pay prior to that year would confirm whether the spike in CFO bonuses was a phenomenon most likely associated with Sarbanes-Oxley compliance.
Our data also show that the size of the company as measured by sales did not predict CEO pay, which is not consistent with previous studies (Gomez-Mejia and Wiseman, 1997). One explanation is that because all of the companies in our study were Fortune 500 companies, variation in total sales among the companies was not significant. Alternatively, we did see some evidence of firm performance predicting CEO variable pay. Earnings per share were positively related to the likelihood that the CEO would receive grants of stock or stock options, and net income was positively related to the likelihood that both the CEO and CFO would receive stock awards. These results are similar to those of Mehran’s (1995) study, which found that incentives offered in the form of equity would be positively related to firm performance. Use of equity-based rewards to the CEO increased during the last two years of the study period, also suggesting that as the economy improved and overall corporate profits rose, large companies relied more heavily on equity-based incentives as a substantial part of the executive pay package. Thus, predictions that stock options would be used less frequently due to the changes in financial reporting have not occurred.
Conclusion
Undoubtedly, incentive pay will continue to be a topic of interest for both practitioners and academics. Thus, it is expected that research will continue to explore employee incentives at the CEO level and for other members of top management teams.
(adsbygoogle = window.adsbygoogle || []).push({});
References
AFL-CIO. (2012). “Trends in CEO Pay,” Executive Paywatch. [Online] [Retrieved February 19, 2013],http://www.aflcio.org/Corporate-Watch/CEO-Pay-and-the-99.
Publisher
Bebchuk, L. & Grinstein, Y. (2005). “The Growth of Executive Pay,” Harvard University: John M. Olin Center for Law, Economics and Business. [Online] [Retrieved October 15, 2012], http://www.law.harvard.edu/programs/olin_center/papers/pdf/ Bebchuk_et%20al_510.pdf.
Publisher – Google Scholar
Brown, L. D. & Lee, Y.- J. (2011). “Changes in Option-Based Compensation around the Issuance of SFAS 123R,” Journal of Business & Financial Accounting, 39, 1053-1059.
Publisher – Google Scholar
Conyon, M. J. (2006). “Executive Compensation and Incentives,” Academy of Management Perspectives, 20, 25-44.
Publisher – Google Scholar
Crystal, G. S. (1991). “Why CEO Compensation is So High?,” California Management Review, 34, 9-29.
Publisher – Google Scholar
Ellig, B. R. (2002). ‘The Complete Guide to Executive Compensation,’ New York: McGraw-Hill.
Google Scholar
Davis, G. F. & Thompson, T. A. (1994). “A Social Movement Perspective on Corporate Control,” Administrative Science Quarterly, 39, 141-173.
Publisher – Google Scholar
Devers, C. E., Cannella, A. A., Jr., Reilly, G. P. & Yoder, M. E. (2007). “Executive Compensation: A Multidisciplinary Review of Recent Developments,” Journal of Management, 33, 1016-1072.
Publisher – Google Scholar
Friedman, I. H. (1994). “The Deductibility of Executive Compensation: Automotive Investment, Pulsar Components, and New Section 162(m),” Tax Lawyer, 48, 255-270.
Publisher – Google Scholar
Frydman, C. & Saks, R. E. (2010). “Executive Compensation: A New View from a Long-Term Perspective, 1936-2005,“Review of Financial Studies, 23, 2099-2138.
Publisher – Google Scholar
Gomez-Mejia, L. R. & Wiseman, R. M. (1997). “Reframing Executive Compensation: An Assessment and Outlook,”Journal of Management 23, 291-374.
Publisher – Google Scholar
Heard, J. E. (1995). “Executive Compensation: Perspective of the Institutional Investor,” University of Cincinnati Law Review, 63, 749-979.
Publisher – Google Scholar
Kaplan, S. N. (2008). “Are U.S. CEOs Overpaid?,” Academy of Management Perspectives, 22, 5-20.
Publisher – Google Scholar
Marino, L. B. (1999). “Executive Compensation and the Misplaced Emphasis on Increasing Shareholder Access to the Proxy,” University of Pennsylvania Law Review, 147, 1205-1249.
Publisher – Google Scholar
Martocchio, J. J. (2011). ‘Strategic Compensation,’ Upper Saddle River, NJ: Prentice Hall.
Mehran, H. (1995). “Executive Compensation Structure, Ownership, and Firm Performance,” Journal of Financial Economics, 32, 163-174.
Publisher – Google Scholar
Milkovich, G. T., Newman, J. M. & Gerhart, B. (2011). ‘Compensation,’ New York: McGraw-Hill Irwin.
Google Scholar
Murphy, K. J. (2002). “Explaining Executive Compensation: Managerial Power versus the Perceived Cost of Stock Options,” University of Chicago Law Review, 69, 847-869.
Publisher – Google Scholar
Rose, N. L. & Wolfram, C. (2000). “Has the Million-Dollar Cap Affected CEO Pay?,” American Economic Review, Papers and Proceedings 90, 197-202.
Publisher – Google Scholar
Valenti, M. A. & Wolfe, M. (2007). ‘From 1993 to 2003: Changes to Executive Pay,’ Journal of Compensation and Benefits, 23(1), 24-28.
Google Scholar