Introduction
The description, measurement and approach of innovation generation and knowledge creation are a difficult and rather complex task. Empirical research in this field uses R&D based indicators and patent data in most cases. Each of these indicators exhibits its own characteristics in terms of measurement, strengths and weaknesses. In this paper, we use patent data to study the Greek patterns of innovation and knowledge creation.
There hasn’t been so far in Greece any research on innovation and knowledge creation using patents. The only two innovation surveys that have been realized are based on a completely different methodology. This gap in research was an obstacle and, at the same time, a real motive. Our paper is a first attempt to describe innovation and knowledge creation through patents and a try to respond to some main research questions: Who makes patents in Greece, in what direction and for what reason.
A patent is evaluated under three criteria: its novelty to the world, its technical reproduction and industrial exploitation and, finally, its non-obviousness. The first criterion means that a patent reflects certain scientific and mainly technological “leading- edge” activities.
The second implies that a patent is filed, if it is expected to have an impact on a firm (e.g. to generate profits) or in order to contribute to technical change. After all, patents are the direct result – outcome of business R&D activities, especially of these that are directed to profits. The third criterion means that a patent must contain solutions, which can not be obvious to the average practitioner. Whatever the strengths and weaknesses, patent data is considered to be the most common and available indicator of R&D output – product in national, sectoral and firm level.
Many authors, among them Basberg (1983), Grupp (1990), Archibugi and Pianta (1992), have extensively used patent data and statistics as technology and innovation indicators. Patents cover almost every field of technology with the only exception of software which, however, is not linked directly to technical process and products.
At the same time, they can be used, at different levels of aggregation and comparison (level of technological field, firm, region, nation) because of the amount and detail of information they cover, as Mogee (1991) and Archibugi (1992) argue. Patents also capture these R&D activities that are not conducted in firms, but carried out by individuals, universities and research institutions. Finally, as mentioned on the OECD Patent Manual (1994), patents include a lot of useful information (year of invention, assignee and inventor names and addresses, and citations) which is available for many years, hence, can be used for numerous analyses at the technology, firm, industry and national levels.
However, as every tool of analysis, the use of patent statistics has its own disadvantages and limitations. First, as Pavitt (1985, 1988) argues, patents are not the only way to exploit firm – specific technology and hinder imitation. Second, firms, industries and countries differ in their propensity to patent and this variance in patenting has to do, among other things, with different institutional procedures and legislation.
Third, patent protection is only one of the ways to face possible competition. Some other ways are the so-called “industrial secrecy” or the fast promotion and marketing of a product in the market. Moreover, as Mansfield, Schwartz & Wagner (1981) mention firms have different attitudes in patenting and these attitudes depend on the degree of commercial exploitation of patents and on firms’ technology and marketing strategies. Fourth, the technological classification of patents can also be a problem.
As argued by Pavitt (1984) and mentioned on the OECD Patent Manual (1994), the high degree of detail and specialization, the relative difficulty in linking technology with production and the fact that a patent can by applied in many products, makes hard the study of patents at every level of analysis. Overall, the use of patent statistics has advantages and disadvantages. However, if we are careful and consider their limits, we can always have an appropriate and adequate indicator of empirical economic research.
The paper is divided into five sections. In the first section, we refer to some arguments for and against the use of patent data and statistics in the study of technology- innovation generation and knowledge creation. In section two, we deal with methodology issues. Section three presents the overall pattern of the patent activity in Greece and section four the technological dimension of both Greek and foreign patents. Finally section five synthesizes, discusses the main findings and presents some concluding remarks.
Methodology and Research Approach
For this paper, we have constructed a patent database. In Greece, responsible for patents and relevant data is the Greek Organization of Industrial Property (OBI). OBI was established in 1987 and its first data set is for 1988. However, OBI only publishes printed bulletins of patent data and keeps its electronic format only for its staff. For our paper, we have collected the 12 per year special printed bulletins of industrial property, where the national (foreign and Greek) patent documents appear, and we created a data base with patent data from 1989 until 2005.
We divided the information contained in the OBI bulletins into the following 13 fields: Number of patent, number of application, international technology classification, name of beneficiary, date of application, date of patent granting, conventional priorities, amendments to the main patent, name of inventor, data of inventor, special surrogate attorney, name of invention and brief summary of patent content. We have added another 28 fields with information that could be derived from the generalized information of the bulletins and created the final research data base.
These 28 fields are detailed and actually attempt a decomposition and de-codification of the information contained in the bulletins. For example, the field international technology classification was decomposed to the fields of sector, sub-sector, class, sub-class, and main group. All these could be derived from the technology codification of the patent. These 28 fields are: year of granting, code of technology classification, total number of codes of technology classification, combination of codes of technology classification, decomposition of each patent code based on the sector, sub-sector, class, sub-class and main group (9 fields in total), institutional status of beneficiary, national origin, region and country of origin of beneficiary or inventor (2 fields and only for foreign patents), city, prefecture (sub- region) and region of origin of beneficiary or inventor (3 fields and only for Greek patents), special cases and number of inventors.
Further on, we have grouped patent data and we present eight (8) distributions and classifications based on specific criteria. These criteria are: national origin (Greek, foreign, Greek-foreign), institutional status of beneficiary, technological content (three levels of analysis), country of origin of beneficiary and/or inventor for the foreign patents granted in Greece, and finally region and sub- region (prefecture) of beneficiary and/or inventor for the Greek patents granted in Greece. The criterion “institutional status of beneficiary” is split into two different groups: the simple group, where the owner can be a firm, individual, public research institution, academic institution, state agency and the composite one.
This composite “institutional status of beneficiary” consists of a combination of two or more beneficiaries of different institutional status. In this paper, patents of state agencies and of composite forms of institutional status are concentrated in the category “rest patents”. As for the technology criterion, patents have been classified first in 8 different technology sectors (human necessities, performing operations – transporting, chemistry – metallurgy, textiles – paper, fixed constructions, mechanical engineering — lighting — heating – weapons- blasting, physics, and electricity) and further, into 20 different sub-sectors, 118 classes, 623 sub-classes and 2200 main groups. Our classification is based on the interpretation of the patent codes (WIPO codification).
The Main Features of the Total Patent Activity in Greece: National Origin and Institutional Status
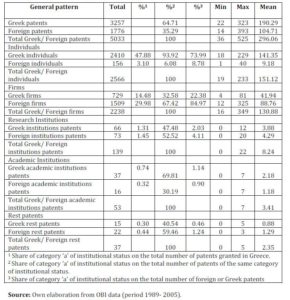
As presented in table 1, the majority of patents granted in Greece originate from firms (44.46%), and individuals (50.98%). In the rest of institutional categories, very small percentages are recorded (2.76% for research institutions, 1.06% for academic institutions, and 0.74% for the category of “rest patents”). The number of patents granted in Greece has increased over time, though significantly varying from year to year. If the patents are divided into Greek and foreign, one can observe that a 35.37% of them are foreign and the 64.28% are Greek. In total, while in the beginning of the period 6 Greek patents corresponded to 9 foreign, gradually, this pattern was reversed and at the end of the period at least 10 Greek patents correspond to one foreign.
Table 1: The Patent Activity in Greece- National Origin and Institutional Status

In the case of the sub set of foreign patents, we observe that the majority is registered by firms. This total sub set of foreign patents belongs to 581 different foreign firms from different countries. The 72.97% of them own one patent in Greece, while only the 1.2% of foreign firms own more than 20 patents in total. These persistent foreign firms are the following: Alza Corporation (22 patents), Colgate- Palmolive Company (137), Ethicon Inc. (122), Johnson & Johnson Consumer Products Inc. (79), Mcneil Consumer Products Co. (76), and Ortho Diagnostic System Inc. (26).
From our internet research it is found that these firms belong to broader groups of companies and in some of them relation- ships of mother- daughter or daughter- daughter in the context of multinational firms are recorded. From the top 20 foreign patent owners, 12 come from USA, 3 from Britain and 2 from Hungary. Most of them are in the sector of chemicals and particularly in pharmaceuticals and related products. Two of them focus on biotechnology. The rest foreign firms are involved in the construction of instruments, products from various metals, as well as machines and equipment (e.g. agricultural and professional equipment).
The categories other than firms, i.e. individuals, research institutions and academic institutions are represented with small or very small percentages of 8.78%, 4.11% και 0.90% respectively. On the contrary, the majority of the Greek patents are registered by Greek individuals the participation of which is quite high 73.99% of the total for the whole period under consideration. The percentage of the Greek companies reaches a 22.38% of the total. The percentages of the rest institutional categories, i.e. of the research and academic institutions, is significantly limited and comes to a 2.03% for the Greek research institutions and even lower for the academic ones (1.14%).
The Technological Content of the Total Patent Activity in Greece: Technology Sectors and Classes
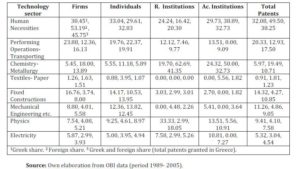
At the level of technology sectors, foreign and Greek patents are concentrated in “human necessities” (38.25%) (table 2). The rest of technology sectors show quite lower percentages, “electricity”, and “textiles-paper” showing the lowest (4.54% and 1.23% respectively). In the case of foreign patents granted in Greece, the sector of “human necessities” is prominent with a 49.50%. The sectors “chemistry — metallurgy” and “performing operations – transporting” follow with 19.49% και 12.93% respectively. In the case of Greek patents, the most important sectors are “human necessities” (32.08%) and “performing operations – transporting” (20.33%). Important are also the sectors of “fixed constructions” (14.32%) and “mechanical engineering — lighting — heating — weapons – blasting” (11.26%).
Table 2: The Distribution of Patents across Different Technology Sectors Based on Their National Origin and Institutional Status (%)

The “human necessities” sector is strong in relation with the total of foreign patents granted in Greece, and more specifically with those granted to firms (table 3). The Greek patents almost totally, with the exception of research institutions, contribute more to the percentages of the sector of “performing operations- transporting”.
The sector “chemistry-metallurgy” is stronger among the foreign patents with the exception of foreign individuals. The sector of “textiles — paper” is almost weak in all institutional categories with the exception of foreign academic institutions. The sector of “fixed constructions” owes its share to the Greek patents, while the sector of “mechanical engineering — lighting — heating — weapons – blasting” to private individuals both Greek and foreign. Finally, the patents of Greek research and academic institutions mainly specialize in “physics” and “electricity”.
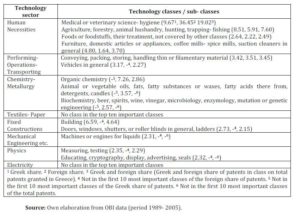
A closer examination of the technology taxonomy at the level of technology class (table 3) shows that inside “human necessities”, “medical or veterinary science- hygiene” is the most important class, regardless of the national origin and the institutional status of patents. However, there are differences between the distributions of the Greek and foreign patents. Greek patents are more related to “agriculture, forestry, animal husbandry, hunting, trapping- fishing” (e.g. planting; sowing; fertilising; harvesting; mowing; animal husbandry) and “building” (e.g. general building constructions; finishing works on buildings). On the contrary, foreign patents are more related to “medical or veterinary science hygiene” (e.g. preparations for medical, dental or toilet purposes, diagnosis; surgery; identification, filters; prostheses; medical devices) and specific classes of “chemistry” (e.g. heterocyclic compounds, detergent compositions; use of single substances as detergents, soap or soap-making, recovery of glycerol).
Table 3: Distribution of Greek and Foreign Patents According to Technology Classes- First 10 Most Important Classes

Discussion- Synthesis of Results
From the 5033 patent grants filed in Greece during 1989-2005, 64.71% were Greek-domestic patents and 35.29% were foreign. Over time, the number of Greek-domestic patents increased by 1147% much more than that of foreign patents (change of 96.42%). As a result, the ratio of Greek-domestic patents to foreign has changed from 61- 39% to 91- 9%.
Our analysis shows that patenting is not a major factor in the development of Greek firms. The Greek-domestic patent activity is characterized by the large share of patents granted by Greek individuals. More specifically, the share of this ownership category is 47.88% for the whole period of analysis falling only to 20-25% during 1991- 1992 and keeping high shares (around 50%) for many years. If we consider only the Greek – domestic patent activity the share of Greek individuals’ patents rises to 73.99%. Greek firms and their patents rank second but with a much lower share. Their share is 14.48% in the total patent activity which rises to 22.38% if we consider only the Greek-domestic patent activity. The patents of Research and Academic Institutions account for 1.31% and 0.74% in the total sample or 2.03% and 1.14% in the Greek activity respectively.
Greece isn’t the only country with a large share of individuals in national patent activities. Many developing countries have the same pattern. Penrose argues that the fact that a large share of patents is made by individuals is a characteristic of less developed countries (in Albuquerque 2000). In India, the individuals’ share is 36.4%, in Mexico 60.4%, as Aboites and Betran (2008) mention and in Taiwan 78.6%, as Choung (1995) argues. In Israel, approximately 60% of domestic patent applications are owned by individuals and this share is being highly stable over time. On the contrary, the share of individuals in other countries is much lower than in Greece, ranging from 25% in the USA to 36% in Norway in the 1980s (Herskovic & Shalit 1999).
The share of foreign patent activity in Greece is large, at least for half the period of analysis (around 1998). After 2000, it decreases, but we suspect that this is only deceptive since foreign assignees can use the European Patent Office procedure in order to protect their inventions in Greece. The fact that the foreign patent activity is high doesn’t only happen in Greece. Israel is also characterized by the same pattern (77% in 1980s) which for some time is a common feature of the patent systems in small developed and developing countries. During the 1980s, the foreign patent activity in countries such as Holland. Belgium and Canada accounted for more than 90% of total national patents. Unlike the domestic patent activity in Greece, the vast majority of foreign patents are filed by firms with an average of 88.76% for the whole period of analysis. On the other hand, the share of Individuals Research and Academic Institutions is very low and represents the 3.10%, 1.45% and 0.32% of the total sample (8.78%, 4.11% and 0.90% in the sample of foreign patents respectively).
The Greek-domestic patent activity in Greece is widely dispersed among the 8 broad technology sectors. The sector of “human necessities” (32.08%) ranks first but three sectors (“performing operations- transporting”, “fixed constructions”, “mechanical engineering- lighting- heating- weapons- blasting”) have shares that exceed 10%. The shares of “electricity”, “physics” and “chemistry- metallurgy” are higher for both Research and Academic Institutions, while in “fixed constructions” the highest shares are those of Greek firms and individuals. “Mechanical engineering- lighting- heating- weapons-blasting” is more important for Greek individuals and “textiles- paper” is over-represented with few patents (21 patents) which are shared between Greek firms and individuals. Over time, the shares of “human necessities”, “electricity” and “mechanical engineering-lighting- heating- weapons- blasting” decrease, while the shares of “fixed constructions” and “physics” increase.
The foreign patent activity in Greece is concentrated on three broad technology sectors, namely “human necessities” (49.50%), “chemistry- metallurgy” (19.49%) and “performing operations- transporting” (12.93%). The share of “human necessities” is larger for firm patents. “chemistry- metallurgy” is more important for Research and Academic Institutions (62.69% and 50.00% respectively) and “performing operations- transporting” is one of the main technology sectors for foreign individuals. Diachronically, the shares of “human necessities” and “mechanical engineering- lighting- heating- weapons- blasting” decreased, while the shares of “fixed constructions”, “performing operations- transporting” and “chemistry- metallurgy” increased.
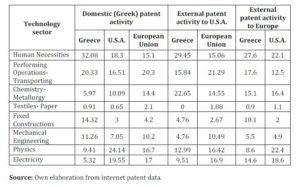
“Human necessities” are a very important technology sector not only in Greece, but in other countries as well. A large number of patents granted at the U.S.A. office and coming from countries like Denmark, Hungary, Poland, Portugal, and Slovakia follow the same pattern. On the contrary, in Germany and France is recorded a different technology taxonomy: Technologies of “Performing Operations- Transporting” come first, these of “electricity” are second and technologies of “physics” rank third. So overall, Greece has one of the largest concentrations in “human necessities” and this pattern is recorded in the patent offices of Europe and U.S.A. too (table 4). At the same time, an unusually large share of patents is related to “fixed constructions”. This share outgrows by 400% the relative share of patents coming from U.S.A. and by 240% the relative share of patents coming from the European Union. On the contrary, the insufficiency of Greece in the sectors of “chemistry- metallurgy”, “physics” and “electricity” is more than obvious.
Table 4: Distribution of Greek Patents According to Technology Sectors- Greek Office, U.S.A. Office and European Patent Office

However, one main question remains: Do new Greek technologies (based on patents) fall into line more or less with those that are protected internationally?. In other worlds, “Does Greece move in the ‘right’ direction?”. If we compare the Greek technology taxonomy with the OECD technology taxonomy we can see that there are more than thirty technology subclasses that are recorded in both taxonomies. The most important among them based on their relative rank are the following: “hygiene preparations for medical, dental, or toilet purposes”, “separation” and “pipes, joints or fittings for pipes, means for thermal insulation in general”. In two sub-classes, the two technology rankings are identical: In “diagnosis, surgery, identification” and in “vehicles, vehicles fittings or vehicle parts”.
If we consider that the OECD taxonomy of the 42 sub-classes, as mentioned by Khan and Dernis (2006), presents in some way the new technologies that dominate or will dominate in the word, then we can argue that the R&D activities focus on the development of technologies related to “chemical products”, “biotechnology”, “ICT equipment”, “instruments” and “computers and office machines”. According to the Eurostat for the year 2002 in the Europe of 25 member- states, the 83% of patent applications at the European patent office were related to “chemical products”, “machines and equipment”, “electrical and optical equipment” and “transport equipment” with shares of 22.7%, 12.3%, 35.3% and 13.2% respectively (16.6% for the “rest of manufacturing”).
The Greek shares are above the European average in the “chemical products” and the “rest of manufacturing”, at the European average in the “machines and equipment” and below in the “electrical and optical equipment” and “transport equipment” (Eurostat 3/2006). However deepening, we can see that the Greek patents are characterized by a more traditional technology orientation: Only the 1.5%, 2.63% and 2% of the Greek patents are related to “biotechnology”, “information and communication technologies” and “computers and office machines”.
The study of the patterns of innovation and knowledge creation in Greece was the main issue of this paper. Greece is a small European country in the Mediterranean Sea, with a long history and a very old civilization, but also with a developing economy and a problematic economic and industrial structure. Greece is far from an innovation leader.
It is usually classified with countries that “are approaching” (e.g. Slovenia, Poland, Portugal) or “are lagging” (e.g. Turkey, Slovakia, Brazil) in many studies. Its R&D system is characterized by the fact that R&D activities are mainly executed and financed by the public sector, while the private participation is very low. The sector of education performs much better, but it has been accused to be too science and academic oriented and far away from the needs of the market. We strongly believe that this traditional, in nature, industrial structure and this public, in behavior, R&D system has influenced deeply its technological performance and this paper is a first attempt to prove it.
References
Aboites, J. & Betran, T. (2008). “Comparison of Patterns in Knowledge Diffusion from The US To South East Asia (Korea And Taiwan) And Latin America (Brazil And Mexico). 1976-2002,” Proceedings of the 4th Globelics Conference, 22-24 September 2008, Mexico City, Mexico.
Publisher –Google Scholar
Albuquerque, E. (2000). “Domestic Patents and Developing Countries: Arguments for their Study and Data from Brazil (1980-1995),” Research Policy, 29 (9). 1047-1060.
Publisher – Google Scholar
Archibugi, D. (1992). “Patenting as an Indicator of Technological Innovation: A Review,” Science and Public Policy, 19 (6). 357-368.
Google Scholar – British Library Direct
Archibugi, D. & Pianta, M. (1992). The Technological Specialization of Advanced Countries. A Report to the EEC on International Science and Technology Activities, Kluwer Academic Publishers, Dordrecht.
Publisher – Google Scholar
Basberg, B. L. (1983). “Foreign Patenting in the US as a Technology Indicator. The Case of Norway,” Research Policy, 12 (4). 227-237.
Publisher – Google Scholar
Choung, J., (1995). “Technological Capabilities of Korea and Taiwan: An Analysis Using Us Patenting Statistics,” [Online], http://sussex.ac.uk/units/spru/publications/imprint/steepdps/26.
Publisher – Google Scholar
Eurostat. (2003). Statistics in Focus: Increase of Patent Applications to the EPO in the ICT Sector between 1991 and 2001, Eurostat, Paris.
Grupp, H. (1990). “Technometrics as a Missing Link in Science and Technology Indicators,” Measuring the Dynamics of Technological Change, Sigurdson, J. (ed). Pinter, London.
Publisher – Google Scholar
Herskovic, S. & Shalit, S. (1999). “The Meaning of Patents in Israel – A Statistical Review,” Proceedings of the Forum Sapir Conference, 21 January 1999, Tel Aviv, Israel.
ICAP. (2005). The Greek Economic Guide, ICAP, Athens.
Khan, M. & Dernis, H. (2006) “Global Overview of Innovative Activities from the Patent Indicators Perspective,” OECD, Paris.
Publisher – Google Scholar
Mansfield, E., Schwartz, M. & Wagner, S. (1981). “Imitation Costs and Patents: An Empirical Study,” The Economic Journal, 91 (364). 907-918.
Publisher – Google Scholar
Mogee, M. E. (1991). “Using Patent Data for Technology Analysis and Planning,” Research Technology Management, 34 (4). 43-49.
Google Scholar
OBI. (1989-2005). Industrial Property Bulletins, Greek Industrial Property Organization, Athens.
OECD. (1994). Using Patent Data as Science and Technology Indicators, Patent Manual, OECD, Paris.
Publisher
Pavitt, K. (1984). “Sectoral Patterns of Technological Change: Towards a Taxonomy and a Theory,” Research Policy, 13 (6). 343-373.
Publisher – Google Scholar
Pavitt, K. (1985). Patent Statistics as Indicators of Innovative Activities: Possibilities and Problems, Scientometrics, 7 (1-2). 77-99.
Publisher – Google Scholar
Pavitt, K. (1988). Uses and Abuses of Patent Statistics, Handbook of Quantitative Studies of Science and Technology, Raan, AGJ. (ed). North Holland, Amsterdam.
Google Scholar


