Introduction
The use of World Wide Web technology has been changing to enhance collaboration, information sharing, communications, and participation of end users. The technology makes the cost of distributing information cheaper and more efficient. In online markets it breaks time and geographical boundaries for online shoppers and provides alternative business channels such as taking orders, receiving payments for merchants, and marketing. It brings openness, connectivity, and integration among businesses between businesses and customers. However, the challenges that consumers have to face in e-commerce are the uncertainties of accuracy of information, the true identities of transaction partners, and the quality of products. People instill trust within each other every day through face-to-face interactions or via phone. When consumers make transactions online or explore a website, more often than not they do not know the persons or vendors they transact with. E-commerce brings challenges into the traditional trust constructing processes.
Trust plays a key role in business-to-consumer (B2C) and business-to-business (B2B) online transactions, which affects the success of business for Web vendors. Consumers are more willing to adopt E-Commerce and to make a transaction with unknown or unseen vendors if they trust the vendors and consider it safe to disclose private information with them.
Feedback reporting systems (i.e., eBay reputation reporting system) and the market of evaluation offer some solutions to the problems in the online marketplace. People can leave feedback about the seller that they made the transaction with and/or they can leave a rating or a recommendation about a product after buying and consuming the product such as on Epinion.com. Other consumers benefit from these evaluations and can now make better informed decisions about k about the sellers and the products they sell. The evaluations through feedback can help reduce the information asymmetry, encourage cooperation, improve efficiency of online market, and build the trust in e-commerce.
The market of evaluation, such as the mechanism in Epinion, eBay, TripAdvisor, and Amazon, continues to grow successfully and rapidly every day. The statistics shows that people use the evaluation when they make transactions. For example, AuctionBytes finds that 80% consumers look at the number of negative and neutral reviews of sellers before they purchase a product from the seller on eBay. People also look at the evaluations of products online before they make purchases. People consider reviews provided by other users more trustworthy than information listed by marketers in general. They can get indirect experiences and valuable information from online reviews, and make better informed purchasing decisions.
Consumers are frequently influenced by online reviews and tend to mimic others’ behaviors. Group mimicking behaviors refer to the situations in which people include information from users’ behaviors and disregard their own information when they make decisions. The complexity of decision making and the complicated options may be possible reasons of such herding behaviors. The group mimicking behavior shows that people have intention to conform to what decisions others make. The opinions of consumers on the trustworthiness of sellers and the quality of product can be formed by online reviews. It implies that the popularity of a product or service can generate potential sales and revenues.
The magnificent power of crowds leads to upward sales forecast for products or services with excellent reviews. The popularity of a product or service brings more awareness from consumers. When a consumer is faced with plentiful information and intricate decisions they tend to imitate other peoples’ decision making behaviors. If a product or service is more popular, herding behaviors suggest that the higher adoption rate of the product or service can be expected.
In this study, we use hotel data downloaded from TripAdvisor to examine the influence of popularity and the components of popularity. The paper is organized as follows. In Section 2, we give a literature review. We also survey papers that study trust, reputation and popularity. In Section 3, we provide the detailed information on data collection and research design. In addition, we propose several hypotheses based on the literature of trust, reputation, and popularity. In Section 4, we test the hypotheses and describe the findings. Furthermore, we conclude our paper in Section 5.
Literature Review
Studies of trust in e-commerce are closely related to this work. McKnight et al.(2000, 2002) validate measures for a multi-dimensional model of trust and show how the trustworthy relationship is constructed between consumers and vendors. The antecedents of trust also have been identified in many papers. The antecedents may be psychological reasons, institutional structures, transactional features, culture difference, and many other factors. Kim et al. (2008) define the trust dimensions and subdimensions, and show that trust is a complex concept and may depend on many aspects. Current empirical studies of trust test a list of antecedents which may be either incomplete or inconsistent in each paper. One of reasons of the inconsistency may be that trust is context-dependent. Under different situations, trust may be formed differently. For instance, Everard and Galletta (2006)] find that the perceived quality of website explains 53% of the variance in trust, while Palou and Gefen (2005) find that the antecedents are the consumers’ familiarity with a vendor and their disposition. In another paper (Gefen 2000), Gefen uses the integrity, competence, and benevolence of vendors as the antecedents of trust and find they are significant. Gefen et al. (2003) consider the perceived usefulness (PU) and perceived ease of use (PEOU) as another two antecedents of trust when they study the same relationship of trust with online purchase intention. Bigley and Pearce (1998) discuss current studies in trust and distrust topic and point out inconsistency among the works. They suggest two ways to solve the inconsistency. Firstly, empirical studies should be conducted to check the specific problem and identify the antecedents of trust in specific context. Secondly, the problem-oriented scheme should be used to address trust issue.
It has been shown that trust has a positive effect on the consumers’ shopping behavior. Kim et al. (2008) find that trust positively affects the purchase intention in online market. The effect can be either direct or indirect. The indirect effect is through reducing the perceived risk. Some researchers demonstrate the relationship between trust and risk on the shopping behavior. Porter and Donthu (2008) find that trust in a community sponsor increases the users’ willingness to share private information or to cooperate in new product development and their loyalty. Song and Zahedi (2007) show that the propensity to trust positively relates with risk beliefs, and trust and risk beliefs can positively influence consumers’ adoption behaviors. Interestingly, the statements of privacy or disclosure and other trust signs have no direct effect on risk beliefs. Cheung and Lee (2001) demonstrate that trust affects the perceived risk of online shopping. Cyr (2008) examines the effect of trust on different types of consumers. He finds that trust is positively related with e-loyalty and more significant to risk-averse consumers than satisfaction is.
Reputation mechanism in e-commerce is studied closely with trust. Dellarocas (2005) offers a study how the reputation mechanism parameters plays a role in trust on e-commerce market. Resnick et al. (2006) discuss the reputation reporting system and point out the requirements and challenges. The authors suggest that an effective reputation system must have three properties: long-lived entities, use of feedback to help trust decisions, and the distribution and capture of feedback about current interactions. Empirical studies focus on the reputation reporting system and show the statistics of all types of feedbacks and the relationship of reputation with price premium and probability of selling products. Pavlou and Gefen (2005) study the reputation system and they think that a positive or negative feedback depends not on the quality of products but on the satisfaction of buyers to the service of seller. The value of rating is affected by the buyer’s perception whether they are treated wrongly. Whitby et al. (2005) are among researchers who use the Bayesian rule to study the exclusion of unfair ratings. Dellarocas (2003, 2005, 2006) use the collaborative filtering technique and study how to exclude unfair ratings and build a reliable rating system.
Studies (e.g. Cialdini et al., 1997, Cialdini and Goldstein, 2004) show that popularity information of products or services influences consumer’s purchase behaviors significantly. Chen (2008) examines four different herding behaviors in online book purchases. It shows that online star ratings and sale volumes are positively related to potential purchase choices. The author finds that people consider product evaluations and others’ decisions when making their own decisions. This research is closely related to the study by Zhang (2015). Zhang (2015) downloads the reviews of hotels in Las Vegas, Nevada, USA and examines the customer satisfaction and its components. The study shows that reputation is positively related to customer satisfaction. The limitation of the study is that the data sample is based on hotels in Las Vegas, Nevada, USA.
Research Design
Sample Data
We write a Java crawler and download hotel reviews from TripAdvisor.com. TripAdvisor is one of many websites where lodgers can evaluate a hotel after their stay. These websites (e.g., TripAdvisor, Hitwise, and Oyster.com) provide platforms for travelers to exchange information and make recommendations. Travelers check information on these platforms when they are planning trips. Based on the statistics released by U.S. Travel Association, “Nearly 79 percent of the 135 million online travelers, equating to 105 million U.S. adults, used the Internet to plan their trips during the past 12 months.”
TripAdvisor is the largest online travel community in the world (TripAdvisor Fact Sheet, 2013). It has over 260 million unique reviewers, and more than 100 million reviews. The reviews cover hotels, attractions, and restaurants over 30 countries. It is a powerful interface for travelers to find related information while planning their trips.
We download 105,069 reviews from 1642 hotels worldwide. For each review, there are seven numeric ratings with regard to the overall, cleanliness, location, service, room, value, and service of hotel. These are numeric data, ranging from 1 to 5. Higher number stands for more satisfaction of a reviewer towards the hotel. Overall ratings measure a hotel in terms of its overall service and facilities. Other ratings, such as cleanness, location, service, business, room, and value rating, are the ratings for each aspect.
In addition to numeric ratings, the downloaded data also have numeric data such as the popularity index of hotels, and. The number of reviews can be aggregated from the downloaded data. The popularity index shows how popular a hotel is. The average year around price is the mean of prices throughout the year listed on TripAdvisor by a hotel. The number of reviews shows how many reviews each hotel has received.
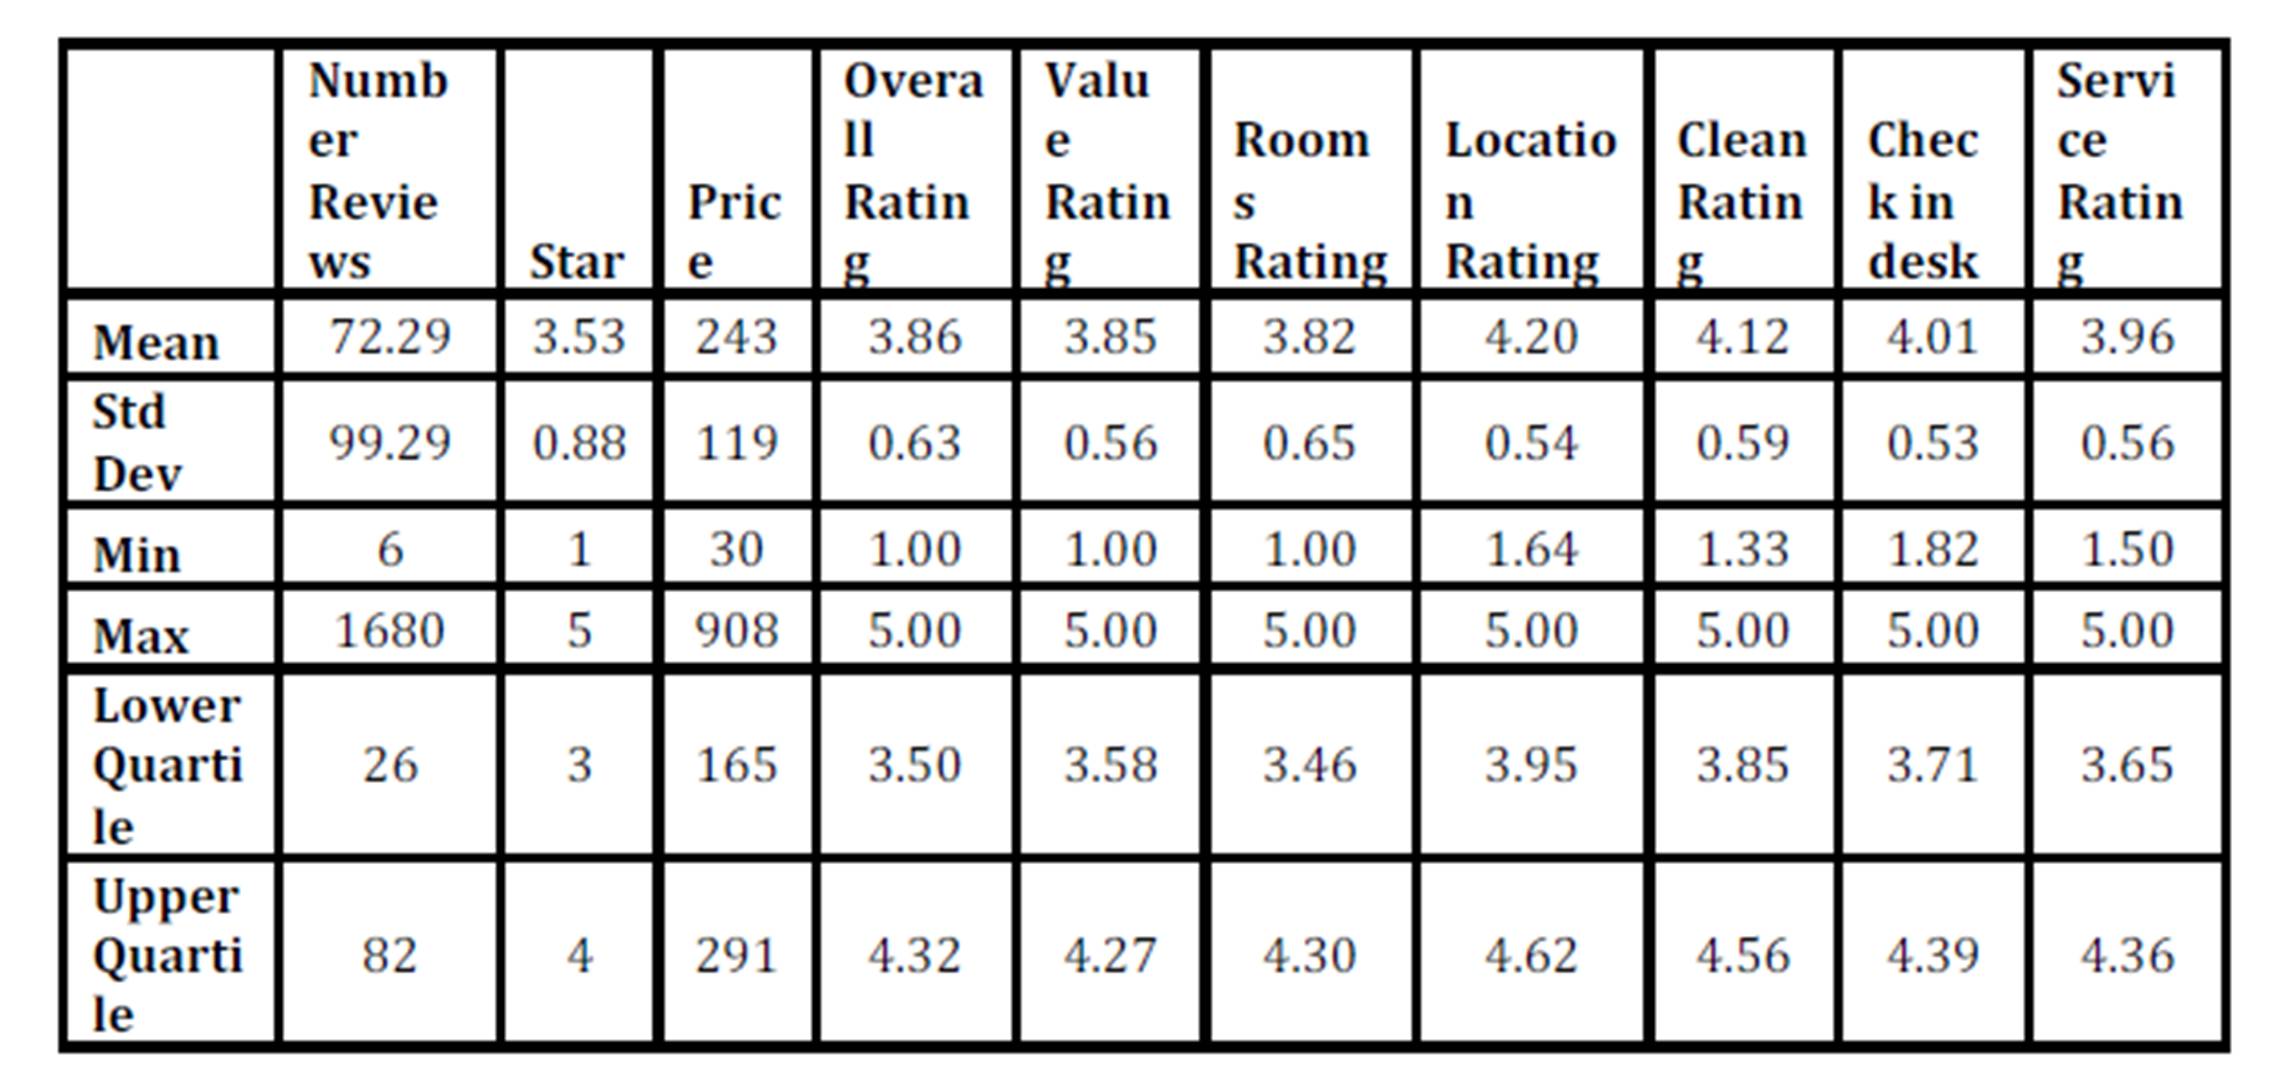
Also, reviewers write review text besides of ratings. Review texts are generally short and only have a few paragraphs. Reviewers mention smoking smell, swimming pool, the atmosphere of dining area, the courtesy of staff, etc. There are some reviews that only have ratings without comments. Those reviews without comments are excluded from the study. The data we use for hypotheses tests have completed numeric ratings and review texts. Only the reviews with text comments are reserved for this analysis. Furthermore, some reviewers submit their reviews multiple times. Duplicate reviews are also removed. The deletion of redundant reviews and reviews with missing text or ratings has limited impact on the sample size. After removing those reviews, each hotel has 72.29 reviews on average. The descriptive statistics of hotel data is listed in the following Table1.
Table 1: Summary of Hotel Reviews
As shown in Table 1, the number of reviews for each hotel is 72.29 on average. The maximum number of reviews is 1,680 for the hotel Majestic Colonial, Punta Cana, Dominican Republic. The hotel that receives the second highest number of reviews is Gran Bahia Principe Bavaro, Punta Cana, Dominican Republic, which has 1095 reviews, followed by the hotel Melia Caribe Tropical, Punta Cana, Dominican Republic with 599 reviews. The hotel that has the least number of reviews is Rodeway Inn, San Francisco California, USA, which has 6 reviews after the reviews with missing data are removed.
The hotel star ranges from 1 to 5. The highest average year around price of a hotel is $908, which is Tortuga Bay, Punta Cana, Dominican Republic. The lowest year around price is $30 for Hostal Cruz Sol, Madrid. Table 1 shows that the average overall rating is 3.86, the average value rating is 3.85, rooms rating is 3.82 (the lowest among all ratings), location rating is 4.2 (the highest of all ratings), clean rating is 4.12, check in/front desk is 4.01, and service rating is 3.96. Some hotels have chains in different locations and they may have different hotel star. These hotel chains have the same hotel ID. The price, hotel stars, ratings are averaged for the same hotel ID.
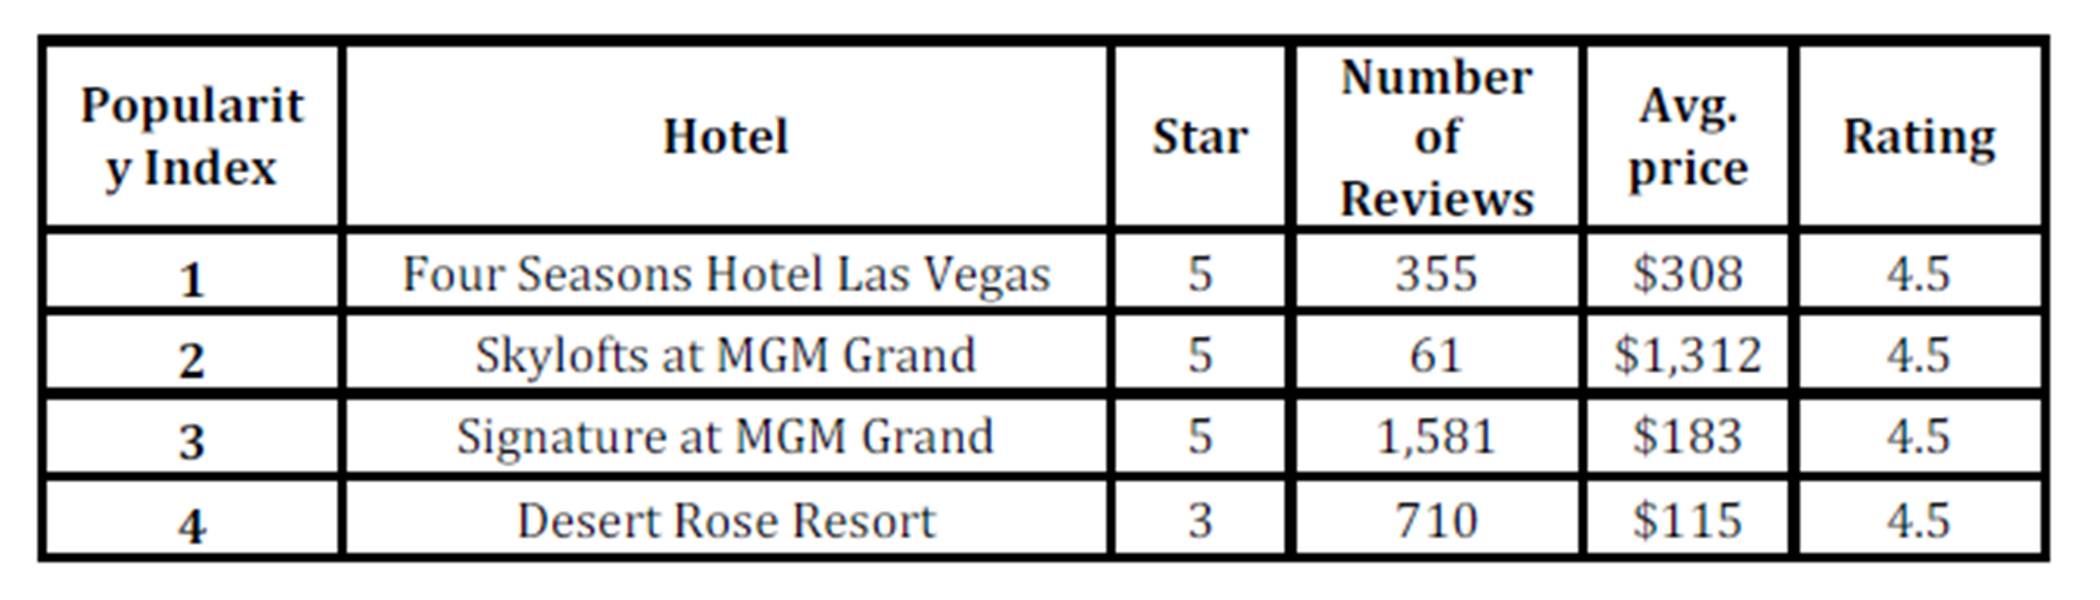
The popularity index of a hotel is also available in the downloaded data, but such information is only limited to hotels in Las Vegas, Nevada. The top 4 popular hotels in Las Vegas, Nevada, USA are Four Seasons Hotel Las Vegas, Skylofts at MGM Grand, Signature at MGM Grand, Desert Rose Resort, as listed in the Table 2. Top 3 are all 5 star hotels, and the prices are $308, $1312, and $183. The number four is Desert Rose Resort, a 3 star hotel. It has 710 reviews, and the price is $115.
Table 2: Top 4 Popular Hotels in Las Vegas
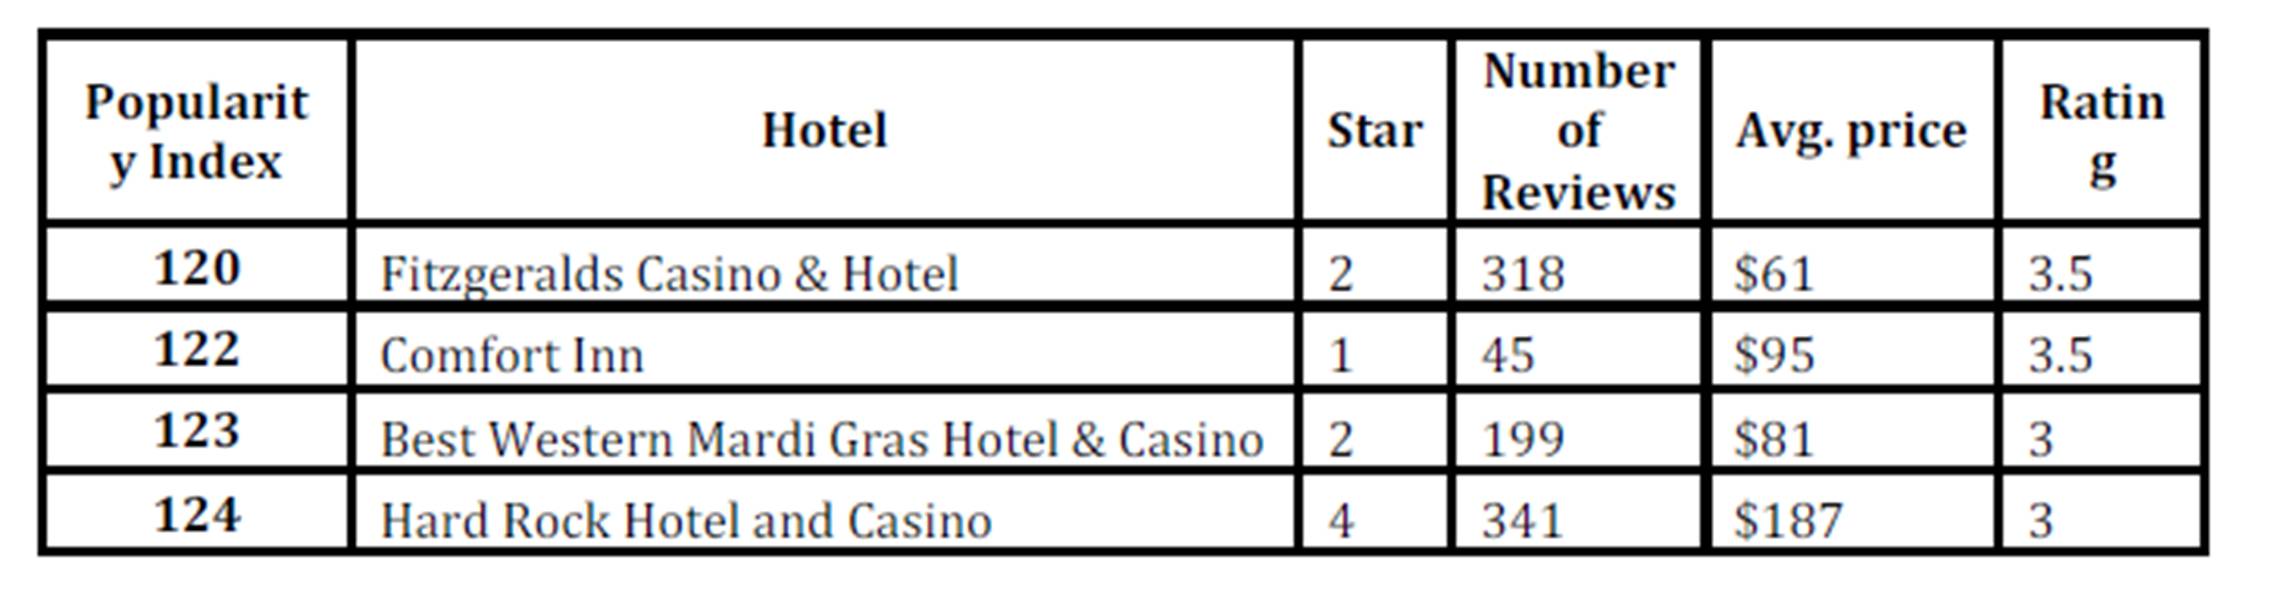
In Table 3, four less popular hotels are listed. Three of these hotels are 1 or 2 star hotels and the price is less than $100. Hard Rock Hotel and Casino is a 4 star hotel and its average year around price is $187. Table 3 is listed below.
Table 3: The Popularity Index of Hotel Samples in Las Vegas
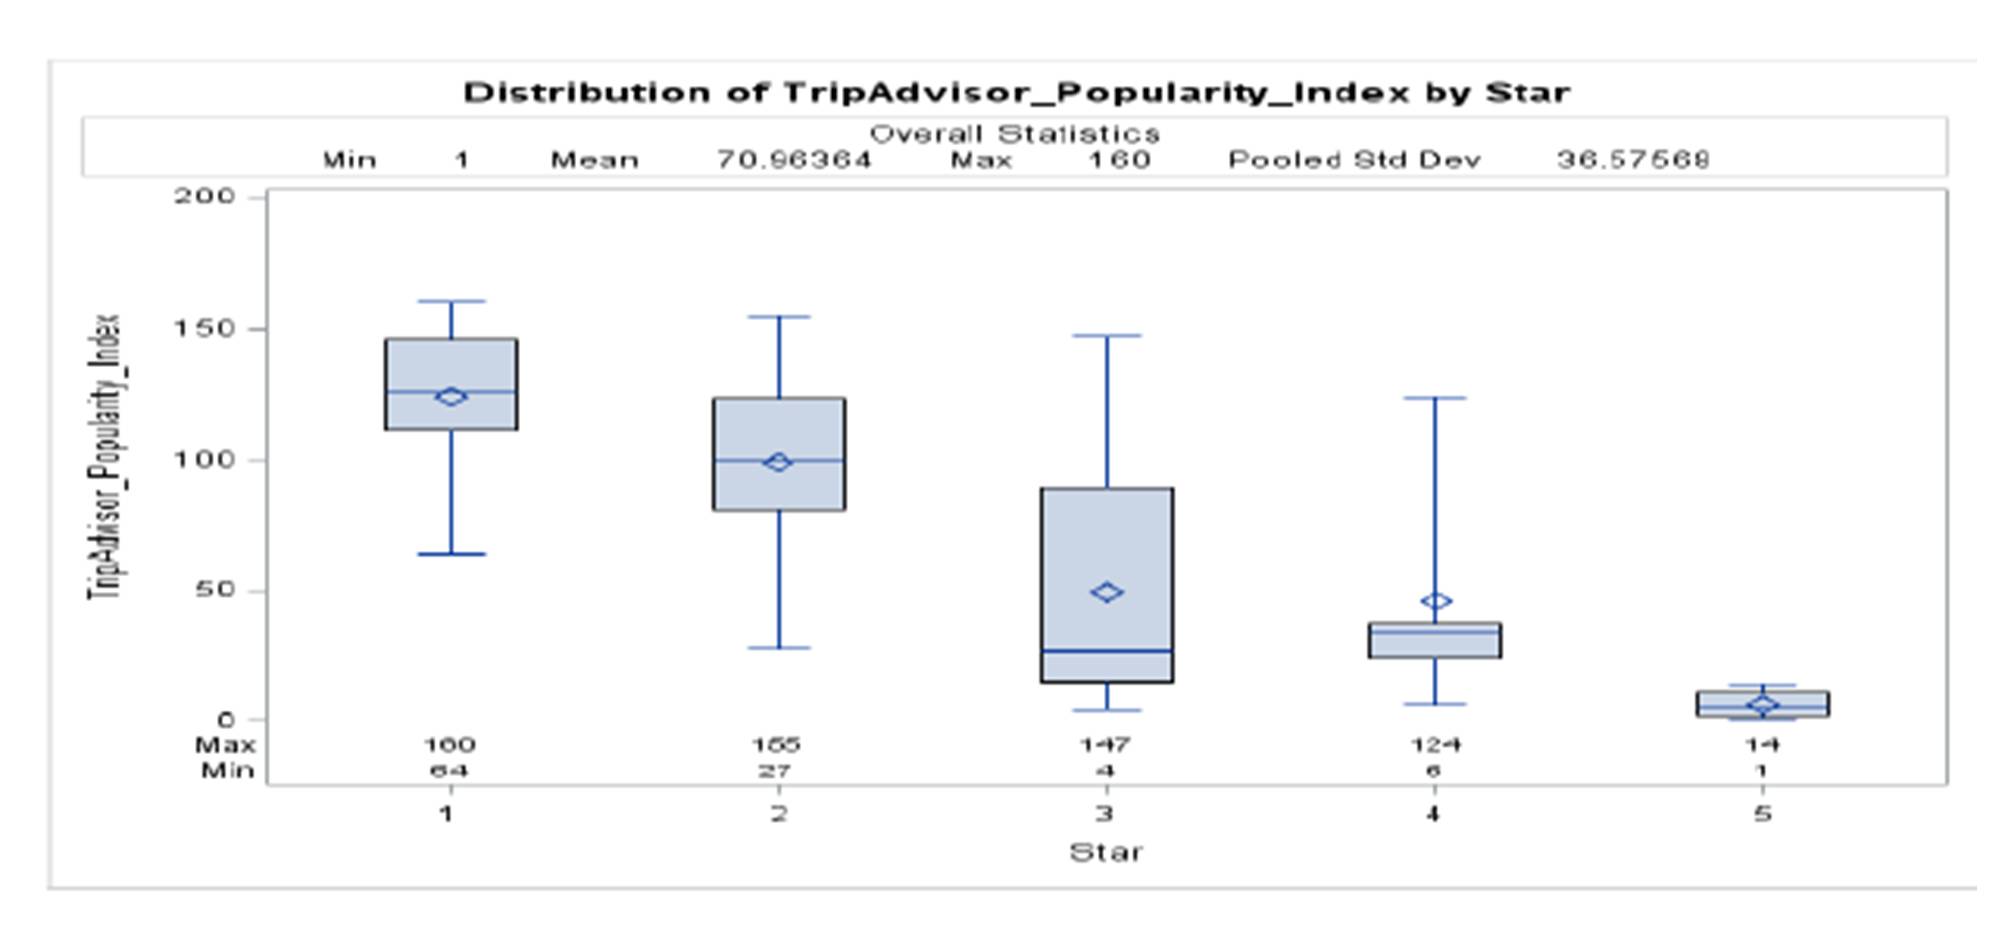
The popularity index of hotels is displayed with a boxplot for hotels with different star levels. As shown in the Figure 1, the popularity index is positively related to star levels. 5 star hotels are ranked higher than 4, 3, 2, and 1 star hotels. 1 star hotels are placed lower than hotels with other star levels. Interestingly, we observe that 4 star hotels have problems of excelling 3 star hotels in terms popularity. 3 star hotels are placed higher than 4 star hotels on average, though 3 star hotels have larger interquartile range in popularity indices.
Figure 1: Box Plot of Popularity Index by Star
Hypotheses
As mentioned above, the numeric ratings downloaded from TripAdvisor include overall rating, cleanliness rating, location rating, value rating, room rating, and service rating. Overall rating show how travelers evaluate a hotel overall. The higher the overall rating is, the better service level is perceived. It stands for the overall customer satisfaction. Ratings are subjective and are in view of users’ personal perspectives. People have different concerns when they lodge in hotels with different star levels. The ratings represent the standards of hotels in consumers’ perspectives. The cleanliness of hotel is one of the major concerns when people book hotels. Cleanliness rating shows how travelers evaluate the cleanliness of rooms, including bathrooms, bedrooms, working desk, etc. Location rating is about how convenient a hotel is located, for instance, easy access to shopping areas, restaurants, or tourist spots. Value rating indicates how travelers think if their lodging experience worth the amount of money they spent on hotel stays. Room rating explains how travelers view hotel rooms. Service rating describes the travelers’ perception of service quality.
The summary statistics of downloaded data show that the popularity index of a hotel may not be solely dependent on its star level. The popularity of a hotel can be determined by other factors, such as traveler ratings, price, and the number of reviewers. The popularity of a business should be correlated to the size of crowd that has attention to the business. The popularity also may be determined by the satisfaction of the crowd. Therefore, we hypothesize:
Hypothesis 1: The popularity index of a hotel is correlated with online ratings, star levels, and the number of reviews.
We see that 4 star hotels are mixed with 3 star hotels in terms of popularity, based on the statistics of hotel data. Intuitively, people perceive hotel with higher star level has better service and reputation. However, hotels with higher star level have higher average year around prices. The popularity of a hotel should be positively correlated with star levels, but can be impacted by other factors, such as price, location etc. We compare the popularity of hotels among various star levels. Therefore, we conjecture the following hypothesis.
Hypothesis 2: The popularity indices are different for star level hotels.
The popularity of a product or service has an impact on sales in general. Besides of overall ratings, travelers evaluate hotels in specific aspects, such as service, location, price, etc. The numeric ratings, including cleanliness rating, room rating, and value rating show the travelers’ perception on these aspects. We investigate the significant aspects that consumers concern about hotels. The determinants of popularity and important factors of popularity may not involve all aspects. Thus, we propose the following hypothesis.
Hypothesis 3: The popularity of a hotel is determined by its location, room cleanliness, and service.
The above hypotheses are tested with the downloaded hotel data. The test findings and the summary of analysis results are provided in the next section.
Findings
We use SAS 9.3 for conducting the tests. Linear Regression Analysis is used to test Hypothesis 1. Tukey test is used for testing Hypothesis 2, since in Hypothesis 2, we compare the difference of popularity among different star level hotels. Logistic Regression Analysis is used for Hypothesis 3 testing. The data we used for testing Hypothesis 1 and 2 are based on selected hotels in Las Vegas. The crawled data have hotel popularity index for these selected hotels. For Hypothesis 3, the data used for testing the hypothesis are 1,642 hotels worldwide.
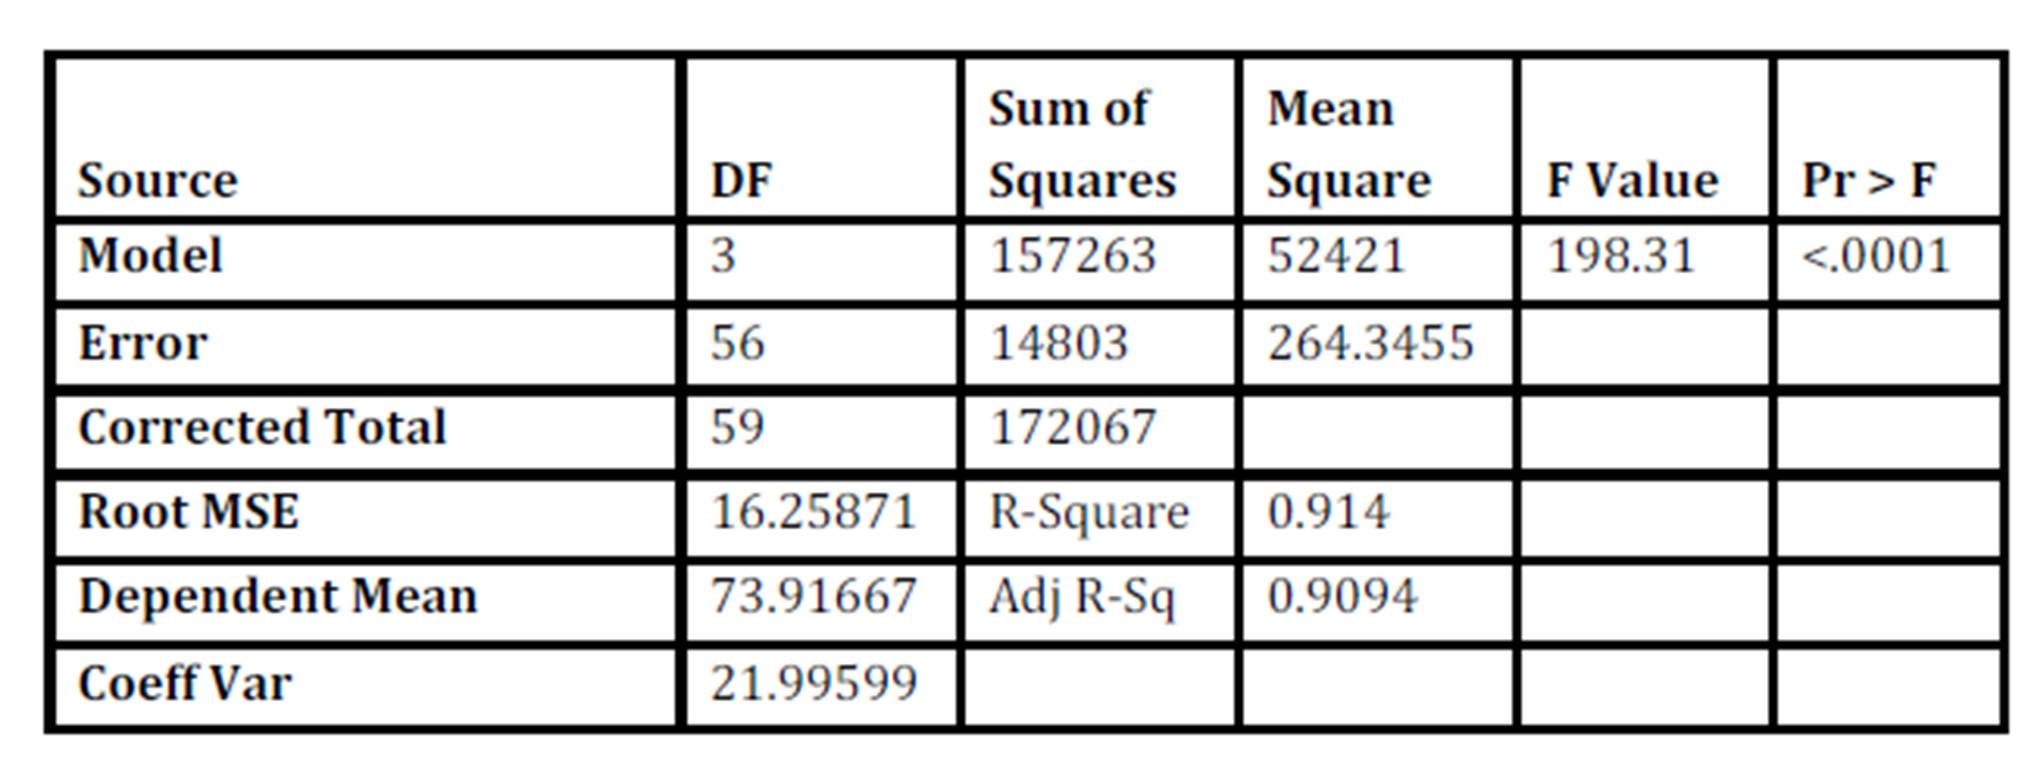
As we see from Table 4 and Table 5, the popularity index of a hotel is explained by the number of reviewers, travelers’ ratings, and hotel star levels. The R-square of model is 91.4%. The travelers’ overall ratings are the most significant factor, followed by the number of reviewers and hotel star levels. Therefore, the Hypothesis 1 is supported.
Table 4: Analysis of Variance from Linear Regression Model
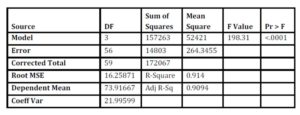
Table 5: Parameter Estimates from Linear Regression Model
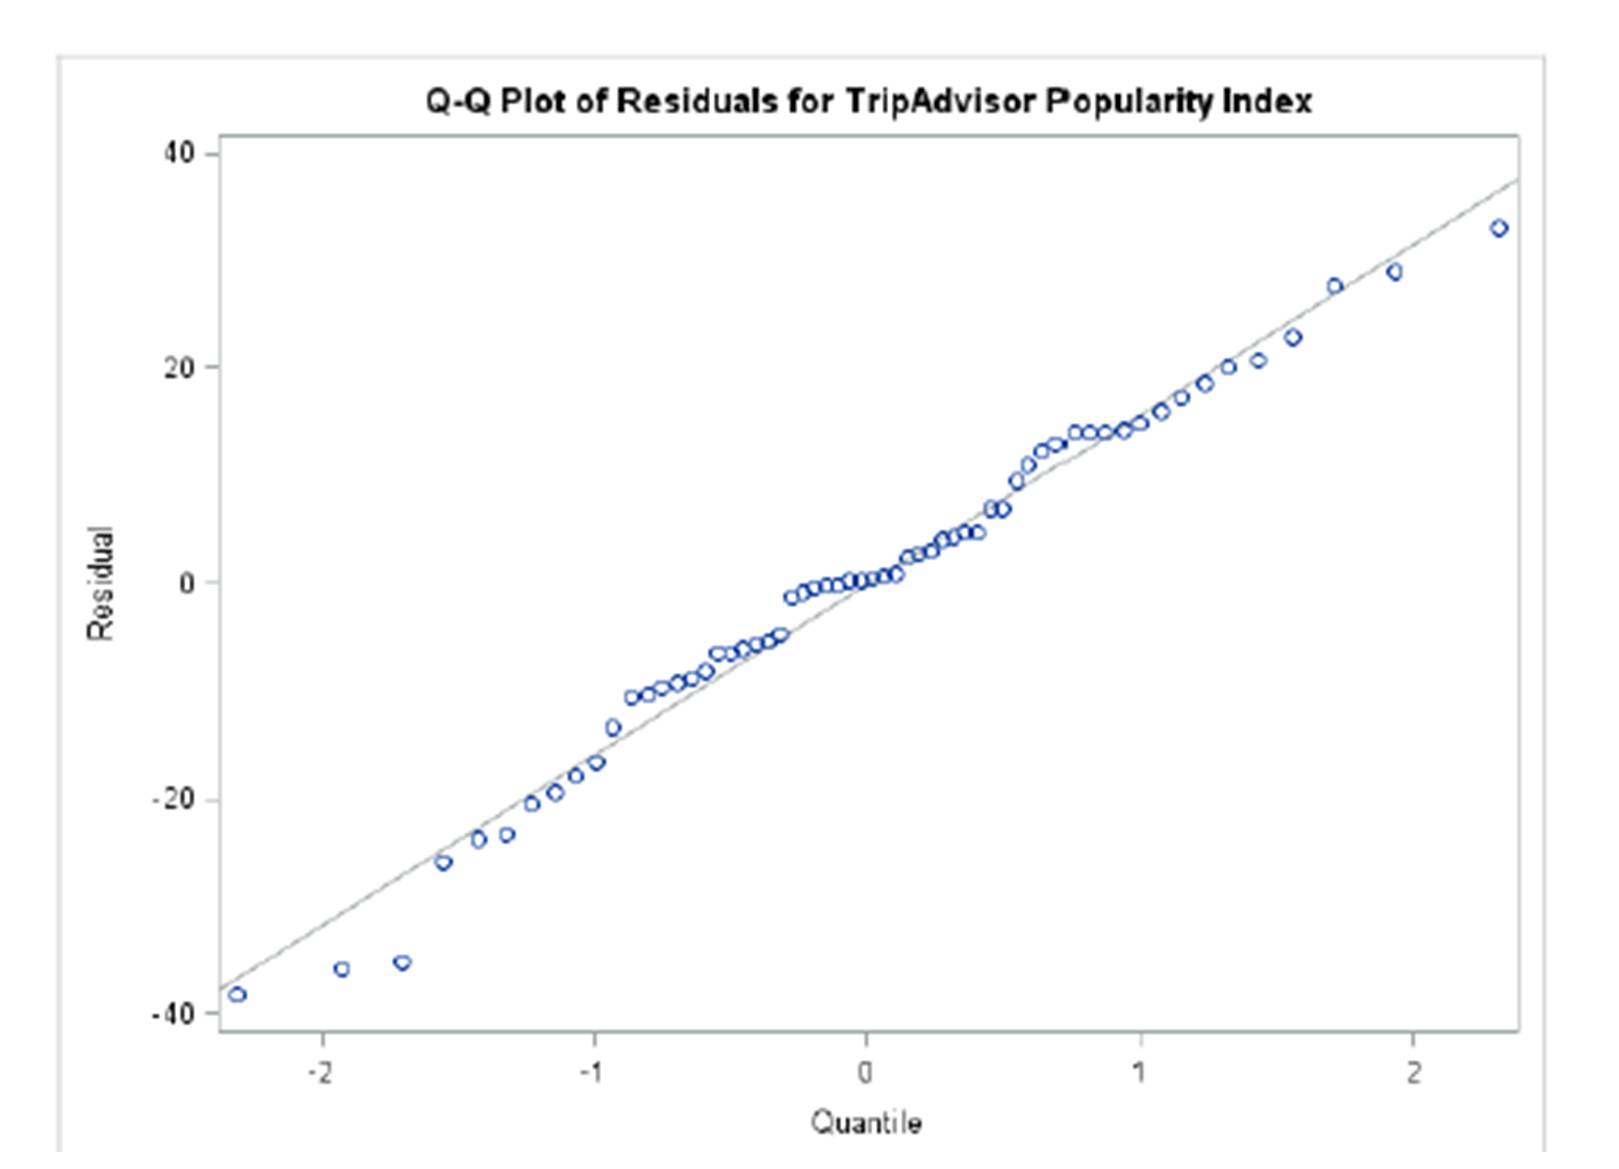
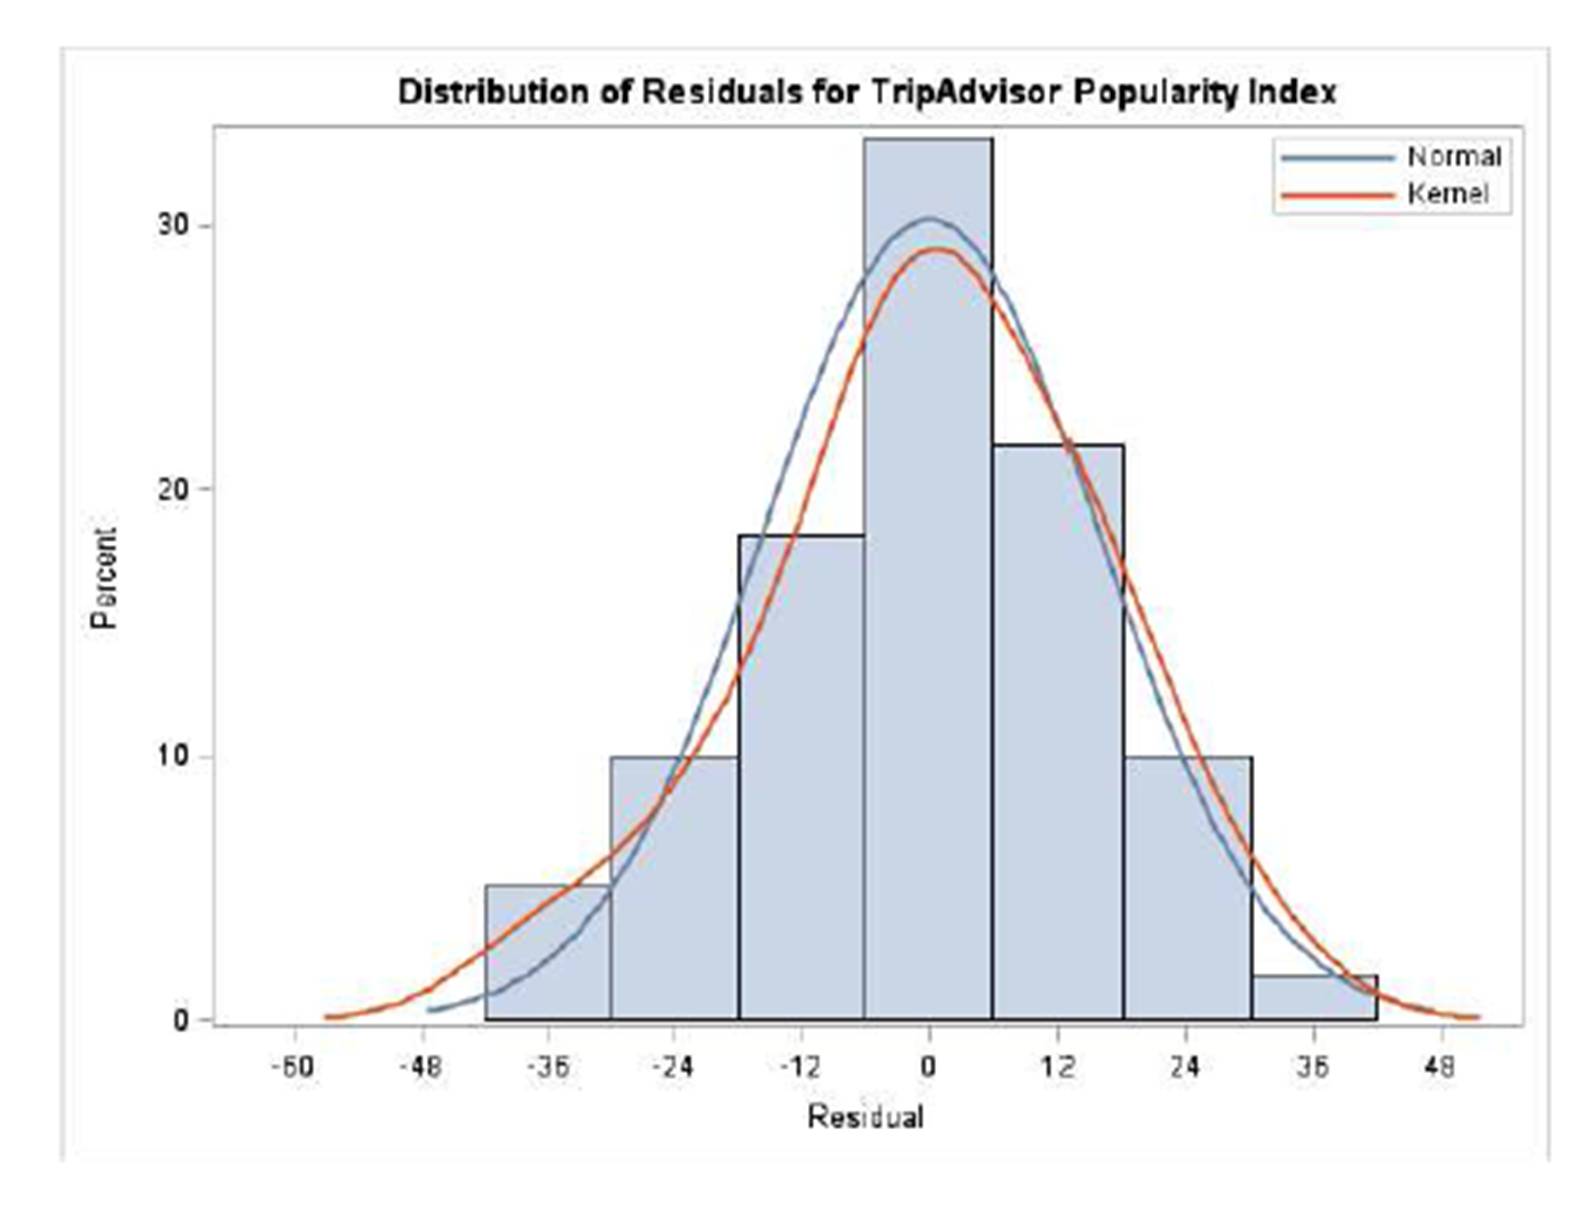
We plot a Q-Q plot for the popularity index model and a distribution of residuals for the popularity model. It shows that the model fits data points well and residuals are small, which suggests the normal assumption about the residuals is sound.
Figure 2: QQ Plot of Residues for Popularity Index Model
Figure 3: Distribution Plot of Residuals of Popularity Index Model
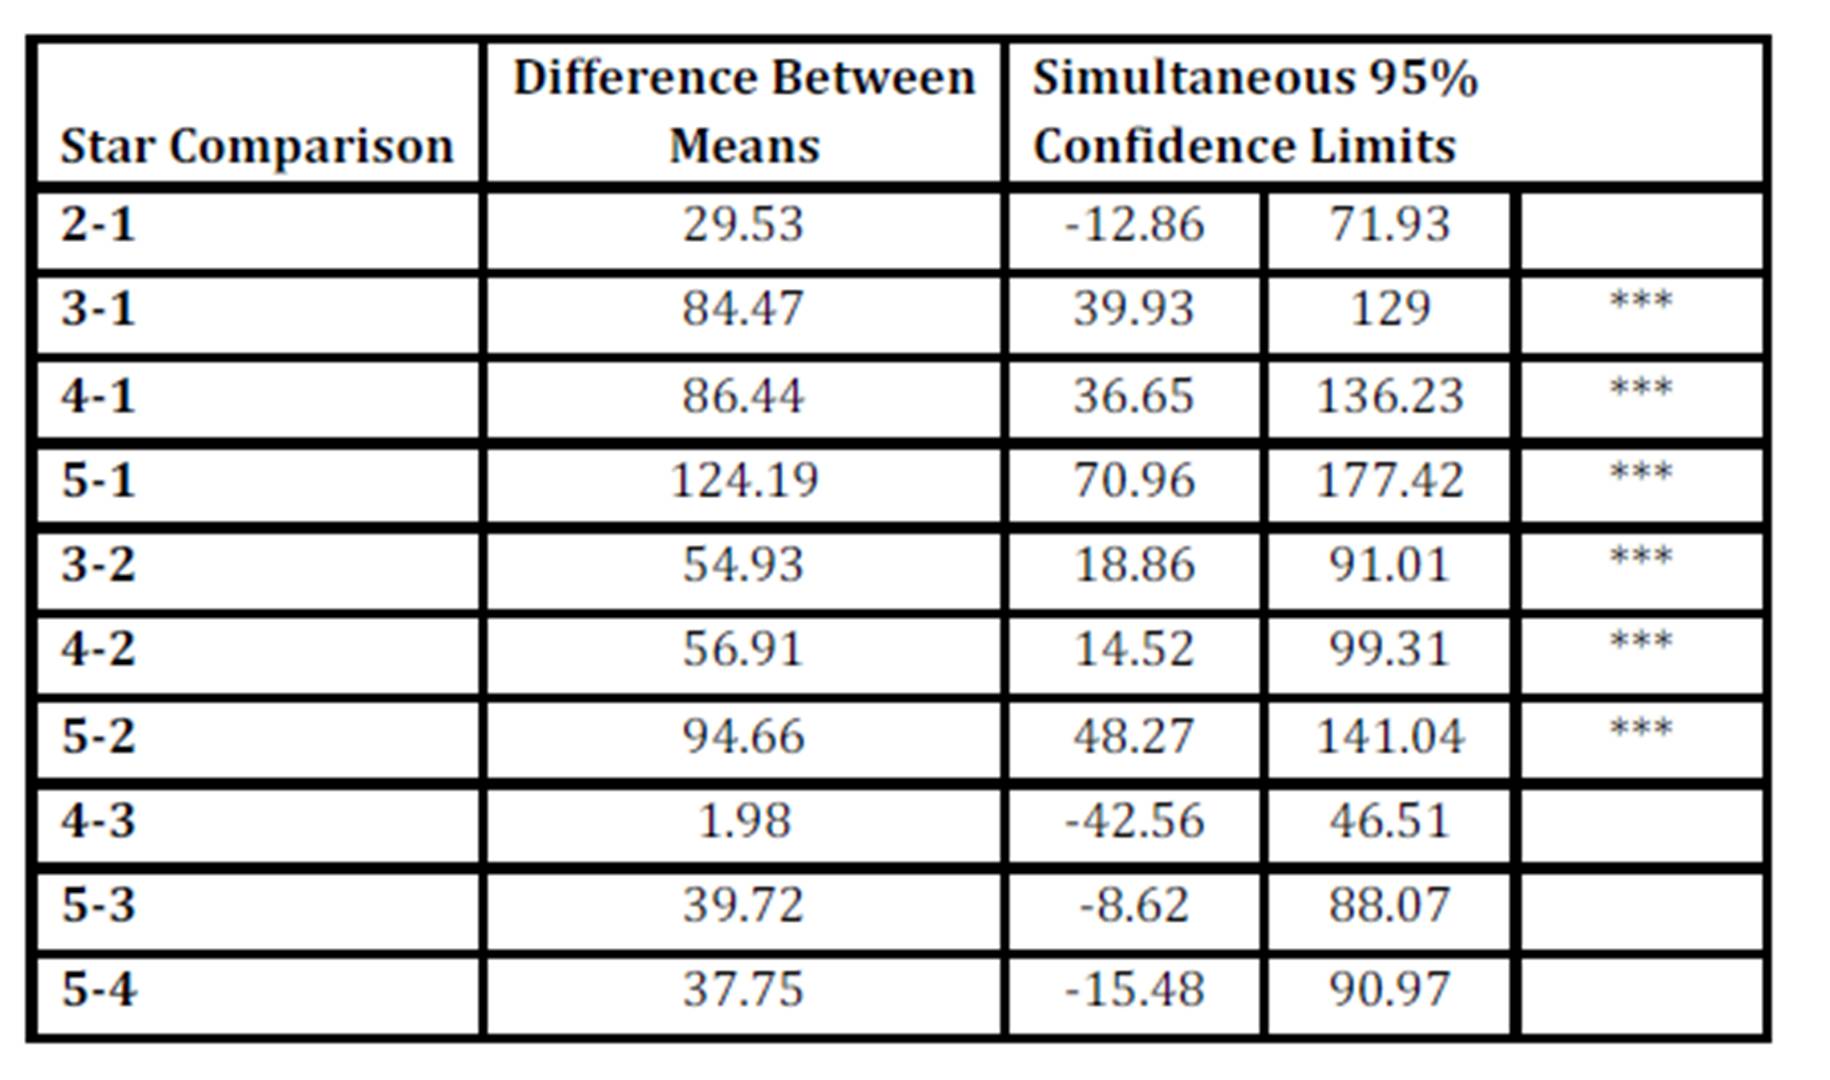
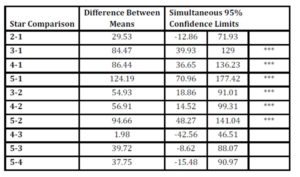
We conduct a Tukey test when comparing the popularity indices of hotels at different star levels. As shown in Table 6, hotels with one star and hotels with two star are not significantly different in terms of popularity indices. Similarly, 3 star hotels, 4 star hotels, and 5 star hotels are not significantly different in terms of popularity indices. Table 6 implies that the popularity indices are not necessarily exclusively determined by hotel stars. Hhotels with one star and hotels with 2 star hotels are confounded together, and 3, 4, and 5 star hotels are mixed together in another group.
Table 6: Multiple Comparisons of Popularity Indices for Hotel Stars
The complete data with 1642 hotels do not have popularity index. To test the determinants of popularity with the complete data, we formulate our version of popularity index based on the number of reviews and overall ratings. The popularity index is generated by the following rules: if the number of reviews of a hotel is greater than 75 percentiles (82 reviews) and the average overall rating is greater than 4 (approximately median), then the underlying hotel is considered as Popular (labeled as with “1” value), otherwise, it will be classified as Not Popular (labeled as with “0” value).
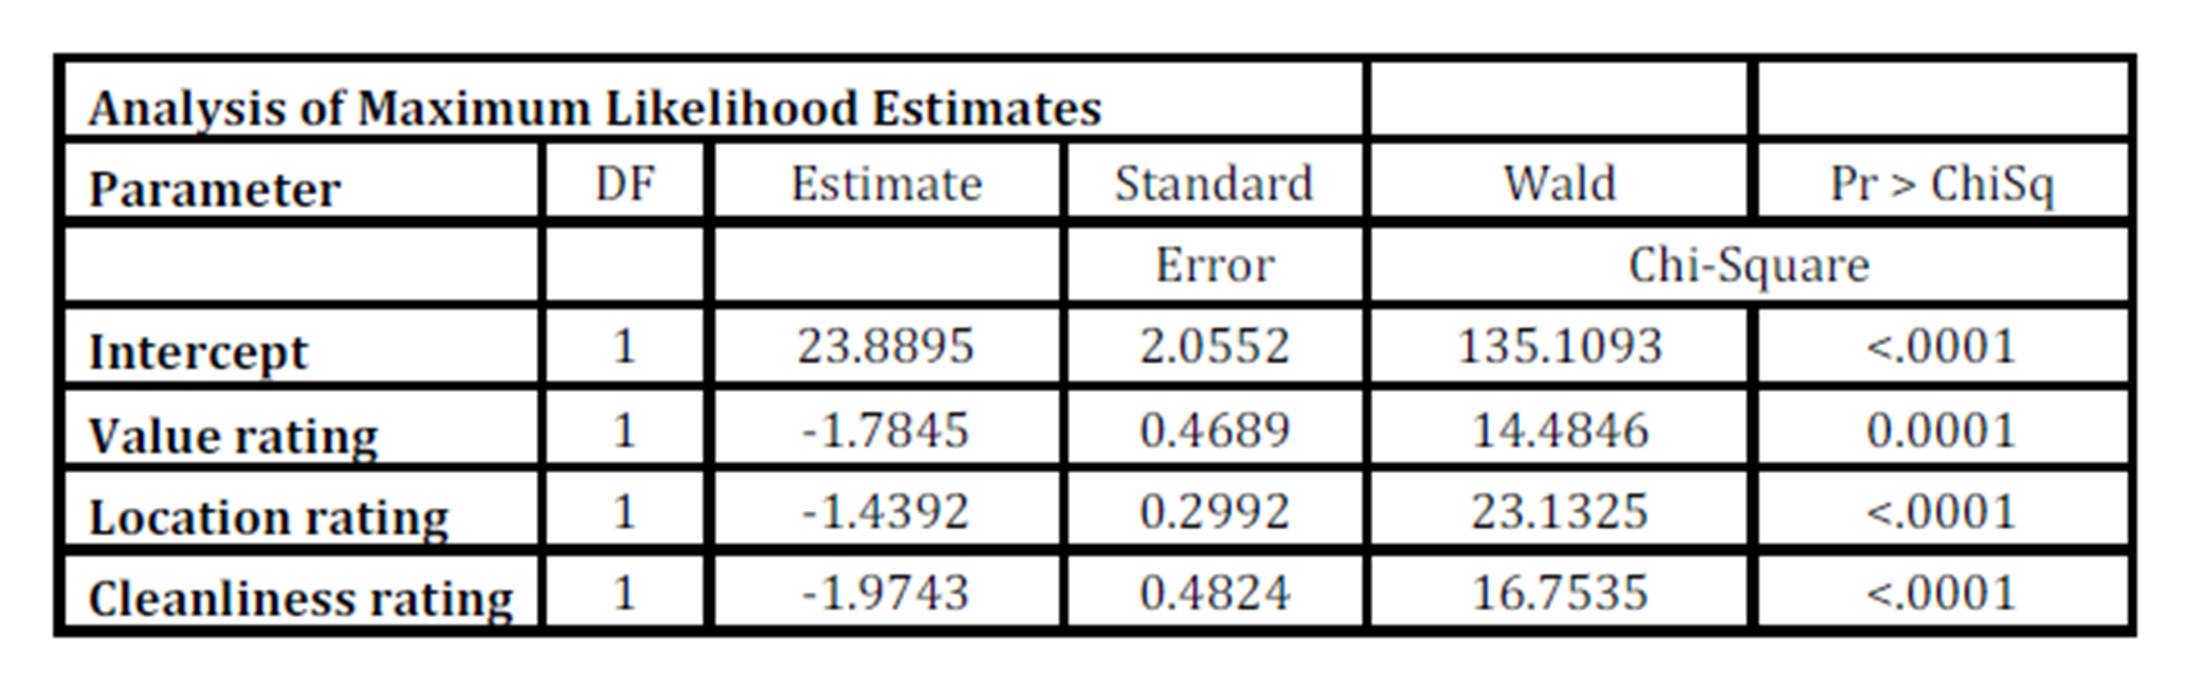
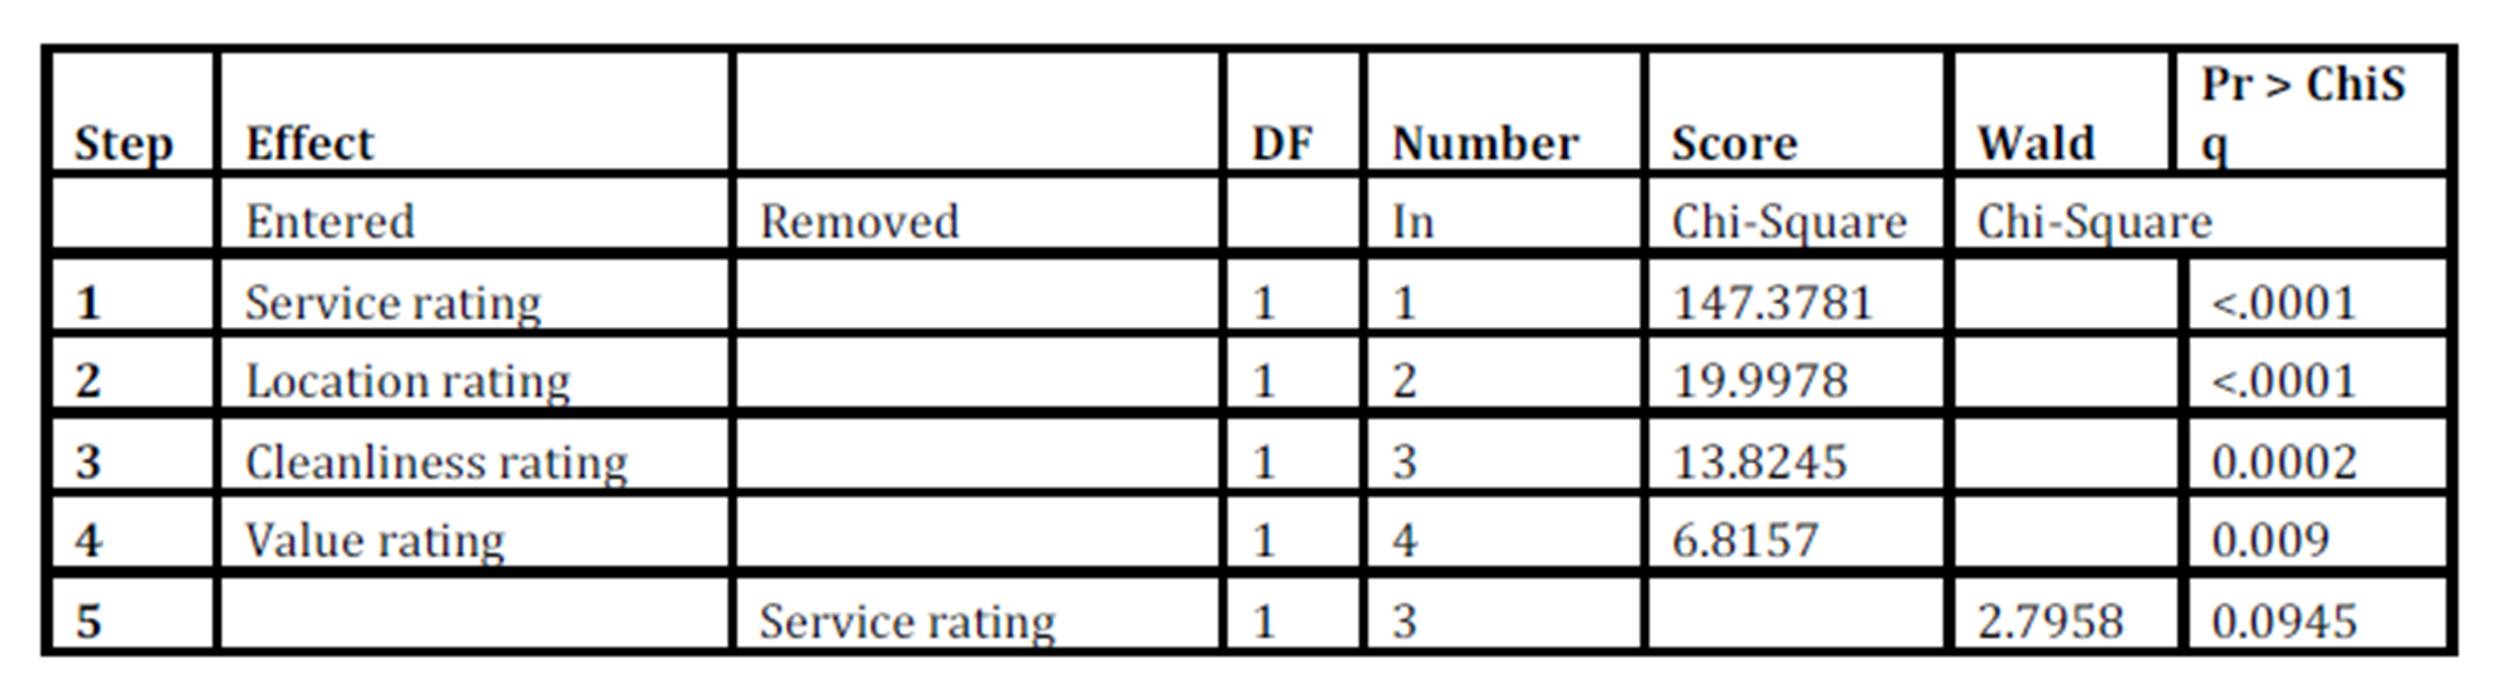
We run a Logistic Regression Model on popularity labels. We find that the defined popularity label can be explained by variables including value rating, location rating, and cleanliness rating. We use stepwise logistic regression model to determine the significant factors of popularity. The selection process of model is illustrated in Table 8.
Table 7: Logistic Regression Model of Popularity Label
Table 8: Summary of Stepwise Selection in Logistic Regression Model of Popularity Label
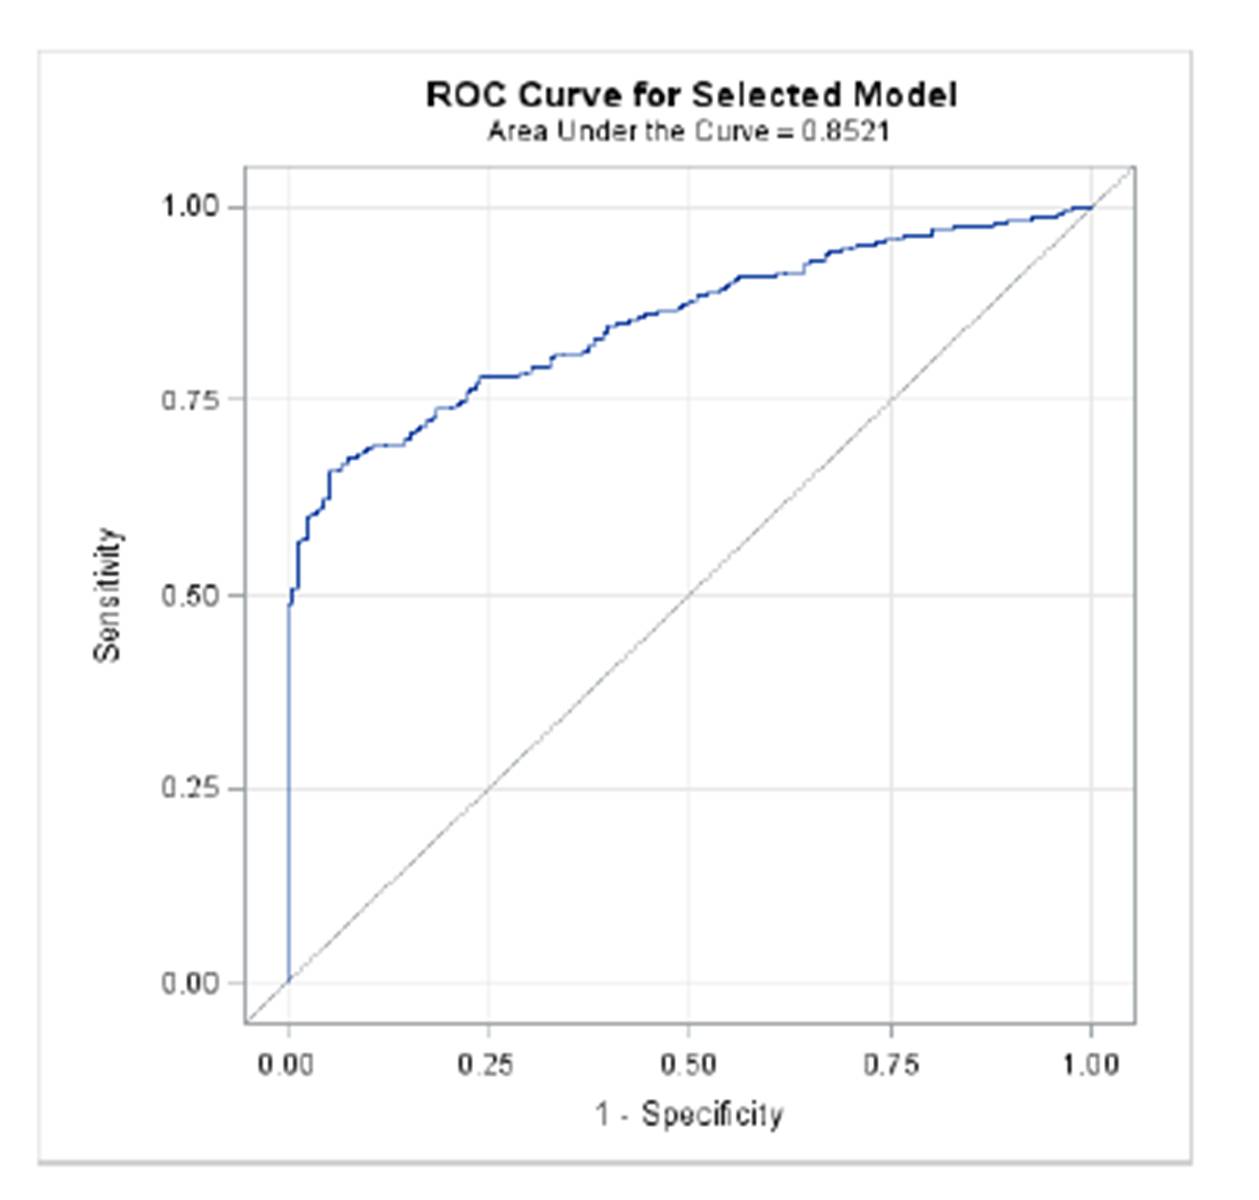
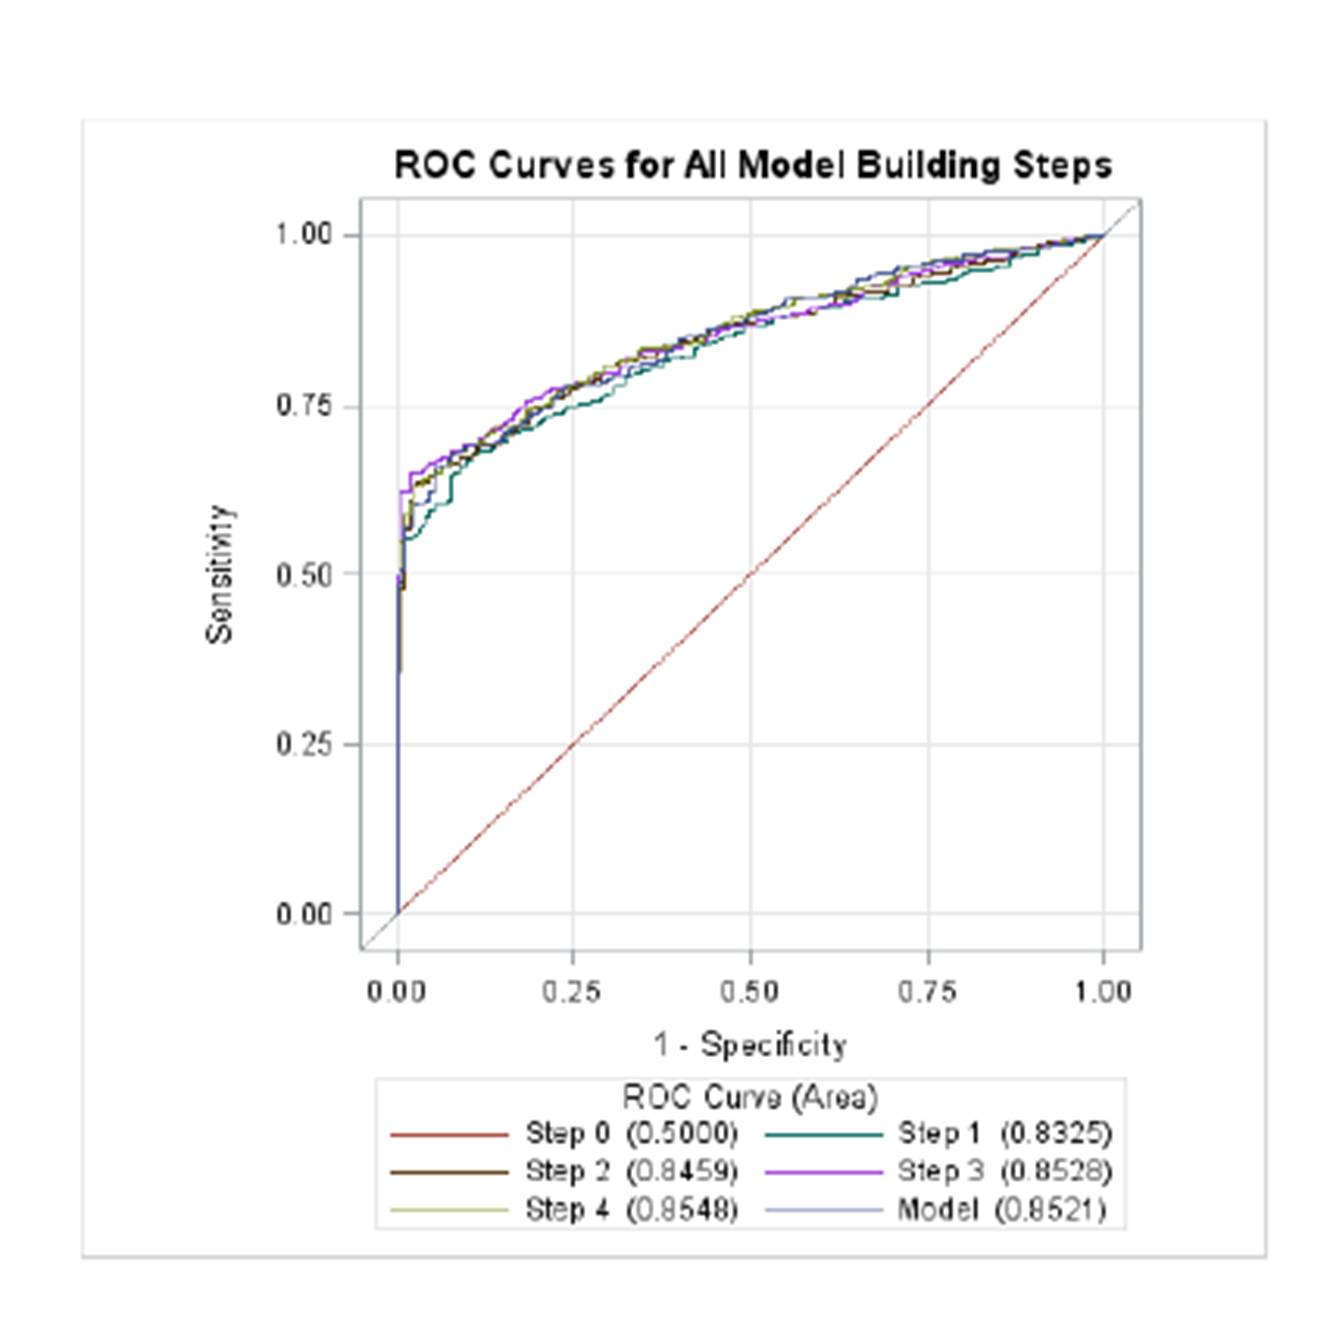
As demonstrated in Figure 4, a ROC curve for the Logistic Model shows that the area under the ROC curve (AUROC) is 85.21%, which suggests overall the model correctly classifies the popularity of a hotel 85.21% of time. The ROC curves of stepwise logistic regression are shown in Figure 5.
Figure 4: Plot of ROC Curve for Logistic Regression Model of Popularity
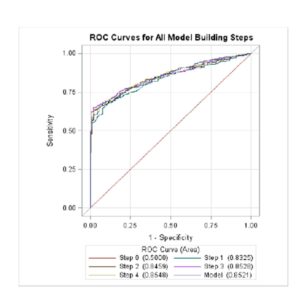
Figure 5: Plot of ROC Curve for Stepwise Logistic Regression Model of Popularity
Conclusion
We study the effect of crowd on building trust and maintaining popularity of a business. The findings show that the popularity of a hotel is positively correlated with the size of crowd following the business, and also impacted by other factors, such as price, location star levels, etc. In addition, we find that 5 star hotels are not necessarily more popular than 4 star hotels, and 4 star hotels are not more popular than 3 star hotels, 3 star hotels are not more popular than 2 star hotels, and so on so forth. In terms of popularity, 4 star hotels have problems of excelling 3 star hotels. 1 star and 2 star hotels are mixed together, and 3, 4, and 5 star hotels are mingled together in another group.
We define a popularity label and use a logistic regression to study the factors impacting business popularity. We find that the popularity of a hotel can be explained by consumers’ satisfaction on hotels’ value, location, and cleanliness. For future research, alternative popularity labels can be formulated and benchmarked. Other businesses heavily relying on the online reviews can be further studied to provide insight identifying the key factors positively impacting the sales.
In general, the findings show that the popularity of a business is positively correlated with the size of crowd following the business. The magnificent power of crowd in forming business trust and popularity has been investigated. The satisfaction of crowd towards the business is determinant of business popularity. In hotel industry, the perception of crowd on hotel cleanliness, location, and value are more important than other aspects. For hotels to stay competitive, the hotel management is advised to monitor and analyze the online reviews cautiously and address lodgers’ feedback accordingly.
References
1. Bigley, GA. and Pearce, JL. (1998) ‘Straining for Shared Meaning in Organization Science: Problems of Trust and Distrust,’ Academy of Management Review, 23 405-421.
Publisher – Google Scholar
2. Cheung, CMK. and Lee, MKO. (2001) ‘Trust in Internet Shopping: Instrument Development and Validation through Classical and Modern,’ Journal of Global Information Management, 9 (3) 23.
3. Chen, Y. (2008) ‘Herd behavior in purchasing books online’, Computers in Human Behavior 24 1977—1992.
Publisher – Google Scholar
4. Cialdini, RB., Brown, SL., Lewis, BP., Luce, C. and Neuberg, SL., (1997) ‘Reinterpreting the empathy—altruism relationship: When one into one equals oneness,’ Journal of Personality and Social Psychology, 73(3) 481-494.
Publisher – Google Scholar
5. Cialdini, RB. and Goldstein, NJ. (2003) ‘Social influence: Compliance and conformity,’ Annual Review Psychology, 55 581-621.
Google Scholar
6. Cyr, D. (2008) ‘Modeling Web Site Design Across Cultures: Relationships to Trust, Satisfaction, and E-Loyalty’, Journal of Management Information Systems, 24(4) 47-72.
Publisher – Google Scholar
7. Dellarocas, C. (2003) ‘The digitization of word-of-mouth: Promise and challenges of online reputation mechanisms,’Management Science 59 (9) 1407-1424.
Publisher – Google Scholar
8. Dellarocas, C. (2005) ‘Reputation mechanism design in online trading environments with pure moral hazard,’ Information Systems Research 16 (2), 209—230.
Google Scholar
9. Dellarocas, C. (2006), ‘Analyzing the Economic Efficiency of eBay-like Online Reputation Reporting Mechanisms,’ Proceedings of the 3rd ACM conference on Electronic Commerce, ISBN:1-58113-387-1, New York, NY, USA, 171-179.
Google Scholar
10. Everard, A. and Galletta, D.F. (2006) ‘How presentation flaws affect perceived site quality, trust, and intention to purchase from an online store,’ Journal of Management Information Systems, 22(3) 56-95.
Publisher – Google Scholar
11. Gefen D., Karahanna, E. and Straub, DW. (2003) ‘Trust and TAM in online shopping: an integrated model,’ MIS quarterly 27(1) 51-90.
Google Scholar
12. Gefen, D. (2000) ‘‘E-commerce: the role of familiarity and trust,’ Omega 28 725-737.
Google Scholar
13. Kim, DJ., Ferrin, DL. and Rao, HR. (2008), ‘A trust-based consumer decision-making model in electronic commerce: The role of trust, perceived risk, and their antecedents,’ Decision Support Systems, 44(2) 544-564.
Publisher – Google Scholar
14. Pavlou, PA. and Gefen, D. (2005) ‘Psychological Contract Violation in Online Marketplaces: Antecedents, Consequences, and Moderating Role,’ Information Systems Research, 16(4) 372-399.
Publisher – Google Scholar
15. Porter, C.E. and Donthu, N. (2008) ‘Cultivating trust and harvesting value in virtual communities,’ Management Science 54(1) 113-128.
Publisher – Google Scholar
16. Resnick, P., Zeckhauser, R., Swanson, J., and Lockwood, K. (2006) ‘The value of reputation on eBay: A controlled experiment,’ Experimental Economics, 9: 79-101.
Publisher – Google Scholar
17. Song, J. and Zahedi, FM. (2007) ‘Trust in health infomediaries,’ Decision Support Systems, 43(2) 390-407.
Publisher – Google Scholar
18. McKnight, DH., Choudhury, V. and Kacmar, C. (2000) ‘Trust in e-commerce vendors: a two-stage model,’ International Conference on Information Systems Association for Information Systems Atlanta, GA, USA, 2000, 532-536.
Google Scholar
19. McKnight, DH., Choudhury, V. and Kacmar, C. (2002) ‘Developing and Validating Trust Measures for e-Commerce: An Integrative Typology,’ Information System Research, 13(3) 334-359.
Google Scholar
20. Whitby, A., Jøsang, A. and Indulska, J. (2005) ‘Filtering out unfair ratings in bayesian reputation systems,’ The Journal of Management Research, 4, 2 48-64.
21. Zhang J. (2015) ‘Information Revelation and Social Learning,’ International Journal of Business and Social Studies, 5(2) 115-125