Introduction
Online health interactive platforms (OHIP) are software applications that provide users with all kinds of online community services including messaging, information exchange services, and connections concerning health related subjects. As a multi-billion OHIP market attracts new business endeavors, existing OHIP have adopted winning business models and provided innovative services.
On the academia side, to cut through the hype of winning and failure cases, scholars aim to examine the very nature of these platforms. In the present study, we consider the very idea of interactions among users and other parties as a distinguishing characteristic of OHIP. This characteristic opens up a new venue for both practitioners and academics. For the former, it is multi-billion dollar market for platform owners, and social capital and networking for users. For the latter, it is a multi-disciplinary research subject, which attracts academics in various sciences such as sociology, management, communication and information systems.
Online interactions enabled by platforms may be enabled by various services such as an invitation feature on online professional and social network sites, a content (text, photo, video) sharing feature on online blogs. It is these interactions that are valued as services to customers and revenue generation by subscription for platform owners. eBusiness studies focusing on online interactive platforms in general (e.g., Foster, Francescucci & West, 2010; Ridings and Wasko, 2010) confirm that growth and sustainability of these interactions are essential to achieve successful eBusiness platform. A typical lifecycle model of these platforms indicates various stages across timescale, which is often times determined as part of a business plan. But, real-time business monitoring is crucial to monitor the progress of business and, if needed, apply a number of tactics and changes to ongoing business. In this regard, the current state of affairs in practice as well as eBusiness literature appears to be mainly concerned with conventional key performance indicators that are rooted social media analytics, such as descriptive statistics about sources of traffic, active users, navigation behavior of users, conversion metrics. These measures are useful but limited in network understanding.
What are the mechanisms by which customers gain new connections and become champion and loyal customers? What does the growth rate of a customer depend on? Are there intrinsic qualities that might trigger or effect the rate at which loyal customers acquire connections? Are there some habitual tendencies common to loyal customers? Which abilities, attributes, and differences between nodes play a role in the increase in customer connection? How do the differences affect a customer’s ability to acquire links? Do the loyal customers form isolated communities, or do they merge into the largest component, or commonly known as the giant component (GC), of the network? These are all questions relevant to our research. As shall be elaborated further, we seek answers to the questions by referring to network science (Barabási, 2016) as an underlying theoretical account.
Research Background
Increasingly, relations between friends and other agencies take place via online systems even though urbanization develops rapidly and human communities are concentrated in cities with close proximity. Many of us live in populous locations, called megalopolis, and environments that we occupy for work, school and hospitals are getting more and more crowded. Big city life may lead to an increase in social relations among people. Ever since we started using the Internet, it has transformed our social life. We used to talk, now we chat, we used to node our heads, now we click on the like button of social networking applications. Consequently, researchers turn their attention to social interaction platforms.
Over the last decade, the increase in the number of online health platforms attracts both academicians and practitioners. Some examples of these platforms include healthtap.com, doktorsitesi.com, DoctorOnDemand, webMD. Although information sharing on these platforms is provided as a simple service, the service triggers complex interactions as there are thousands of registered users, visitors or physicians, with a multitude of interactions between them: visitor-to-visitor, physician-to-physician, or visitor-to-physician. Examination of these intricate interactions has attracted many scholars in different fields such as computer science, physics, mathematics, and management with a common theme called complex systems, which underpins the emergence of a growing body of academic effort, called network science. However, it is quite troublesome to reach convenient real-world data for scientific studies.
Modelling real-world complex systems through graphs has shown us that these systems have common characteristic features making them different from randomly generated complex systems (Strogatz, 2001). Testing almost universally accepted scientific findings recognised as real-world network laws, principles and phenomena by the examination of these platforms in itself should be considered as a significant contribution to network science. The main objective of this study is to contribute to the scientific community in this regard.
The purpose of doktorsitesi.com is to provide its members with health-related information. The site brings together health professionals which we call physicians and people who possibly have health-related concerns/questions which we call visitors. For instance, “My Questions” is a service that enables members to ask questions publicly while “Connections” is another service that enables members to interchange private messages.
This paper presents a network study using digital trace data (Howison et al. 2011). The transactions of online groups who use a multitude of services leave a digital trace, which creates many valuable opportunities for research. After a careful examination of all the services and having several meetings with the CEO of Doktorsitesi.com, we decided to focus on the Connections service. It is not plausible to model each and every digital trace of even a single service as a single graph. For example, the Connections service has a set of features that enables a member to accept/reject a connection request or put into a blacklist the person who attempts to make a connection. One would focus on any of the digital trace left by the user actions, all of which requires its own network representation. Thus the dataset that we requested from the company constitutes a select part of the event-based digital trace data. In the data set, the recorded event is the trace left by the act of approving a connection request by a party. By its very nature, the trace data are longitudinal data, as the recorded events occur in time. So the network structure that we produce is an aggregation of the events on a period of time, namely a year. It is an unfortunate fact that the digital trace of the timestamp of a connection request is lost, because the timestamp of its corresponding approval event (if it occurs) by the opposite party replaces it by the timestamp of the last action on the software level. Therefore, the network we are able to produce belongs to the aggregation of approval events only, providing evidence about a particular online relationship that we assume to be primarily established to exchange health-related valuable information. Fortunately, the information system does store the information regarding who makes a request to establish a connection as well as their role (physician/ordinary member) and gender, allowing us to extend our network study to peoples’ habitual tendencies to make a connection. The Connections feature provides an interface between presumably health-related information seekers and likely information sources. To emphasize this, from now on, we will refer to the network produced as the interaction network.
The interaction network examined exhibits a hub-and-spoke character. Many people with few connections are tied to few people with many connections, viz.: hub and spoke. The network is so hub driven that the total number of connections of top 1% of hubs account for almost half of all the established connections of the whole Interaction network.
While the existence of hub-and-spoke character in real-world complex network has been recognized in network science literature, the mechanisms behind it, and the way events make a network up over time, have remained largely elusive. This is mostly due to the lack of appropriate digital trace data from the real world. There are a number of reasons for this: platform managers might change the rules of service for some reasons before an information system stores enough digital trace for a sound network study, they might also abandon the service altogether. The Connections service serves us well in this respect. The service has been constantly provided since 2010, the meaning of interactions is still intact, even the user interface has been largely the same since the feature’s debut. The validity issues of digital trace data are another barrier that one must pass through for scientific publication. The system and practice issues is one of these hurdles. To leap over it, we gained intimate knowledge of the Connections service, through interviews with the CEO and software engineers, and actively participated in the service by signing up and experiencing all the details by ourselves. We have even checked the digital trace data against the software flags the engineers defined, at which point we have realized that a special database query is needed to differentiate between the person who drops a connection request and the person who receives it. Thus, we can safely say that both our network model faithfully represents the way members use the Connection service and that use has not changed over time.
The study of the evolution of structure within large scale online networks is one of the few empirical contributions to understanding real-world hubs where detailed evaluation of the growth processes that control online social networks in large is studied (Kumar et al., 2010). Kumar et al. (2010) coin the word “star” to refer to “a single charismatic individual linked to a varying number of users who have very few other connections”, or mathematically, to refer to a “connected component with one or two nodes (centers) that have an edge to most of the other nodes (twinkles) in the component”. They focus attention on the formation of stars and observe that after an initial rapid growth they either merge into the giant component or lose focus, stop growing, and form an isolated community. Although quite simple, their empirical mathematical model of network growth captures the center-twinkle structure of the online social networks well.
On the theoretical side, the pioneers in the evolution of random graphs research (Erdös and Rényi, 1961) were already aware of the fact that one needs to replace their random graph model by “a more complicated but more realistic model” to describe a real-world network. The Barabási-Albert scale-free model of evolving networks (Barabási and Albert, 1999) is a great step forward in explaining real-world networks. Yet, it fails to capture the Web’s degree distribution. Barabási-Bianconi or the fitness model (Bianconi and Barabási, 2001) incorporates an intrinsic property of nodes into the scale-free model to successfully describe the evolution of hubs of the WWW. To put it briefly, Erdös-Rényi model forbids hubs, Barabási-Albert model predicts the existence of hubs with the limitation that the oldest node will always have the most links and Barabási-Bianconi model overcomes this unrealistic limitation by introducing individual node fitness into the growth process.
Describing the evolution of node degrees provides valuable but partial insight into the habitual tendencies of hubs. To gain complementary insight into the observed hub-and-spoke pattern, we delve into degree correlations (Pastor-Satorraset al., 2001, Newman, 2002, Vázquez, A. 2003). Assortativity is a scalar measure of a network representing the extent to which nodes in a network associate with other nodes in a network. A network is said to be assortative when topology-related node characteristics of nodes correlate with each other. Otherwise it is said to be disassortative. In addition to the numerical characteristics of nodes (degree, betweenness, etc.), assortativity may also be applied to non-numeric node attributes (race, language, etc.) (Chang et al., 2007, Noldus & Van Mieghem, 2015). Since our primary aim is to investigate local interactions of hubs, it is more appropriate to focus on the local assortativity of the hub nodes (Piraveenan et al., 2008).
Since the degree distribution of the network we have displays a scale free character, we look for the answers by considering the common features of these networks (Hein et al., 2006): They are self-organized, dynamic and evolving to larger number of size in time. The growth principle of the preferential attachment or linking: While the network grows, its new node becomes preferentially attached to the existing nodes with a high number of connections. Hubs are formed as a result of this process.
It is worth noticing that there is not an exact definition of hub in scientific literature, rather hubs are connected nodes of large size which play a key role in the network properties (Barabási, 2016). Networks, and especially social networks can also be characterized in terms of their homophily or assortative mixing and dissassortative mixing features. In many real-world networks, people prefer to have interaction with other people who have similar attributes, such as language, age, educational level, political beliefs, socioeconomic status, language and many others (Barabási, 2016). Aydin and Perdahci (2016) mechanisms of homophily network growth and preferential attachment may not always be explicit. For example, communities are formed with this tendency among individuals. Therefore, society is a continuous system having assortative nature (Chang et al., 2007). Homophily is a social phenomenon capturing the fact that individuals have a tendency to associate with other individuals of similar background and characteristics (Quayle et al., 2006). In network view, assortative networks display common forms. General tendency of the hubs in assortative networks is to link to each other rather than small-degree nodes whereas the small-degree nodes tend to connect to other small-degree nodes. In contrast to assortative networks, hubs tend mainly to tie to small-degree nodes in dissassortative networks.
Yet another complimentary insight into the habitual tendencies of hubs should come from the community structure of the Interaction network. It has been known for decades that one of the common properties of real-world complex networks is the community structure, nodes forming groups within which there are dense interconnections, but between which there are relatively less interactions (Newman and Girwan, 2004). The interaction network should presumably have communities and hubs that should play a major role in the formation and evolution of communities.
This work involves three main parts. The first part of our network study involves a lengthy procedure. For each hub-node, we plot the node’s growth chart, that is the total number of interactions as a function of time over the whole year of 2012. Each point on a growth chart corresponds to the digital trace pertaining to a Connection interaction involving two asynchronous actions (sending a request and approving it) as a result of which a hub node gains a new connection. Qualitative classification of hubs according to their intrinsic qualities and habitual tendencies comprises the second part. It is in this part where we reveal degree correlations, assortative mixing patterns, and temporal interaction patterns of each hub. In the last part we discuss the outcomes of the study in regard to network science and platform management in terms of customer loyalty.
Methods
We examine the Connection service of Doktorsitesi.com (www.doktorsitesi.com). It is a special service on the platform that allows its members to exchange private messages if they agree to make a tie. We have acquired the knowledge of what gets logged into the database as the members interact with each other through the service. We have learnt that although requests of members to establish a new tie get logged, the particular members who initiate a tie request and who receive the request are logged into the related database fields at random. This piece of information is so essential to model interactions as a directed graph that we asked Doktorsitesi.com to make a special query that extracts tie initiators thus we obtained a raw data set describing the ties feature of Doktorsitesi.com amenable to directed network analysis. The set is composed of activities of members who made use of the service; either to make a request for a tie or to approve of a tie, collectively called establishing new ties, over the 12-month period from January 2012 to December 2012. For each of the members, we have a log of their interactions where user identifiers of both parties and the timestamp of a record constitute a transaction. The timestamp of a record indicates when a tie request event or the approval of a tie request event occurred. We do not have any knowledge about the true identities of the members except that they are either medical practitioners that we prefer to call physicians or visitors (presumably patients). We believe that the methods that we employ in collecting our data set free it from potential subjective biases on the part of the platform members, and this is an effective method for probing an online platform

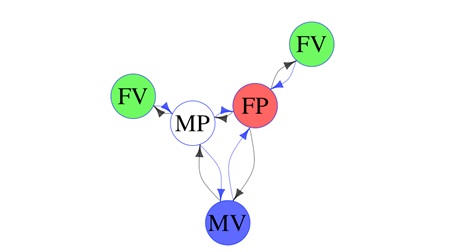
Fig. 1: Graph model of the Interactions
Description of the network data and visual analysis of network diagrams are produced with Gephi, igraph of R, and MySQL. Gephi is a visualization and exploration platform for SNA. All packages are open-source and free software.
We model the interactions of the members with the service as a directed network. Figure 1. is the network model description of establishing new ties: Red and white nodes represent female physicians (FP) and male physicians (MP), respectively, and green and blue nodes represent female visitors (FV) and men visitors (MV), respectively. A directed black edge between two nodes represents a request of a platform member to establish a new tie to another member. A directed blue edge between two nodes represents an approval to establish a tie. Thus, a pair of black-blue directed edges between two members indicates that they have established a tie.
What we mean by the dynamics of the interaction network is that both the edges among a set of nodes and the set of nodes itself are changing as a function of time. We think of the dynamic network as a graph which is a function of discrete time namely in weeks. We observe the appearance of select nodes and their edges weekly, with the hindsight that they are going to qualify as hubs after a year of interactions. In essence, we observe a set of weekly snapshots of the interaction network, recording the hub activity both as a time graph of the number of edges they form in time and as a table of their habitual use of the service. Also, we observe the communities that the hubs belong to. Considering that the formation of a community should take quite some time, we observe a set of monthly snapshots of the interaction network, watching the evolution of the communities in terms of the hubs and the total number of nodes they possess.

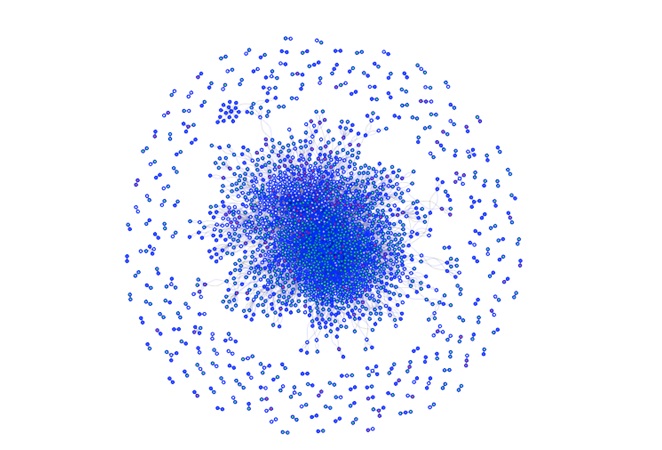
Fig. 2: Map of the Interaction Network for the Year of 2012
Results
We present basic characteristics of the interaction network on Table 1. Figure 1. presents the corresponding network map
using a force-directed layout. There appears a giant component in the middle (the largest component), surrounded by many components of much smaller size.
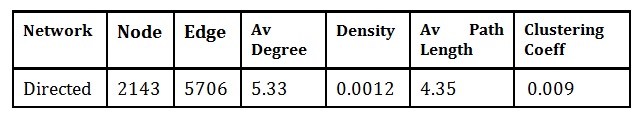
Table 1: Summary of Social Network Analysis Measures for the Interaction Network
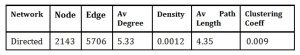
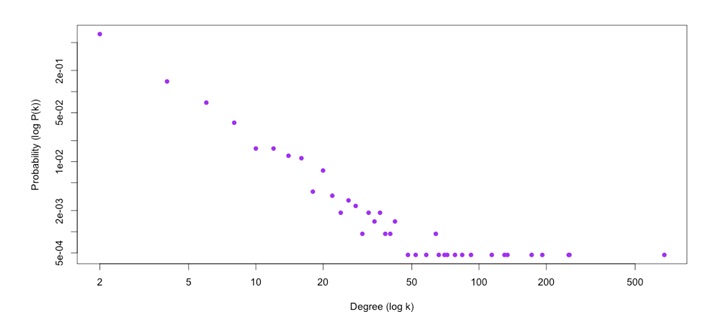
The directed network of interactions has 2143 nodes and 5706 edges, hence the average degree is 5.33, suggesting that a typical member makes roughly five request/approval interactions. Yet, the scale-free degree distribution of Figure 3.
tells us that the mean degree value of 5.33 (see Table 1) is a misleading statistic, as the majority of the members interact seldom (having only two interactions) who coexist with highly interacting members (having tens of interactions) that we collectively label as hubs.
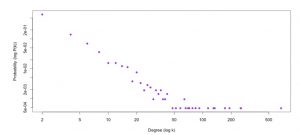
Fig. 3: Degree distribution of the Interaction Network
We will describe the characteristics of 22 hubs constituting the top one percent of the nodes having the maximal degree (we refer the reader to the article, “The Top One Percent” in (van Mierlo, 2014)).
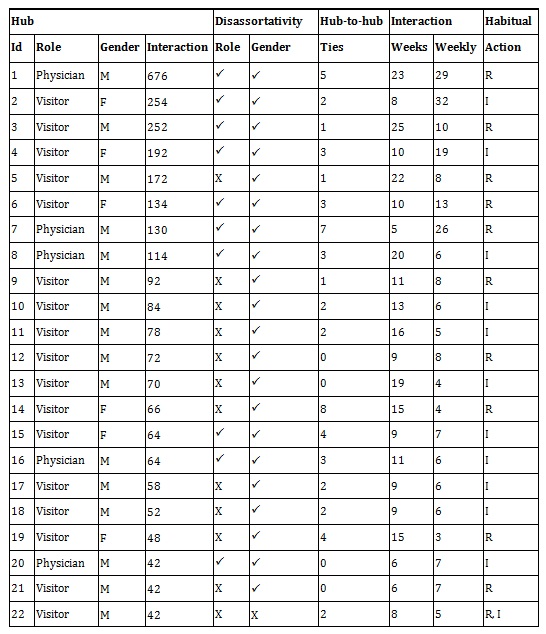
For the select hubs, we present weekly request/approval interactions, describing the development of the edges formed in each week. The total number of interactions of the 22 hubs is 2798. This accounts for almost half the interactions. Table 2 lists the total number of interactions (as the sum of in-degree and out-degree), role, gender, the timestamp of their first interaction, and the month that the hub merges into the GC for the 22 hubs.
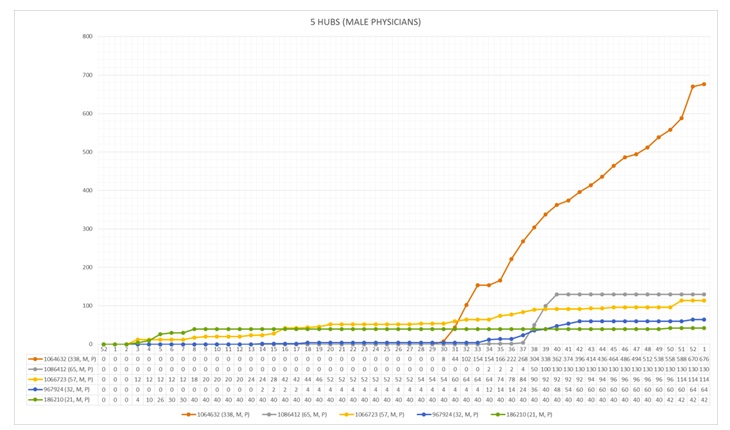
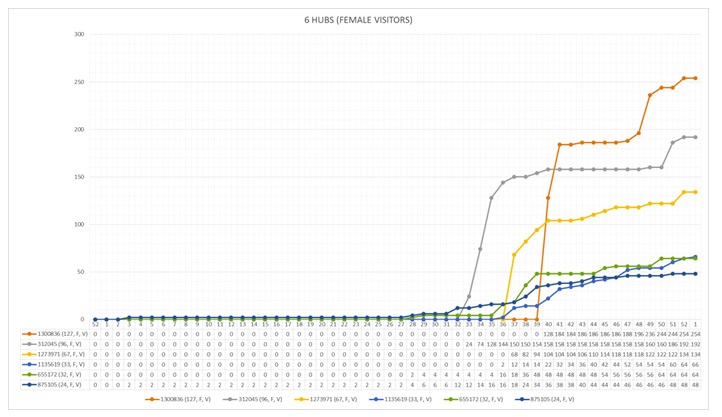
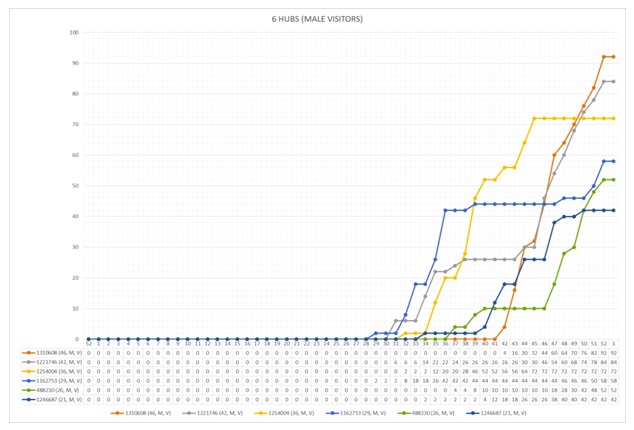
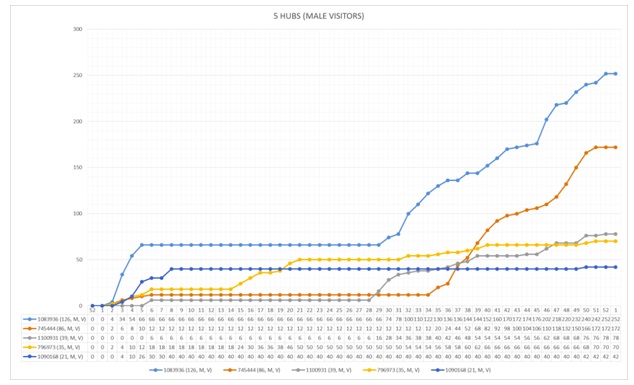
Figures 4, 5, 6, and 7 illustrate how the hubs grow during the year. On each of the figures, cumulative line charts illustrate the growth rates of hubs. For example, the hub with the most number of interactions starts making connections on the 30th week of the year (see Table 2, for the exact date), makes 29 interactions per week (see Table 3, the first row, and ends up with 676 interactions at the end of the year, gaining the hub 338 ties. We have tried to distribute the hubs on these charts in such a way that hubs who start using the Connections service are displayed on the same charts.
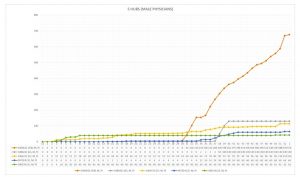
Fig. 4: Interactions of Five Male Physician Hubs
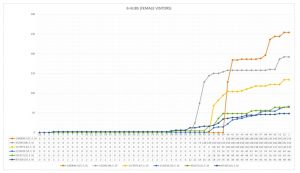
Fig. 5: Interactions of Six Male Physician Hubs
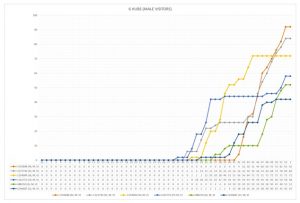
Fig. 6: Interactions of Six Male Visitor Hubs
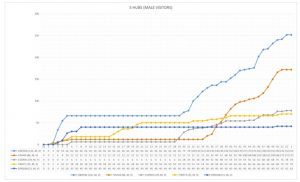
Fig. 7: Interactions of Five Male Visitor Hubs
Interestingly, three of the physicians (see Fig. 4) as well as five male visitors (see Fig. 7) start gaining new ties near the beginning of the year, whereas all of the female visitors, the other half of the male visitors (see Fig. 6 and Fig. 7), and two of the physicians start gaining new ties at around the 30th week of the year. Moreover, all hubs are more or less active beyond the 30th week. There is no female physician hub.
Table 2: Comparison of the Habitual Interactions

Disassortativity and Hub-to-hub Ties columns of Table 2 along with Table 3 lists degree correlations and local assortative behavior of each hub. Space limitations do not afford us to give a complete list of how all hubs mix in their interactions. Below, we provide the reader with a guide to reading Table 2:
X: Hub node tends to behave assortatively by role or gender
ü: Hub node tends to behave disassortatively by role or gender
Hub Interaction: Total number of other hubs a hub has interacted with
Interaction weeks (NoW): Number of weeks a hub is active (making new ties)
Interactions weekly (NoI): Mean number of interactions per week
R (Regular): Hub node interacts continually (NoW and NoI are both taken into account)
I (Intermittent): Hub node does not interact more than three consecutive weeks
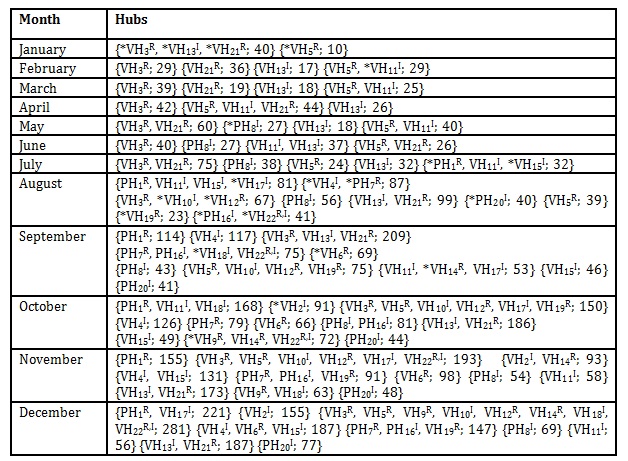
Table 3: Hub Contributions to Evolution of Communities
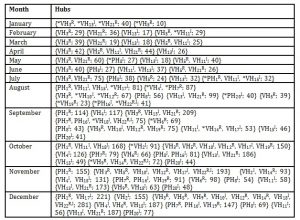
Below, we provide the reader with the definitions of symbols and other notations used in Table 3:
VH: A visitor hub
PH: A physician hub
An asterisk indicates the first time a hub joins the network
Superscript R (Regular): Hub node interacts continually (NoW and NoI are both taken into account)
Superscript I (Intermittent): Hub node does not interact more than three consecutive weeks
Subscript indicates the size of the hub in descending order (PH1 is the biggest hub of the network)
A number after semicolon represents the size (number of nodes) of hub(s) community
Table 3 provides the reader with a summary of an extent to which hub contributes to community formation. For example, in February, we can see that there are six hubs in the network. All of them are visitors. Three hubs have created their own communities of sizes 29, 36 and 17 nodes. Two hubs: VH5R and *VH11I are in the same community of size 29. *VH11I joins network for the first time. Three hubs (VH3R, VH21R, VH5R) are regular and two hubs (VH13I, *VH11I) are intermittent. We shall now discuss the findings with respect to the structural and dynamic aspects of hub interactions and community formation.
Discussion
Structural Aspect of Hub Interactions
One of the most prominent phenomena we observe in terms of the interactions of hubs is dissassortativity; hubs tend to form ties to members of different roles or genders. In other words, almost all hubs form ties to the opposite gender. Also, they prefer to interact with nodes of different roles. For instance, all male physicians (see Table 2) tend to mix disassortatively with respect to both role and gender, that is male physicians generally prefer to engage with female visitors.
In regards to the structural aspects of the communities of the GC, it is important to notice that, hubs contribute to nine communities in the end of twelve months. The total number of nodes that these communities have account for nearly 84% of the GC. Four of the communities involve only a single hub, two of them involve two hubs, another two involve three hubs, and finally one relatively large community involves eight hubs. The “hub-to-hub network” composed of only interactions between the hubs has an average degree of only 2.72 interactions (see Table 2 “Hub-to-hub Ties” column), suggesting that there are two to three ties between the hubs. In other words, hubs mostly avoid each other. The phenomenon of observing a large community composed of seven male visitors and one female visitor hub is due to the disassortative behavior of the female visitor who opts for forming ties to four male visitor hubs. These findings suggest that while role disassortativity leads to communities of few hubs, gender disassortativity leads to communities of many hubs.
Dynamic Aspect of Hub Interactions and Community Formation
There is an interval of two to eight weeks’ duration for the hubs without making any interactions. In general, we can divide the tendency of a hub being inactive into two broad categories (see the last column on Table 2): The ones that interact regularly (denoted by R on Table 2) who are never inactive for more than three consecutive weeks and the ones that interact intermittently (denoted by I on Table 2) who are inactive for more than three consecutive weeks. Note that the timestamps belong to the digital trace of the time a tie is secured, and we have no way of knowing the time interval between a tie request is dropped and it is approved. Nor we can say anything further for such a seemingly magic duration of three weeks. Nevertheless, it seems to be a fact so long as the habitual actions of the hubs are concerned. Further investigation of the effects of the rate of hub growth on the growth potential of a network can be the subject of a detailed network analysis.
The two different habitual actions of the hubs, i.e., regular (R) and intermittent (I) use of the Connections service do not correlate with either their role, gender or hub-to-hub ties. Half of the hubs use the service regularly while the other half use it intermittently. The minimal hub does both. Thus, we contend that the habitual actions of hubs deserve a deeper study. Yet, one can argue that hub interactions have to correlate highly with presumably health issues, because irrespective of their habitual actions, hubs start interacting at around the same time of the year, namely either around the beginning of the year or around the 30th week. Lack of contextual information prevents us from commenting further in this respect.
Regarding the initial effects of gender attribute on community formation, four of the six female hubs merge into the GC as they create their own communities. That is, no other hub exists in the community. On the other hand, the other two hubs start forming a community with a physician male hub or with two visitor male hubs. At the end of the year, we found that out of six female hubs, five of them are not alone in their own communities. Thus, the findings suggest that platform managers may consider female visitor hub behavior as “collective key contributors” to community formation rather than being “mono-hub contributor” to community formation. All visitor male hubs happen to be collective key contributors as they almost never start alone and also were almost never found to be alone in a community through their lifetime.
Regarding the initial effects of role attribute on community formation, two of the five physician hubs merge into the GC creating their own communities. The other three start their lifetime with other visitor hubs. In the end, those who started alone initially are still the sole hub of a community, which suggests “mono-hub contributor” behavior, while the other three hubs keep being “collective key contributors” to community formation. Overall, this network is almost perfectly disassortative by role as far as hubs are concerned; all physician hubs and all female visitor hubs have avoided each other, opting for making solely disassortative ties. Female visitor hubs interact almost exclusively with physicians, while male visitor hubs have ties mostly to physicians and female visitor hubs.
The habitual tendencies of the maximal hub, with a total of 676 interactions, are so atypical that we think they deserve a special attention. We contend that the maximal hub turns the Connection service into the opportunity of establishing ties with as many visitors as possible by intensely using the service. There is one other physician male hub, with a total of 130 interactions, with a similar behavior on a much shorter time interval.
Aydin and Perdahci (2017) have articulated implications of the present findings from a network science perspective. In particular, one can further elaborate the case of assortative mixing by degree and node attributes at the macroscopic and microscopic levels.
We are intrigued by the absence of any physician female hubs in the online health platform. According to the Turkish Ministry of Health, 40% of the physicians are women, so we could expect a similar ratio of female physicians among the hubs. There could be a number of reasons for this. There are many different health issues, and the 40% ratio does not reflect the ratios of health specialists for every issue. It could be the case that during the year of 2012 most of the health-related issues were related to the chosen profession of male physicians, or equivalently it could be the case that female physicians prefer to discuss health issues in public rather than using a private channel.
The emergence of a GC signifies that the Platform owners have achieved their goal of creating a sustainable online service (Aydin and Perdahci, 2017). Central to this achievement is the undeniable role of hubs as they are the platform users who initiate interactions that lead to the formation of the GC. We contend that hubs should be considered as the customers most loyal to the eBusiness. Platform managers should keep an eye on the hubs, with respect to how their interactions correlate with the profile data available. Managers should take into consideration the habitual actions of hubs both at individual and community levels. That is the former provides the managers with an extent to which key customers are loyal to the service provided while the latter indicates the community in which they contribute to. Furthermore, the community understanding will help the managers to better understand the remaining customers in terms of their collective-loyalty to the hubs and in turn to the service provided.
Conclusion
Online health information platforms (e.g., WebMD, healthtap) have become popular as they make health information to be accessible to large crowds. These platforms provide users with a set of communication services that trigger the formation of ties as there are thousands of registered users, visitors or physicians, with a multitude of inherently complex interactions between them, which we model as an Interaction Network. Managers may utilize network understanding to reveal the true potential of their platforms as this understanding provides many valuable insights including identification of customer loyalty and their importance to network and community formation on the platform. These insights can be used to answer some of the key questions as: what is typical loyal customer behavior on the platform? That is, is there any habitual tendency of loyal customers with respect to their interactions with other users? If yes, is there any correlation between their attributes and loyal customers’ interactions and their typical habitual actions? Which communities host and/or are enabled by which loyal customers? That is, do they contribute to communities alone or do they act collectively? Is there any effect of attributes of loyal customers on acting alone or collectively?
We adopted a network science perspective to identify and examine twenty-two loyal customers as hubs in the interaction network with respect to the structural and dynamic aspects of hub interactions. It is found that loyal customers mostly avoid interacting with each other and tend to form ties to members of different roles or genders. Network analysis of the dynamic aspect of hub interactions and community formation leads to two distinguishing habitual actions of the loyal customers: regular and intermittent use of the Connections service, which does not correlate with either their role, gender or loyal customer interactions. These findings also suggest that while role disassortativity leads to communities of few loyal customers, gender disassortativity leads to communities of many loyal customers.
This research should be considered as a guide to the evaluation of product attractiveness or customer loyalty opportunities the managers will need. In particular, dynamic community understanding can help managers in examining and treating loyal customers with a valuable and different perspective.
(adsbygoogle = window.adsbygoogle || []).push({});
References
- Aydin, M. N. and Perdahci, N. Z. (2017), ‘Dynamic network analysis of online interactive platform,’ Information Systems Frontiers, DOI: 10.1007/s10796-017-9740-8.
Google Scholar
- Aydin, M. N. and Perdahci, N. Z. (2016), ‘Network Analysis of an Interactive Health Network,’ Journal of Internet Social Networking & Virtual Communities, Vol. 2016 (2016), Article ID 810876, DOI: 10.5171/2016.810876.
Google Scholar
- Barabási, A. L. and Albert, R. (1999), ‘Emergence of scaling in random networks,’ science, 286(5439), 509-512.
Google Scholar
- Barabási, A. L. (2016) Network science, Cambridge University Press.
- Bianconi, G. and Barabási, A. L. (2001), ‘Competition and multiscaling in evolving networks,’ EPL (Europhysics Letters), 54(4), 436.
Google Scholar
- Chang, H., Su, B. B., Zhou, Y. P. and He, D. R. (2007), ‘Assortativity and act degree distribution of some collaboration networks,’ Physica A: Statistical Mechanics and its Applications, 383(2), 687-702.
Google Scholar
- Erdös, P. and Rényi, A. (1961), ‘On the evolution of random graphs,’ Inst. Internat. Statist, 38(4), 343-347.
- Foster, M. K., Francescucci, A. and West, B. C. (2010), ‘Why users participate in online social networks,’ International Journal of e-Business Management, 4(1), 3.
Google Scholar
- Fruchterman, T. M. and Reingold, E. M. (1991), ‘Graph drawing by force‐directed placement,’ Software: Practice and experience, 21(11), 1129-1164.
Google Scholar
- Hein, D. I. O., Schwind, D. W. I. M. and König, W. (2006), ‘Scale-free networks,’ Wirtschaftsinformatik, 48(4), 267-275.
- Howison, J., Wiggins, A. and Crowston, K. (2011), ‘Validity issues in the use of social network analysis with digital trace data,’ Journal of the Association for Information Systems, 12(12), 767.
Google Scholar
- Kumar, R., Novak, J. and Tomkins, A. (2010). Structure and evolution of online social networks. In Link mining: models, algorithms, and applications (pp. 337-357), Springer New York.
Google Scholar
- Newman, M. E. (2002), ‘Assortative mixing in networks,’ Physical review letters, 89(20), 208701.
Google Scholar
- Newman, M. E. and Girvan, M. (2004), ‘Finding and evaluating community structure in networks,’ Physical review E, 69(2), 026113.
Google Scholar
- Noldus, R. and Van Mieghem, P. (2015), ‘Assortativity in complex networks,’ Journal of Complex Networks, cnv005.
Google Scholar
- Pastor-Satorras, R., Vázquez, A. and Vespignani, A. (2001), ‘Dynamical and correlation properties of the Internet,’ Physical review letters, 87(25), 258701.
Google Scholar
- Piraveenan, M., Prokopenko, M. and Zomaya, A. Y. (2008), ‘Local assortativeness in scale-free networks,’ EPL (Europhysics Letters), 84(2), 28002.
Google Scholar
- Quayle, A. P., Siddiqui, A. S. and Jones, S. J. M. (2006), ‘Modeling network growth with assortative mixing,’ The European Physical Journal B-Condensed Matter and Complex Systems, 50(4), 617-630.
Google Scholar
- Ridings, C. and Wasko, M. (2010), ‘Online discussion group sustainability: Investigating the interplay between structural dynamics and social dynamics over time,’ Journal of the Association for Information Systems, 11(2), 95.
Google Scholar
- Strogatz, S. H. (2001), ‘Exploring complex networks,’ Nature, 410(6825), 268-276.
Google Scholar
- Vázquez, A. (2003), ‘Growing network with local rules: Preferential attachment, clustering hierarchy, and degree correlations,’ Physical Review E, 67(5), 056104.
- van Mierlo, T. (2014), ‘The 1% rule in four digital health social networks: an observational study,’ Journal of medical Internet research, 16(2), e33.
Google Scholar