Introduction
Due to rapid economic growth, China is facing severe challenges related to population expansion, water and air pollution, solid waste overflow, desertification, reduction of biodiversity, etc. (Wong, 2013; Wang, 2010). A global survey by the National Geographic in 2012 ranked China as second worst with a consumer green index of 57.8 (Greendex, 2012). Environmental and green issues are of greater concern to Chinese consumers now (Chan, 1999; Chan et al., 2006; Shields and Zeng, 2012). A survey showed that 95% of Chinese consumers are aware of green advertising (Chan, 2004). Genuine green advertising can encourage a green economy, promote green products and encourage the green lifestyle. However exposure to misleading or greenwashed advertisements can reduce consumers’ trust and develop a barrier to future purchases (Albayrak et al., 2011; Chan, 2004; Chang, 2011; Cheah and Phau, 2011). Recently, several Chinese companies have been exposed for their greenwashing activities (Sourthern, 2012), suggesting the severity of greenwashing is increasing in China and research into greenwashing ads that could affect consumers’ purchase decisions is timely (Chan et al., 2006; Kronrod et al., 2012; Tan and Yeap, 2012).
Green marketing is still a very new concept to the Chinese market. It was only introduced to Chinese scholars around 1992 (Li, 2010). Chinese government officials and academics started exploring it in 1993 and 1994. Initially, the studies were mainly trade related issues focusing on the “green trade barrier” and its impact on China’s exports. Since 1998, the focus has been on the development of a green economy and the practices of green enterprises according to a China Council for International Cooperation on Environment and Development report (CCICED, 2011). Because green marketing is relatively new, there have been only a few academic studies on green advertising, green branding mechanisms, green strategies, and green consumer behavior in China (Guo et al., 2011). A survey by Guo et al. (2011) confirms that research on green advertising in China is still in its infancy. Guo et al. (2011) discovered that most of the research on green marketing published in the leading Chinese journals was confined to a general review of green marketing. Empirical research papers constitute only 6% of the 187 papers identified and contain limited longitudinal studies of green advertising regarding its features and reliability. The purpose of this study therefore is to establish an overview of green advertising, its characteristics and greenwashing status. The current study focuses on the following questions:
(1) What is the distribution of green advertising in China?
(2) What types of claims are advertised by enterprises in green advertising?
(3) How prevalent is greenwashing in Chinese green advertising?
This research is useful and timely because misused and unregulated green advertising can erode the trust of consumers in green and environmentally friendly products and create barriers to developing a green economy. The outcome of the research will be helpful to assist policy makers to formulate more effective green advertising regulations in China and for marketers to develop effective green product marketing strategies.
Green Advertising
Advertising Policy in China
China’s present laws and regulations do not provide clear constraints and guidelines towards greenwash advertisements. Laws in China involving advertising regulation are the Advertising Law, Anti-Unfair Competition Law, Law of the PRC on the Protection of Consumers’ Rights and Interests, Law of the PRC on Drug Administration, Law of the PRC on Tobacco Monopoly, Law of the PRC on Food Monopoly, Law of the PRC on Food Hygiene and Patent Law. These laws only indirectly regulate advertising by forcing advertisers, agencies, advertising content and media channels into compliance but are not directly legally binding on greenwash advertising. The current framework of “government-led, self-discipline and social supervision” (Liu, 2007) is insufficient to monitor greenwash advertising as it is not only difficult to coordinate all the relevant departments, central and local governments to effectively enforce the regulations, but the current self-regulatory framework of the national and local advertising industry associations also requires a huge amount of resources. For instance, in the first half of 2011, the State Administration for Industry and Commerce, which monitors 2,296 TV channels, 1,508 broadcasting frequencies and 324 newspapers nationally, identified that more than 230,000 false and illegal ads were published every day (The Association of China Advertising, 2012) but only 16,000 cases were dealt with.
Definition of Green Advertising
Iyer and Banerjee (1993) defined green advertising as involving one or more of three themes: planet preservation, animal life preservation or personal health preservation. Banerjee, Gulas and Iyer (1995) later extended this, suggesting that green advertisements should address the relationship between a product and the environment, convey a green lifestyle and show the environmental responsibility of corporations. Kilbourne (1995) further suggested that green advertising may include ecology or human health. The most representative definition came from Wagner and Hansen (2002) who proposed that environmental advertising or green advertising must meet at least one of the following criteria. It should show the relationship between a product and the environment; it should display the environmentally responsible image of the corporation; and/or it should advocate a green lifestyle, regardless of the particular product or service advertised. This definition is adopted to classify green and non-green advertisements in the current study.
Greenwashing
Greenwashing is generally defined as a way advertisers intend to influence consumers on firms’ public reputations and socially responsible images by advertising misleading, deceptive or unsubstantiated green messages (Beder, 2002; Laufer, 2003; Munshi and Kurian, 2005). Consumers’ perceptions of green ads as dishonest can greatly reduce their effectiveness. Deceptive green messages and overuse of greenwashing can seriously affect trust between organizations and green consumers (Delmas and Burbano, 2011). Bazillier and Vauday’s (2009) study showed that 68% of consumers believe organizations are overstating their green claims or greenwashing. A survey by Cone Consulting of over 20,000 consumers worldwide in 2009 found out that 64% of consumers believed that sustainability is just a marketing tool (Cone, 2009). A more recent survey by Cone Consulting shows that 80% of Americans do not believe companies are disclosing all of their environmental impacts, and 56% do not trust companies’ green claims. Nearly three-quarters of consumers (71%) will stop buying a product if they feel misled by environmental claims (Cone, 2012). These studies demonstrate that without proper regulation, green marketing may be viewed by consumers as information pollution (Responsibility, 2009). Therefore, assessing the status of greenwashing in China is essential for establishing an evidence based framework to regulate green advertising in China.
Analysis Framework
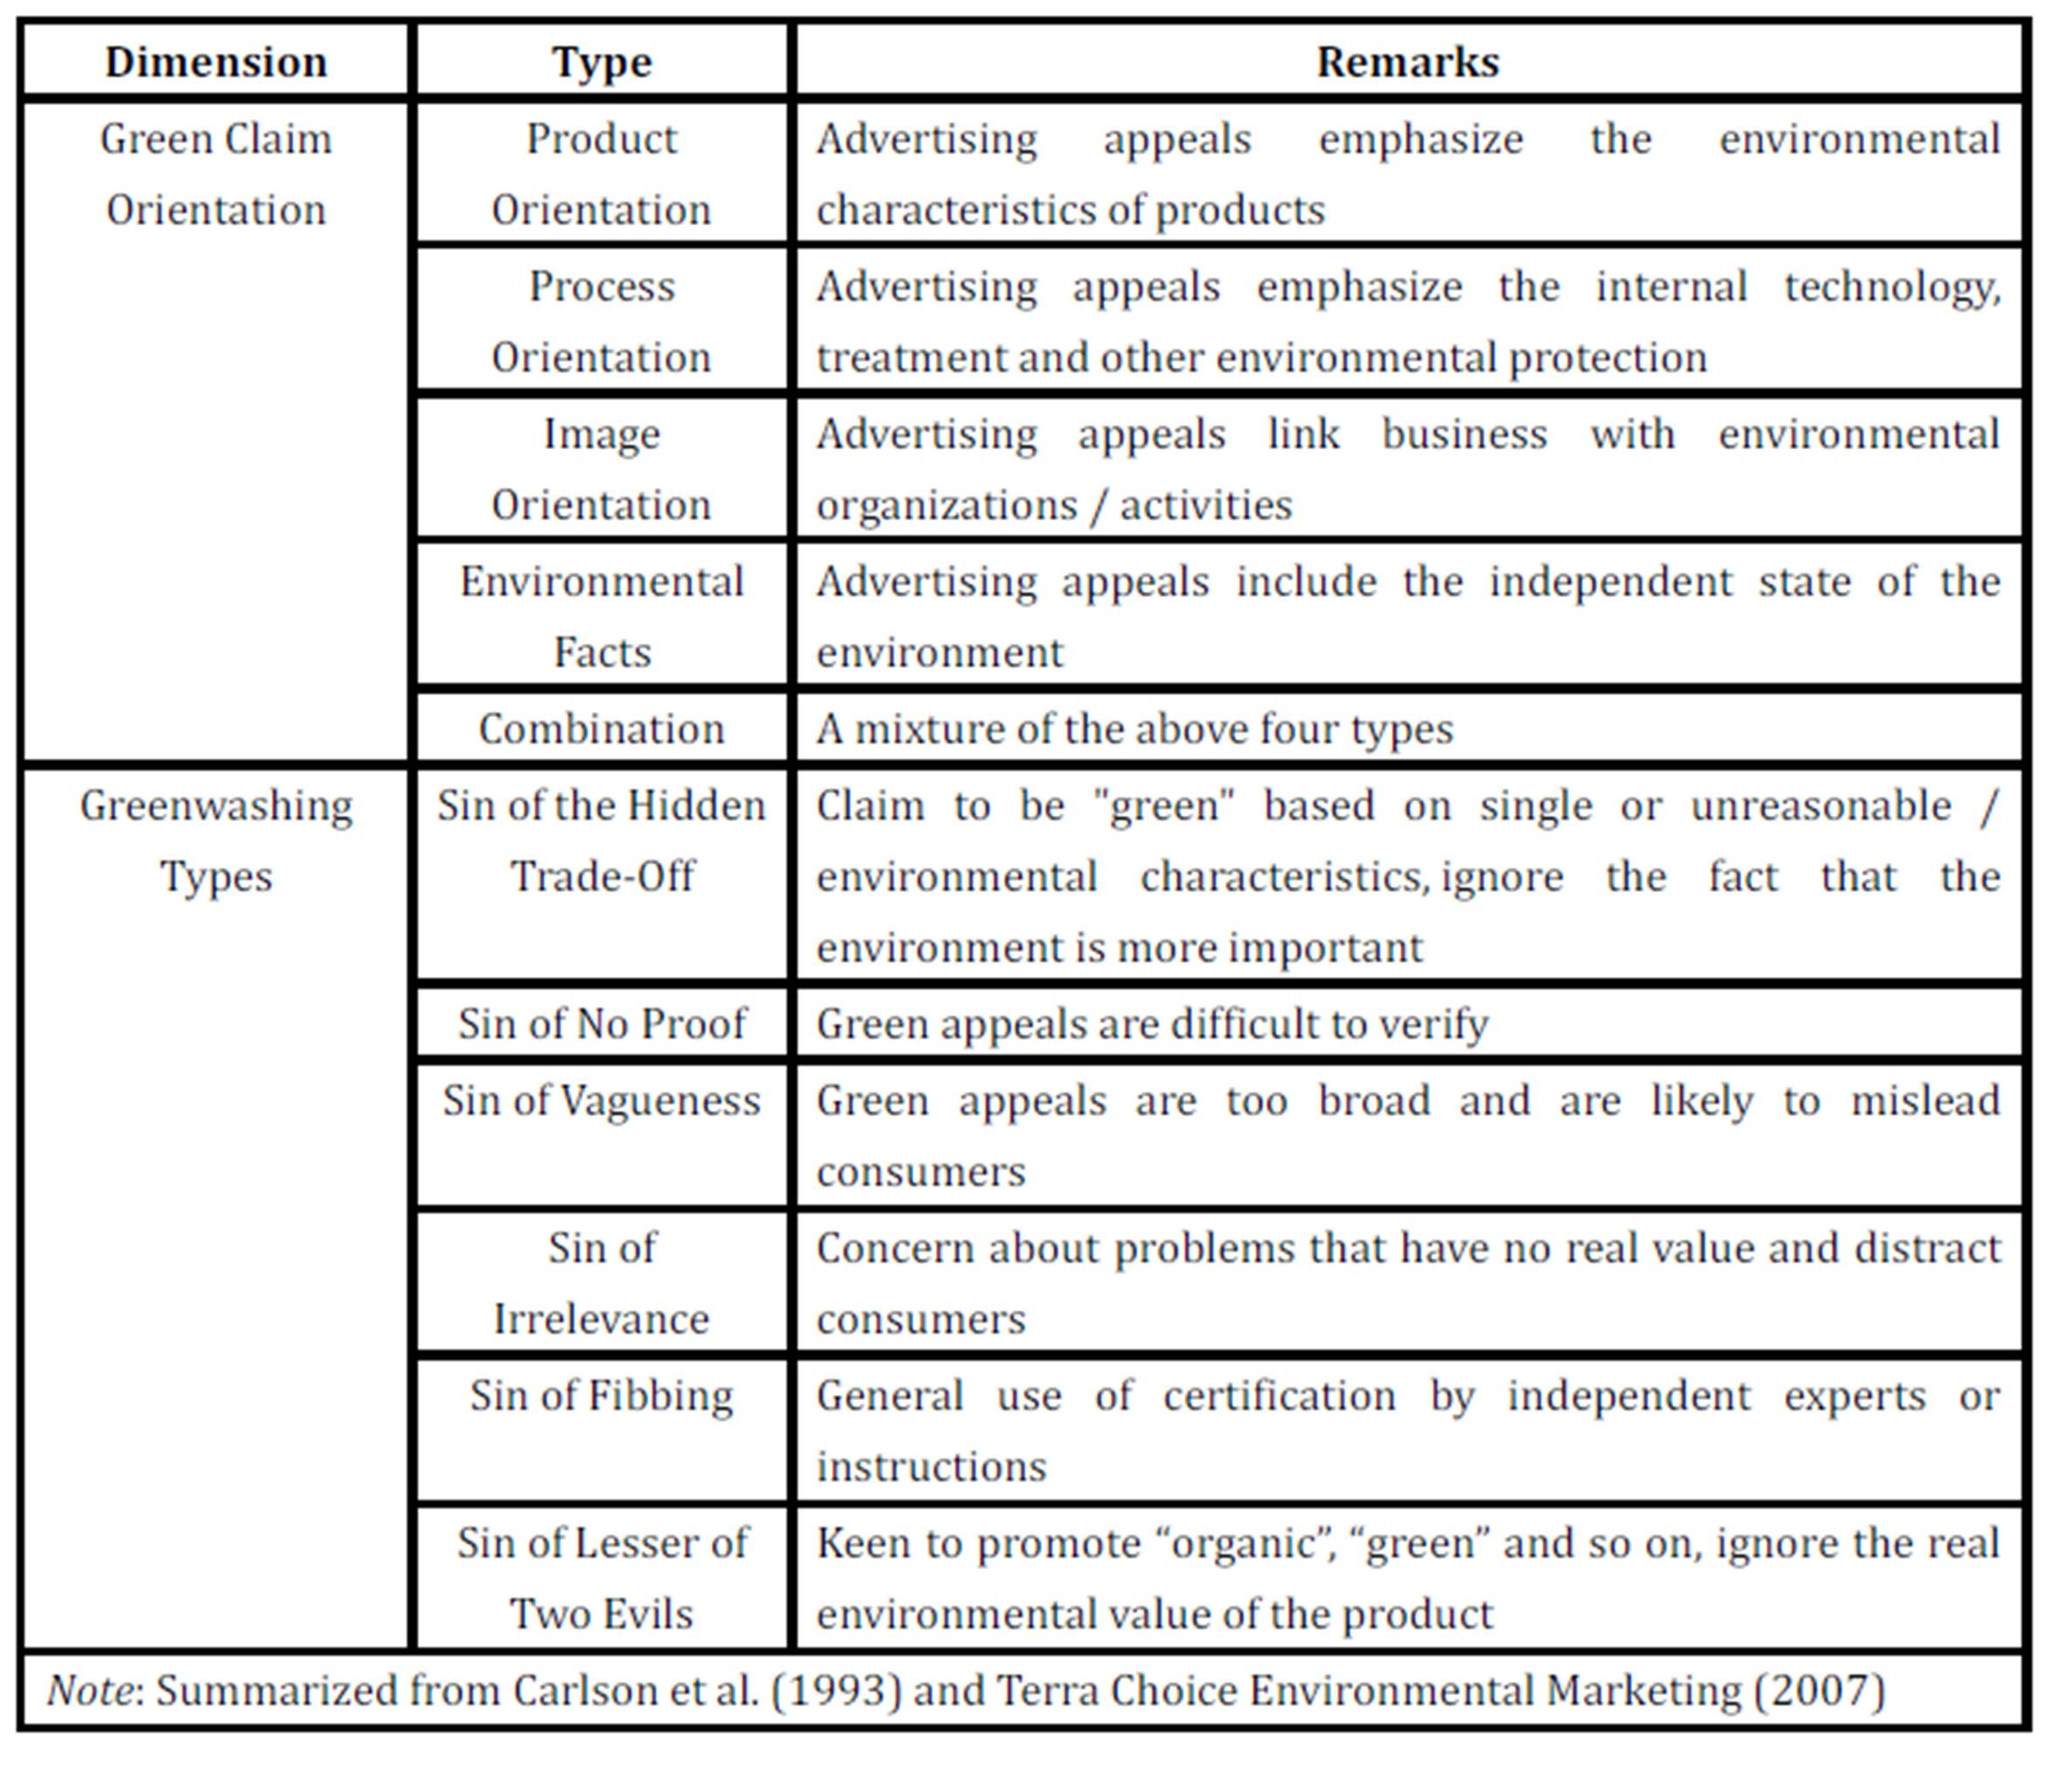
To facilitate the analysis of different levels of deceptive/misleading ads and different orientations, Carlson, Grove, and Kangun (1993) divided advertising claims into a two dimensional classification system. In the deceptive/misleading dimension, the Vague/Ambiguous category refers to claims that contain a phrase or statement that is too broad to have a clear meaning. The Omission category refers to claims that omit important information necessary to evaluate their accuracy or plausibility. False/Outright Lie refers to claims that are inaccurate or are fabrications. In the claims orientation dimension, Product Orientation refers to claims focusing on the environmentally friendly attributes that a product possesses. Process Orientation refers to claims that deal with an organization’s internal technology, production techniques and/or disposal methods that yield environmental benefits. Image Orientation refers to claims that associate an organization with an environmental cause or activity for which there is broad based public support. Environmental Facts refers to claims that involve an independent statement that is ostensibly factual in nature from an organization about the environment in general, or its conditions. Based on the two classification methods, Carlson et al. (1993) proposed a matrix framework to analyze the degree to which advertising could be classified as greenwashing.
Besides the Carlson matrix framework for classifying deceptive green advertisements, Terra Choice Environmental Marketing (2007) proposed a “six sins of greenwashing” classification framework consisting of the Sin of the Hidden Trade-Off, Sin of No Proof, Sin of Vagueness, Sin of Irrelevance, Sin of Fibbing and Sin of the Lesser of Two Evils. This framework has been deployed successfully to systematically analyze deceptive/misleading information in green advertising for 1,018 products making 1,753 environmental claims in North America. This framework has been very popular and widely accepted (Bergeson, 2008; Baum, 2012).
Overall, Carlson’s framework for classifying green advertising has been useful and generally adopted. The two dimensional classification matrix is adapted in this study for conducting a content analysis of green advertising as a possible extension to Carlson’s work for evaluating greenwash advertising in China. The classification framework in this study includes the six sins of greenwashing and the dimension of Carlson’s claim orientation (See Table 1). This framework has recently been adopted to study green advertising in the United States and United Kingdom (Baum, 2012). Adopting a proven framework will enable the extent of greenwashing and the tendency to commit such “sins” among both local and foreign corporations in China to be compared. In addition, a general overview of the distribution of green advertising in China and claim types will provide a benchmark for future studies.
Method
Sample Selection
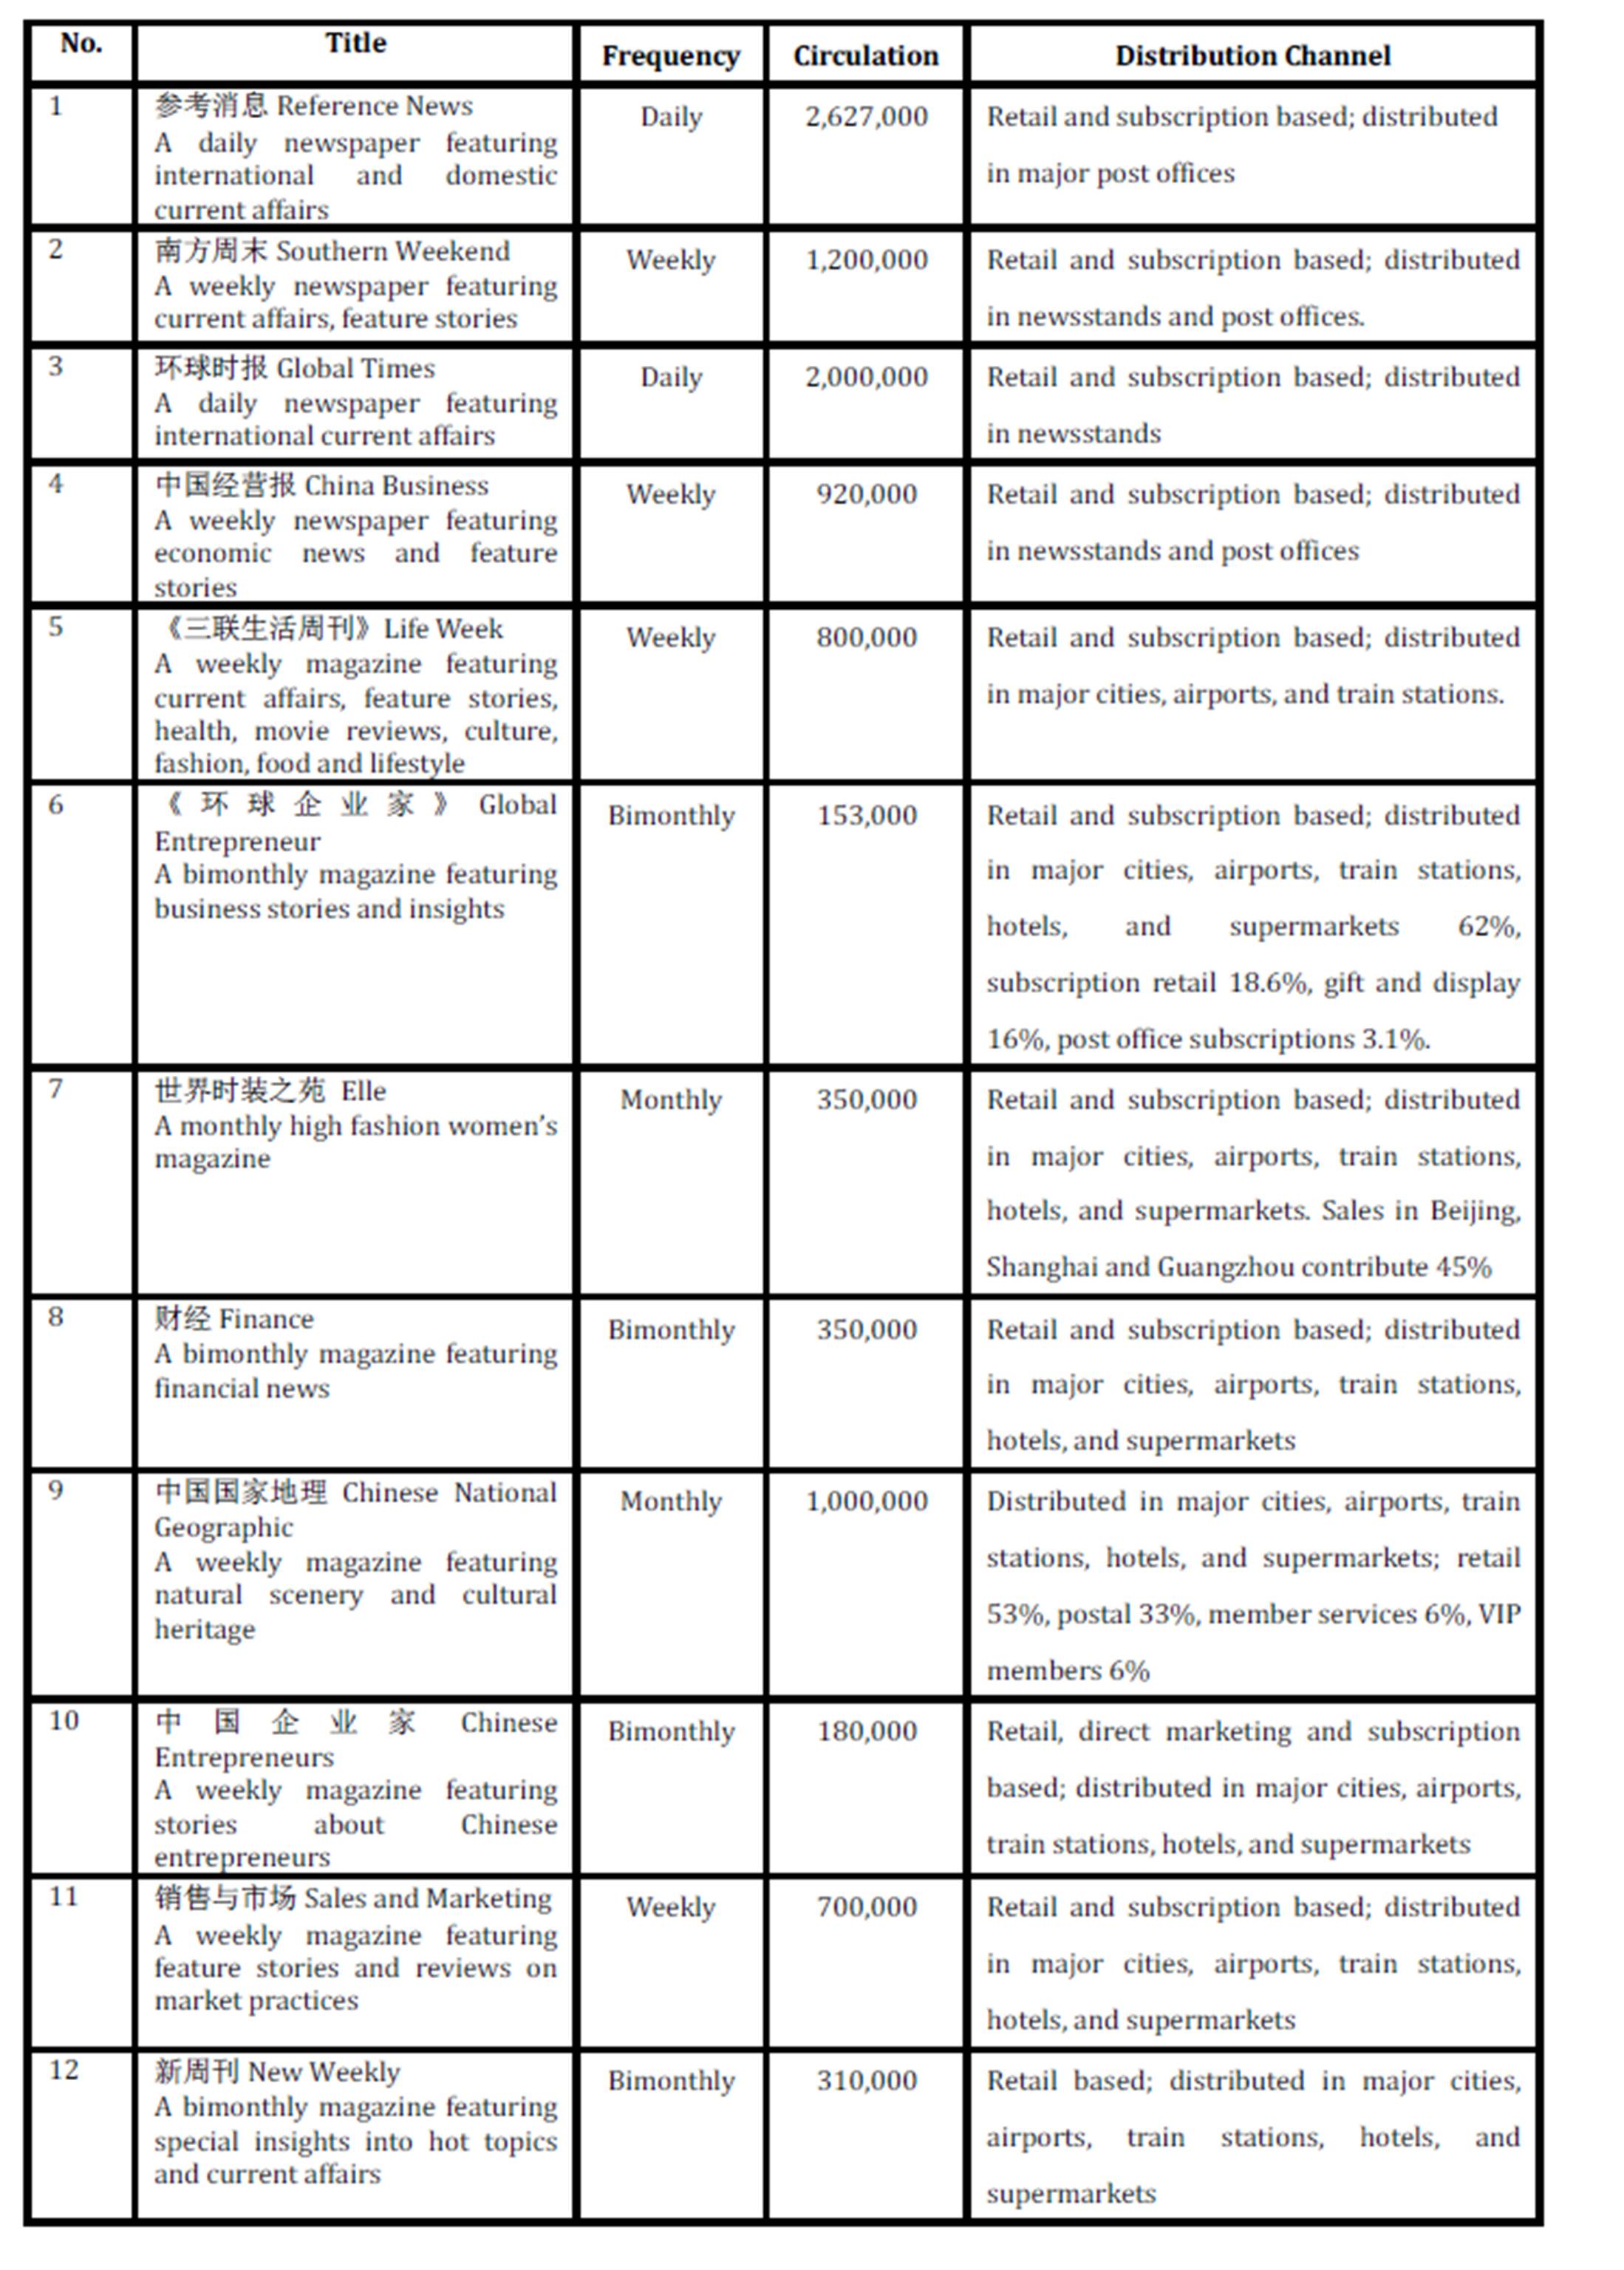
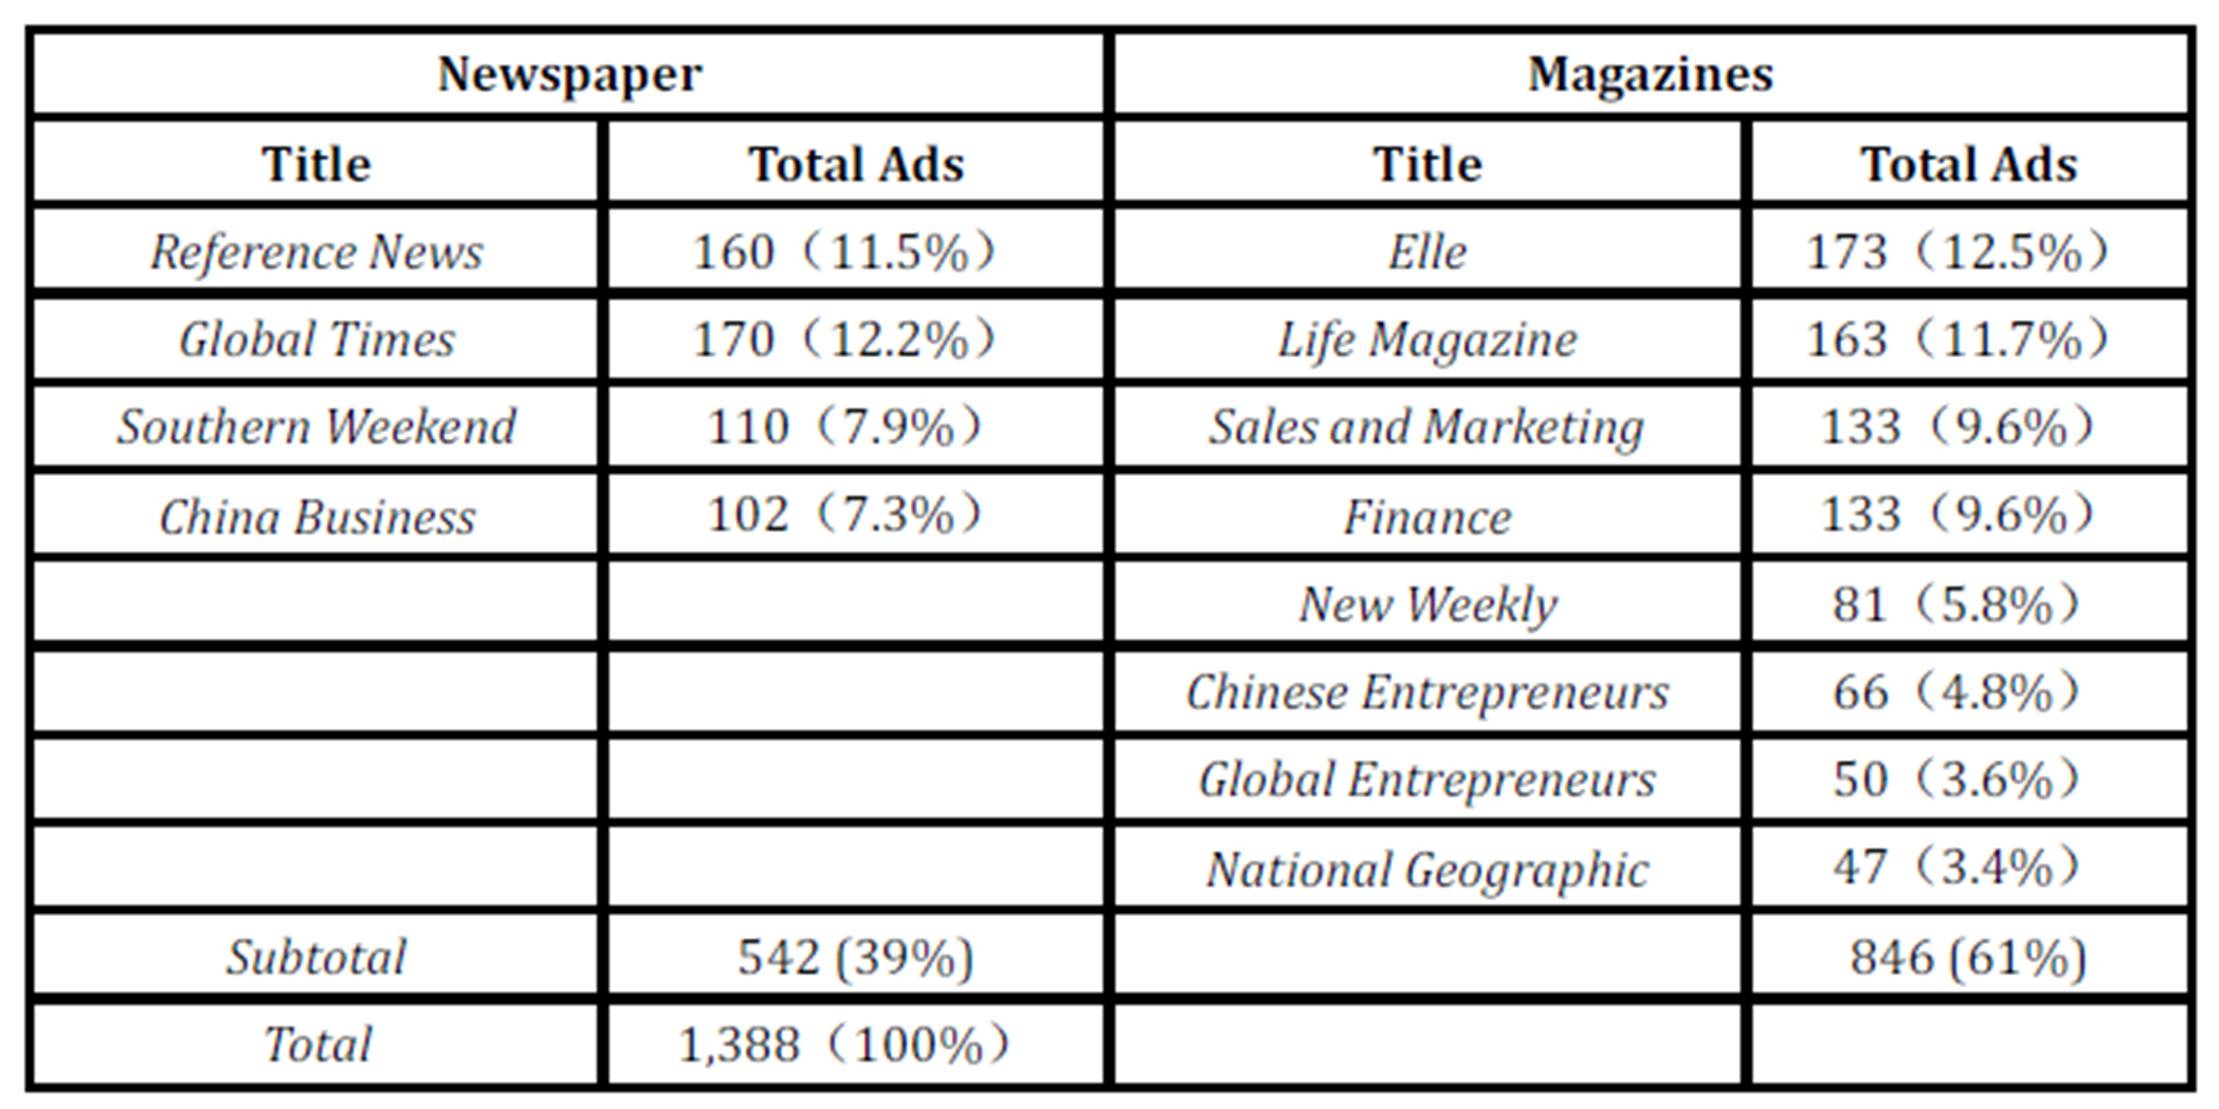
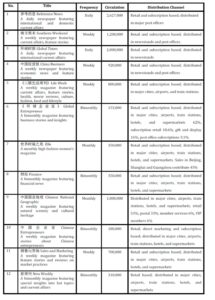
Samples of newspapers and magazines were selected based on circulation, reader demographics, distribution channels, online readership and reputation. Following the above criteria, four newspapers and eight magazines were selected as data sources based on the 100 most valuable advertising media outlets according to the China Advertising Association (CAA, 2009). These data sources are Southern Weekend, Finance, Chinese National Geographic, Global Entrepreneur, Life Magazine, Sales and Marketing, Reference News, Global Times, China Business, Chinese Entrepreneurs, Elle and New Weekly. Detailed information about each magazine can be found in Table 2.
Table 1: Analysis Framework of Green Advertising
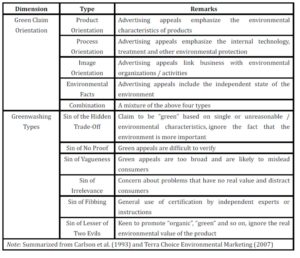
Table 2: Sources of Print Media
Research Methods
The advertisement types were classified based on China’s National Industrial Classification (State Statistical Bureau, 2011) and Industry Classification of Listed Companies Guidelines (CSRC, 2001). Initial analysis showed that the main sources of green advertising were mostly from the manufacturing sector. Subsequently, the manufacturing sector is further divided into food manufacturing, beverages, textiles, clothing, fur, wood, furniture, paper, printing, petroleum, chemicals, plastics, metal, non-metallic, machinery, equipment, instruments, pharmaceuticals, biological product manufacturing and other manufacturing industries. The transport equipment and the home appliances industries, which had a larger number of green advertisements, were listed separately. Other industries included agriculture, forestry, animal husbandry and fishery, mining, electricity, gas and water production and supply, construction, transportation, warehousing, information technology, wholesale and retail trade, finance, insurance, social services, communication and cultural industries and miscellaneous industries. Next coding was performed on the collected sample advertisements. Coding include the general aspects of green advertising, the claims of green advertising and the types of greenwashing. The coding method records the advertising types (corporate ads = 1, product ads = 2), appeal types (product-oriented, process-oriented, image-oriented and environmental; coding: present = 1, not present = 0), green pictures (with or without), the overall presence of green features (with or without), page size (full-page, folio, [1/2, 1), [1/4, 1/2), [1/8, 1/4) and <1/8), and the features of greenwashing (no greenwashing, hidden trade-off, no proof, vagueness, irrelevance, fibbing and lesser of two evils; coding: present = 1, not present = 0).
Pilot Study
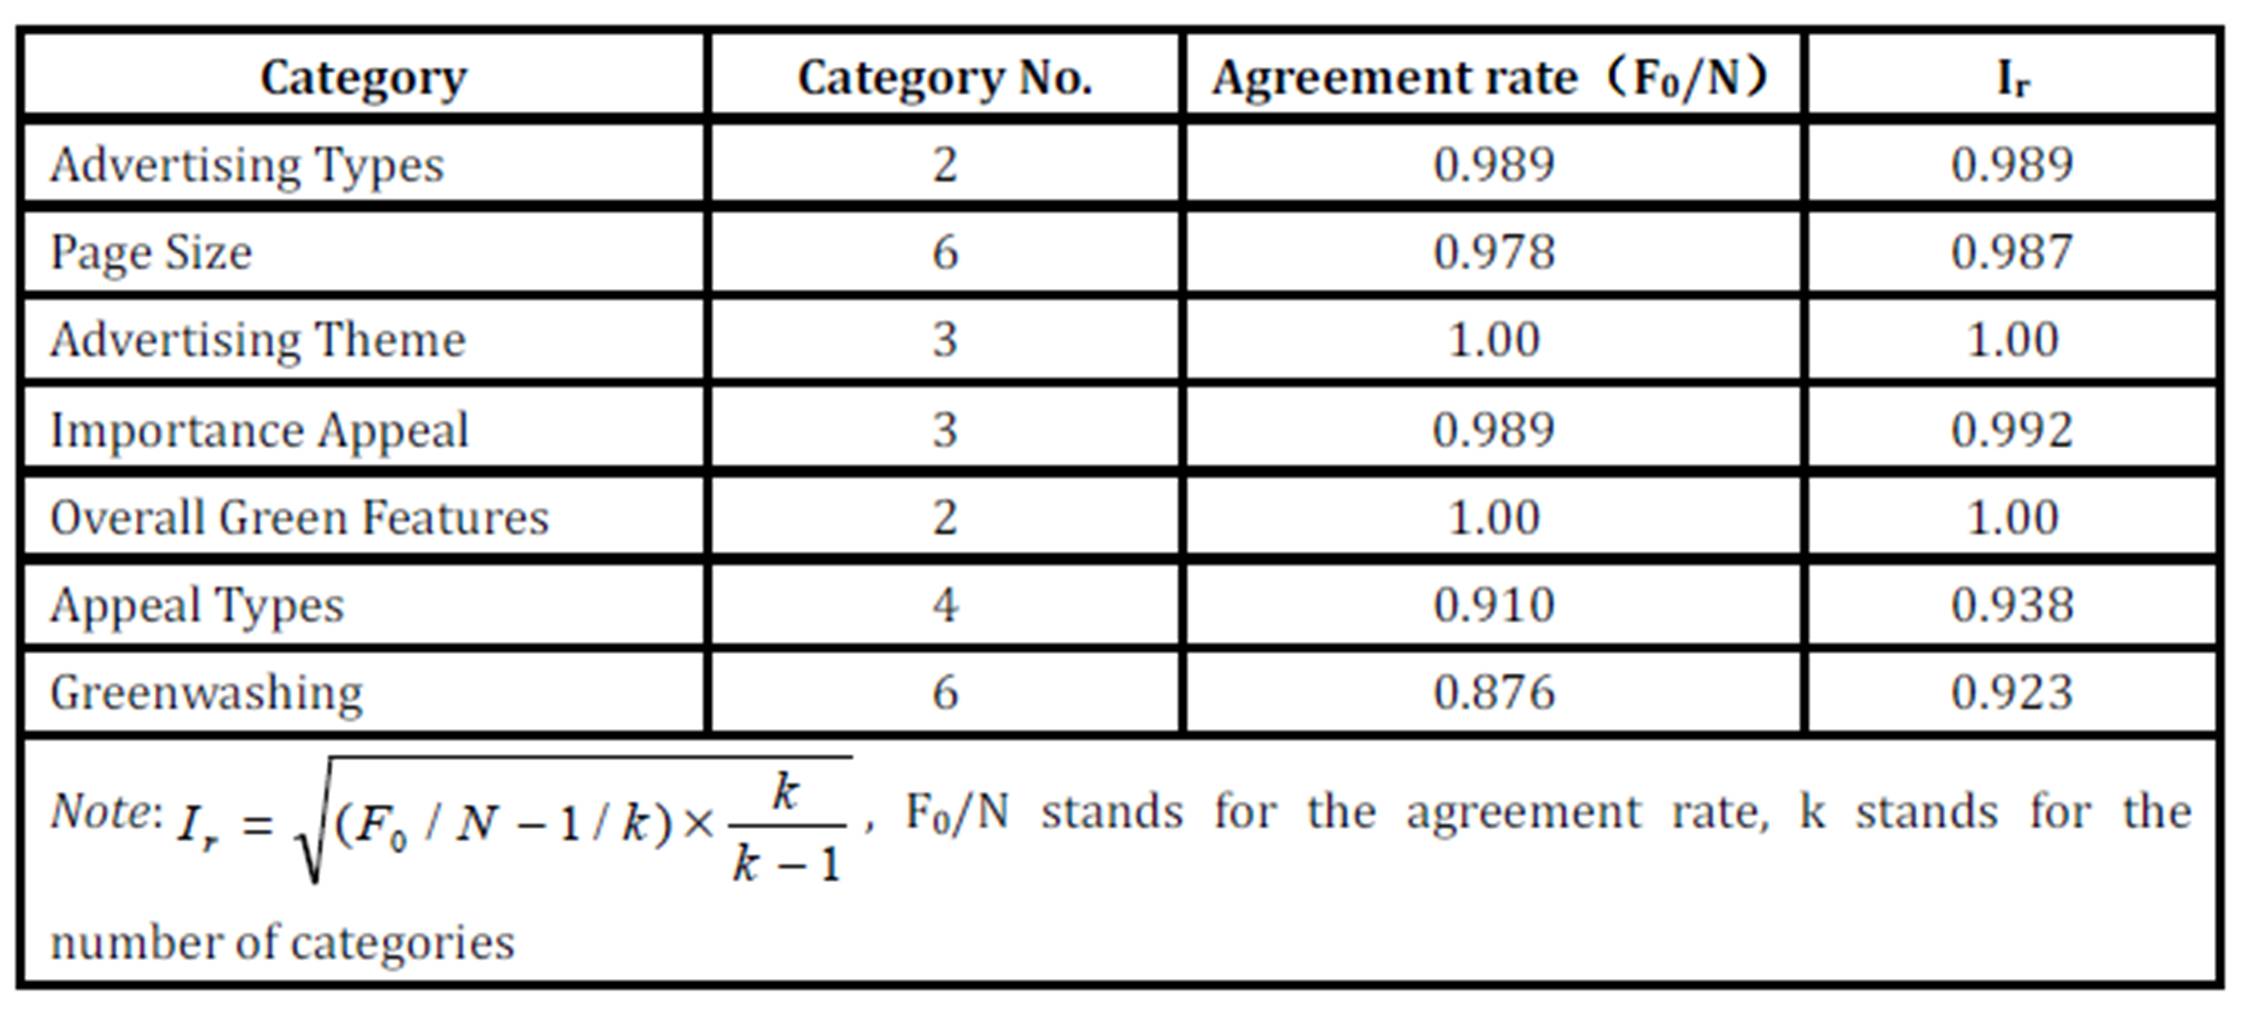
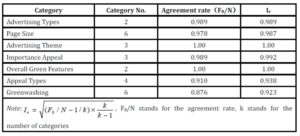
Three marketing research assistants were trained by the principal investigator to do the coding. The training included understanding the definition of green advertising, green claims, green certifications and symbols, and greenwashing. All the materials were derived from pertinent green marketing literature. Samples of green and greenwashing advertisements were shown to the coders. In order to ensure reliability, the three investigators first independently coded 89 ads from Sales and Marketing. The inter-rater reliability of the descriptive characteristics such as ad type, theme, green symbol image, the overall green features and the layout was 0.9 or more, indicating a highly satisfactory level of agreement in the coding. This study used the formula Ir proposed by Perreault and Leigh (1989) to test the coding reliability. The final coding reliability was acceptable and is depicted in Table 3.
Table 3: Coding Test Reliability
Results
Sample Description
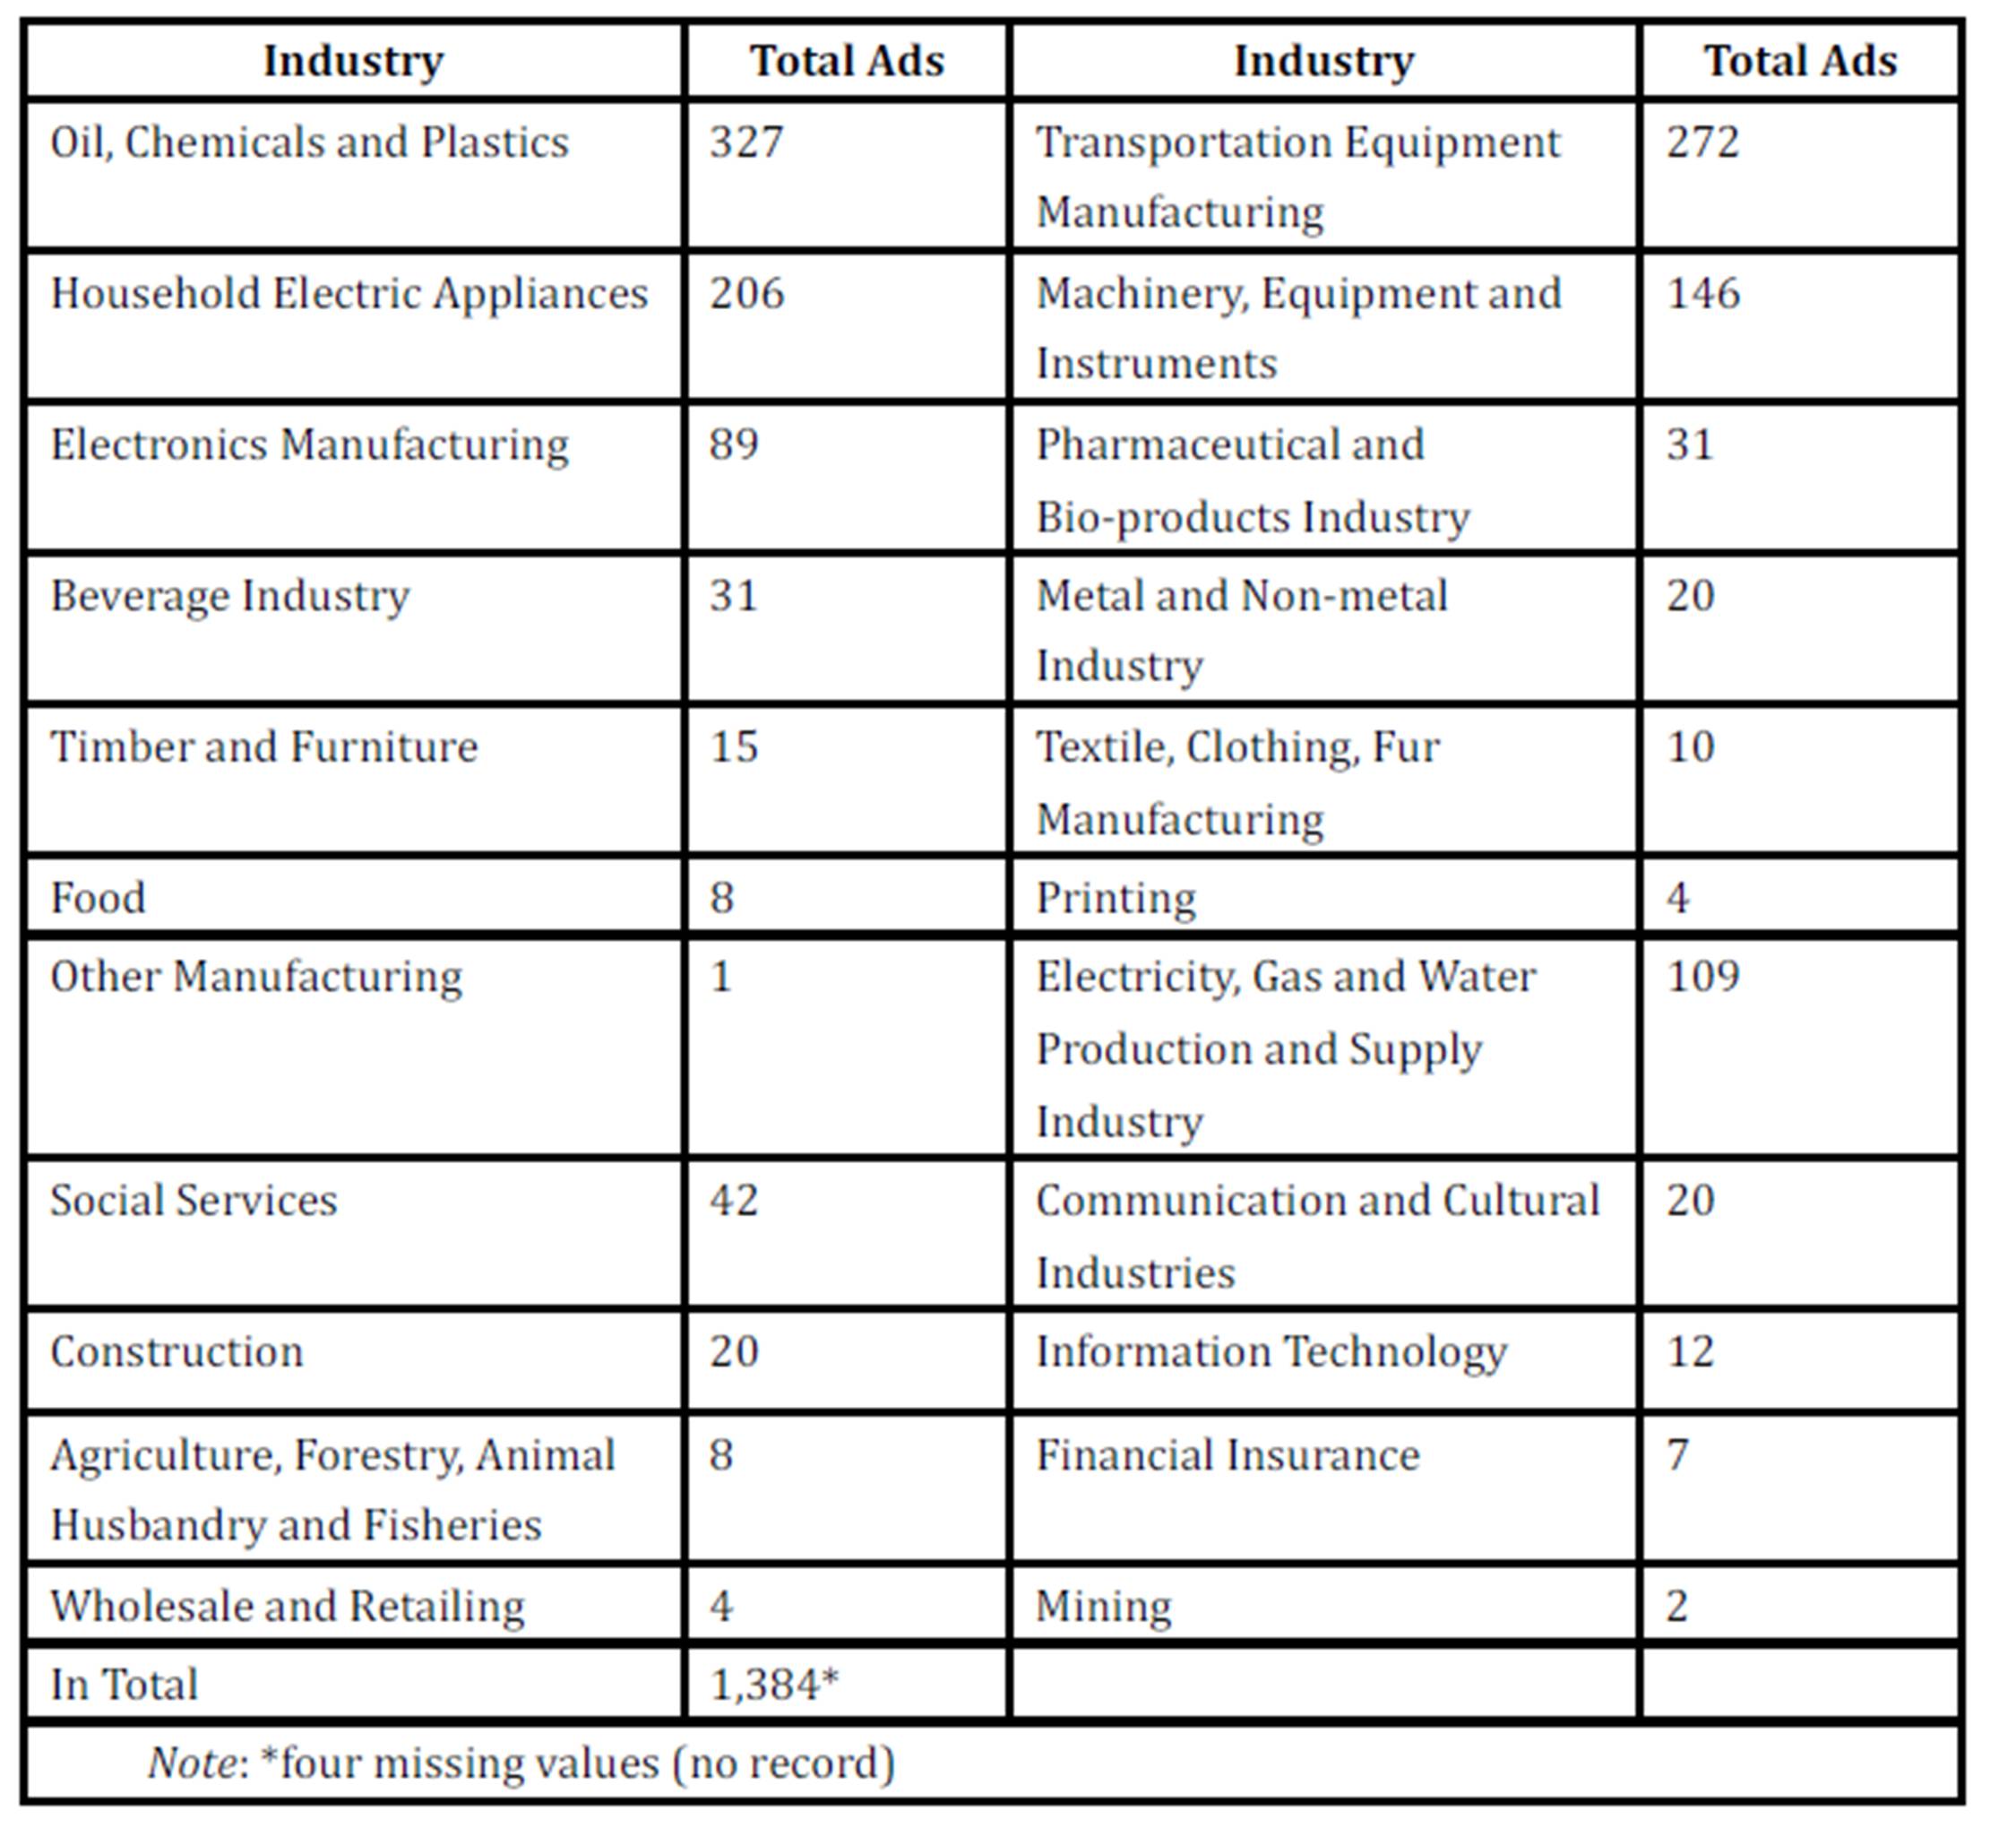
The study identified 12 types of printed media and 3,006 green advertisements published between January 2000 and June 2009 as some magazines were not available after this date. The total number of new ads was 1,388. In the 1,388 ads, 846 were from magazines and 542 were from newspapers. Popular lifestyle magazines such as Elle and Life Week contained a quarter of the ads while executive magazines such as Global Entrepreneurs and Chinese Entrepreneurs contained less than 10% of the ads. This shows that marketers are targeting the affluent and lifestyle conscious consumers. Table 4 shows the sources of the ads and Table 5 shows the distribution by industry. As anticipated, the manufacturing industries had the most green advertisements: a total of 1,160, accounting for 86.7%, with the oil and chemical industries, transport and household appliance industries responsible for almost 60% of the green ads. This shows that enterprises are using green ads to target consumers to influence their big household purchase decisions. Figure 1 depicts the trend of green ads per year over the period 2000 (January) to 2009 (June). Since 2004, the year-on-year increase in green ads is more than 50%. Given the recent high GDP growth of China’s economy, green ad expenditure is likely to continue in this trend.
Table 4: Sources of Green Advertising
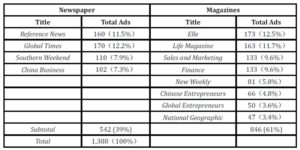
Table 5: Frequency of Green Ads by Industry
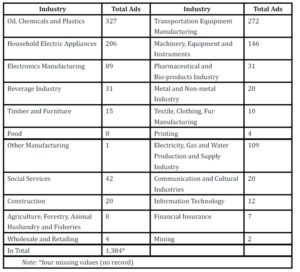

Fig 1: Ads from 2000 (January) to 2009 (June)
The Media Characteristics of Green Advertising
Advertisers were willing to spend on green ads: as much as 43% of green advertisements used folio to enhance impact. Full page green ads were not very popular as they only accounted for 8%. The [1/2, 1) size accounted for 17%, almost equal to the [1/4, 1/2) size which accounted for 19%. Only 5% of ads used the [1/8, 1/4) size and less than 1/8 pages accounted for 8%.
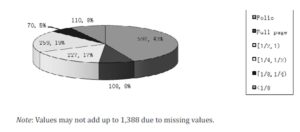
Fig 2: Distribution of Ad Size
The study revealed that not all green ads contain pictures. Only 903 out of 1,388 ads used pictures, accounting for 65.1%. It is possible that Chinese characters are already a form of visual cue that can enhance recall by adding deeper meaning to the advertising message (Schmitt et al., 1994; Lee and Ang, 2003). For example General Electric in its “ecomagination” series used Chinese characters to convey the enterprise’s green messages. Of the 903 green ads that contain pictures, only 439 (31.6%) used the color green in the picture or symbol, while the other 68.4% of pictures do not use the color green but are still very bright in design.
Distribution of Green Advertising
Among the 1,388 ads, 48.9% were from domestic enterprises, 40.7% from foreign enterprises and joint ventures accounted for 10.3%. The yearly distribution profile of new ads for joint ventures was similar to the overall trend. However, the yearly distribution of domestic enterprise and foreign-owned enterprise ads were quite different. Domestic enterprises published a larger number of ads before 2004, but after 2004 the number decreased. It is possible that domestic enterprises were constrained in advertising expenditures and as a result the green advertisements of domestic enterprises were repeated frequently and there were fewer new ads. The number of new green advertisements from foreign enterprises showed a steady increase, especially in 2008 when it reached its peak (as data were inaccessible for the full year in 2009, comparison cannot be made directly with the year 2009).
Types of Green Ads
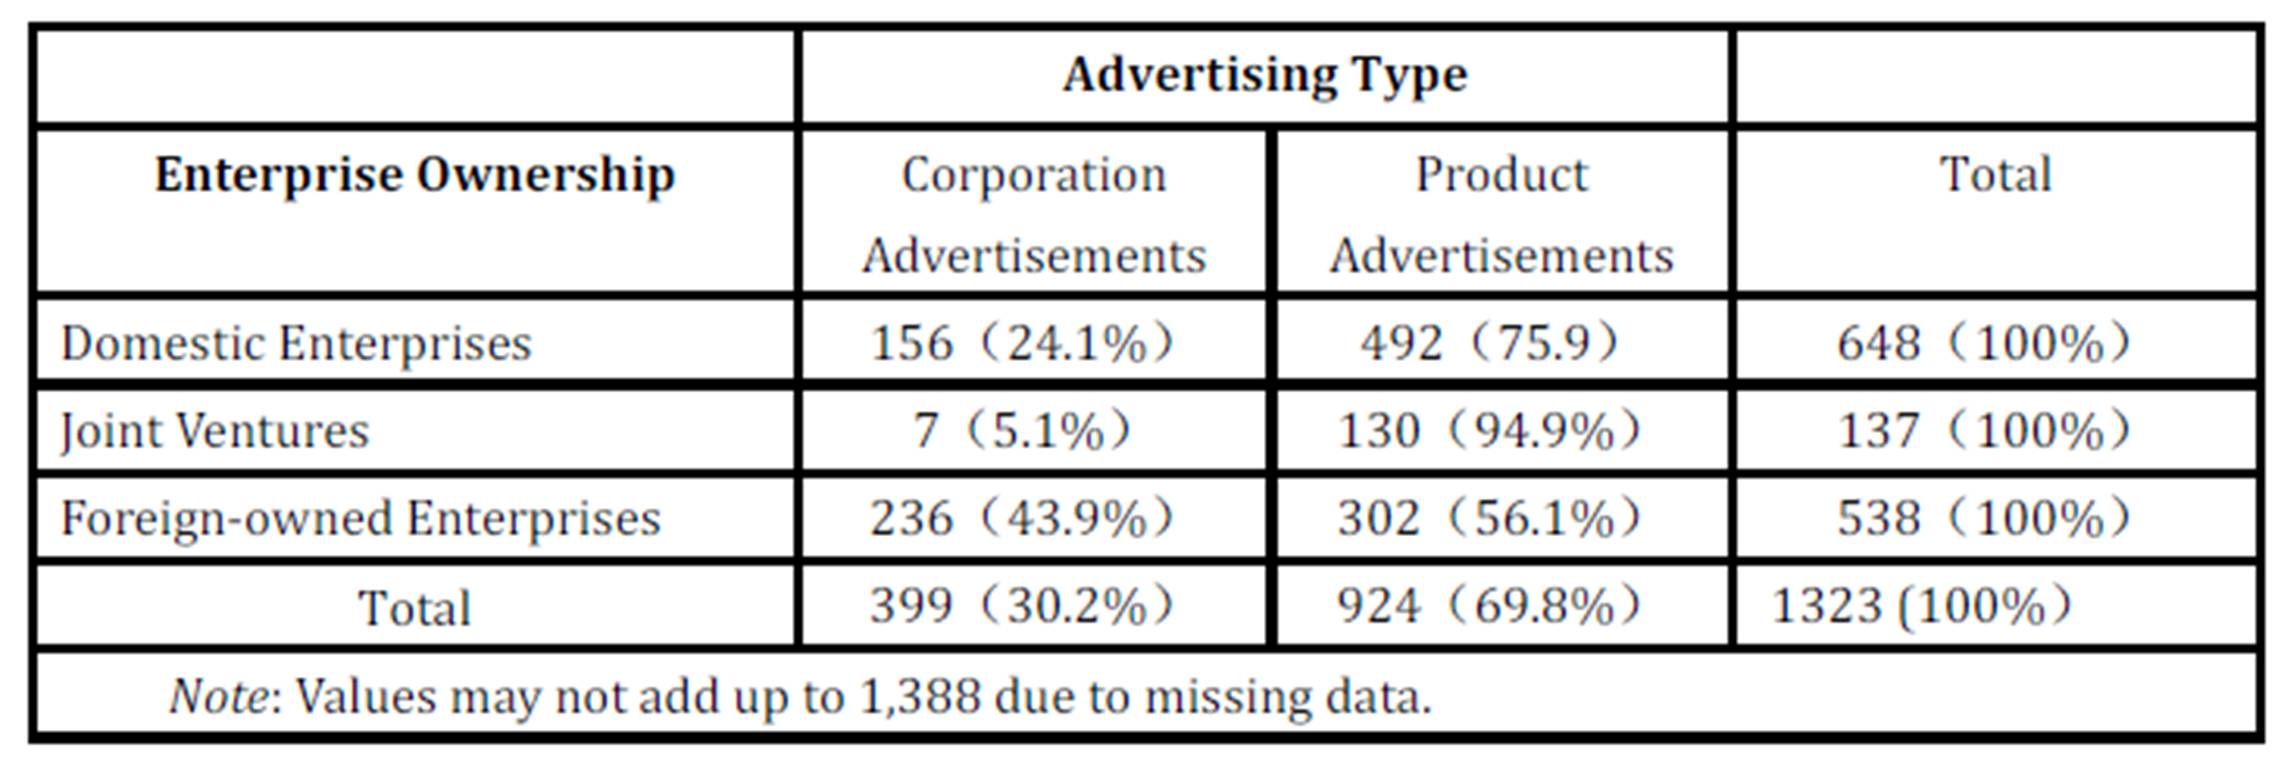
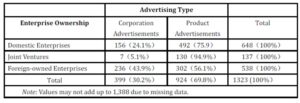
Among the ads, product related ads constituted the majority, 69.8% in total, while the number of corporation related ads was less than half of the number of product advertisements: 30.2%. Among the three types of enterprises, domestic enterprises primarily published product advertisements, accounting for 75.9%. The overwhelming majority (94.9%) of joint ventures had product advertisements. For foreign-owned enterprises’ product ads comprised 56.1% (See Table 6). These numbers show that enterprises in China were more motivated by product sales than corporate image when deploying green advertising, while foreign enterprises adopted a more balanced strategy.
Table 6: Green Advertising Types and Enterprise Ownership
Types of Claim Orientation
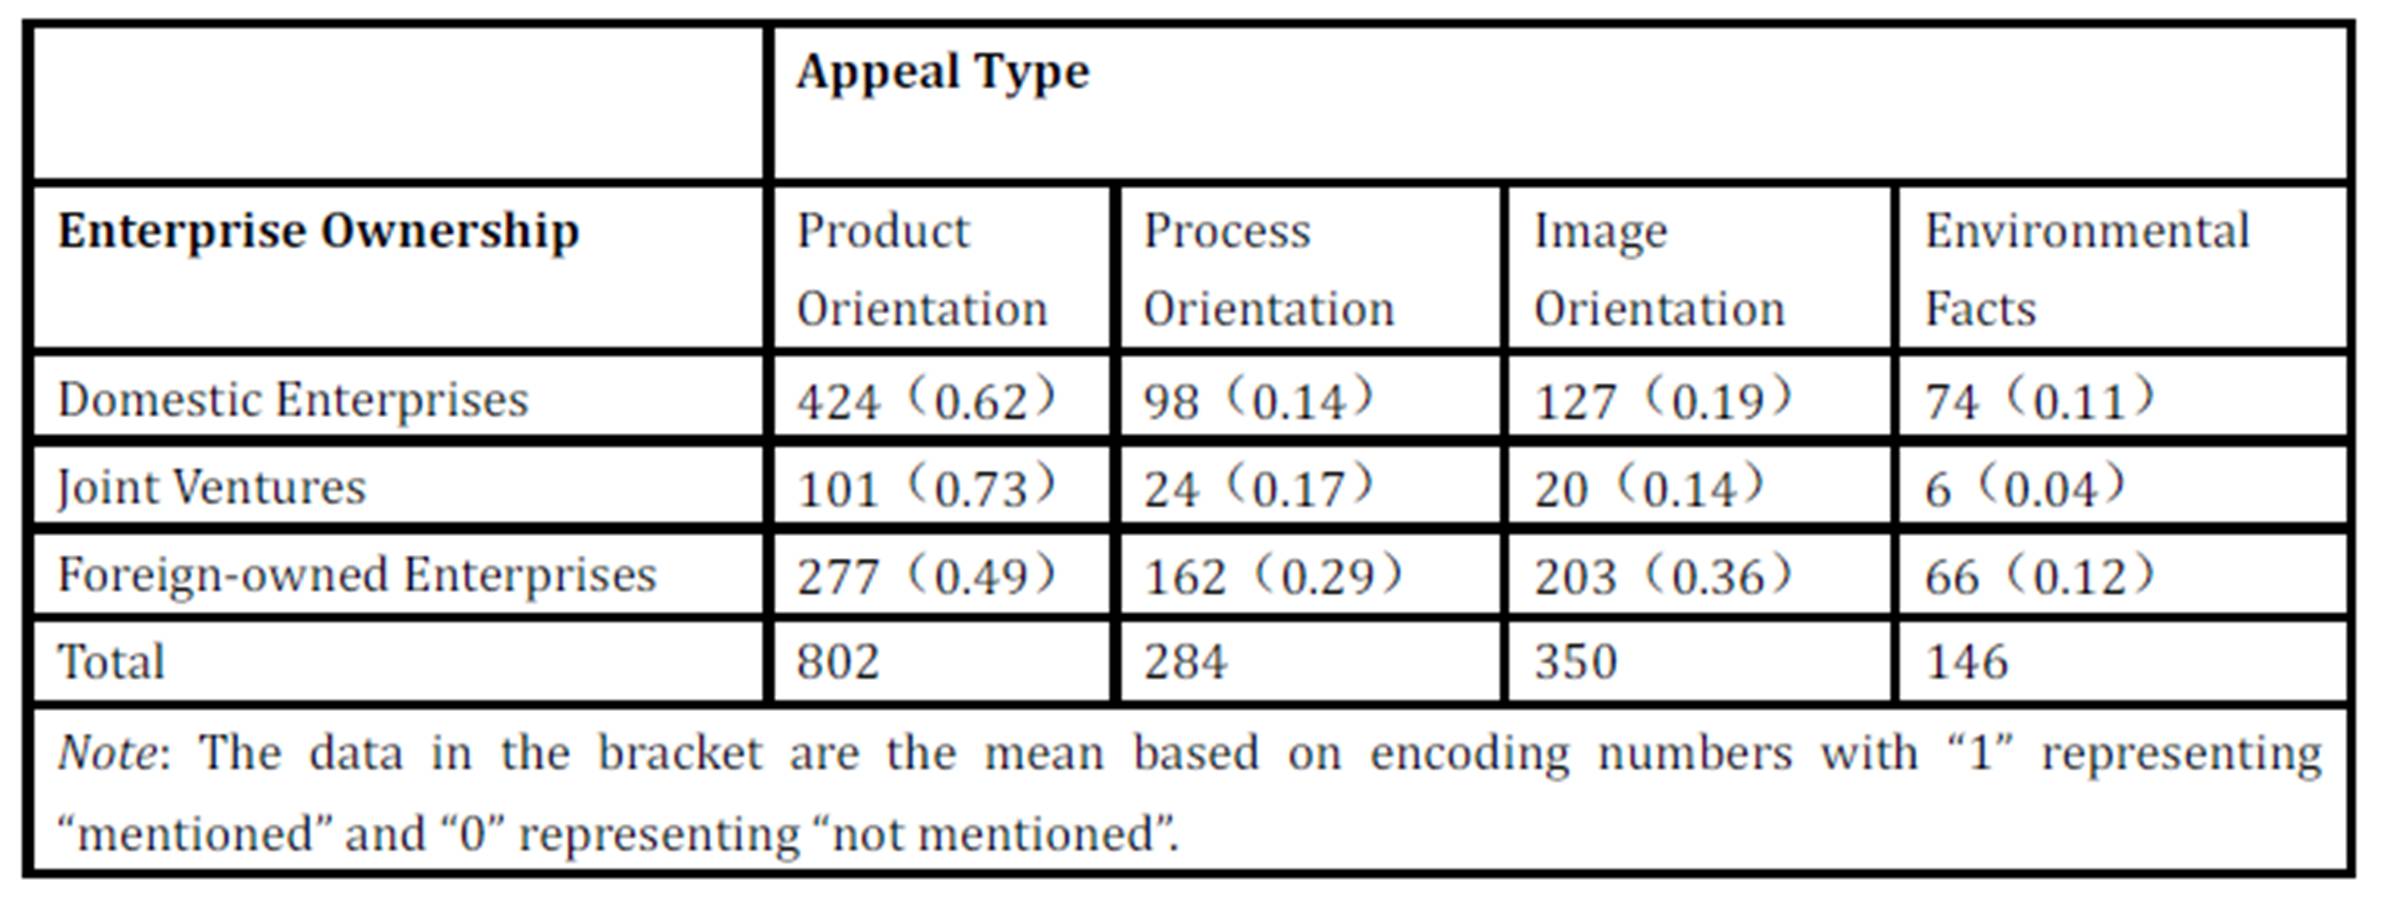
With respect to the type of claim, 50.7% were product-oriented, 22% image-oriented, 17.9% process-oriented, and lastly 9.2% presented environmental appeals (See Table 7). It should be noted that, as in Carlson’s study, some advertisements have more than one type of claim. Accordingly, the 1,388 ads contain a total of 1,582 claims.
In domestic enterprises, product-oriented advertisements comprised the majority, having an average appearance of 0.62, followed by image-oriented advertisements with an average appearance of 0.19, then the process-oriented advertisements, whose average appearance was 0.14. Advertisements stating environmental facts were the least common, with an average appearance of 0.11. In joint ventures, product-oriented advertisements had an average appearance of 0.73, higher than that of domestic enterprises but they had the lowest level of environmental appeals: only 0.04. The distribution trends of foreign-owned enterprises were quite different from the other two types of enterprises. The average appearance of product-oriented ads from foreign-owned companies was 0.49, the lowest of the three categories of enterprises. However, they had the highest level of image-oriented ads at 0.36.
To further identify any significant differences between the enterprises and claim types, single factor and variance analysis of various enterprises and their claims were conducted. F tests (p <0.05) showed that enterprise type had a significant impact on claim type. Post hoc analysis of domestic enterprises and foreign- owned enterprises showed that the product-oriented claims of domestic enterprises were higher than those of foreign-owned enterprises (p = 0.028), and the process-oriented (p = 0.023) and image-oriented (p = 0.024) claims of foreign-owned enterprises were significantly higher than those of domestic enterprises. The post hoc analysis was not performed on joint ventures because of the small sample size (less than 30).
Table 7: Claim Orientation and Enterprise Ownership

The Use of Green Certification
The use of green certification standard identification marks was rather low. Among the 1,388 ads, only 146 ads mentioned green certification, accounting for 10.5%. Among the certification standards, European standards were used most often at 37.7%. The use of ISO certification and the China Environmental Labeling Product Certification were 12.3% each. The ISO certifications used were mainly ISO9001, ISO9002, ISO14001, ISO14002, IS14003 and ISO14004. The Chinese energy-saving product certifications comprised 7.5%; there were 10 ads mentioning government testing (including the Environmental Protection Department), accounting for 6.8%; 8 ads pointed out that they are recommended by the Advertising Association, accounting for 5.5%; 5 ads each mentioned Chinese green product certification, green cleaner production certification and award-winning ads, each accounting for 3.4%; 4 said they were certified by an ISO Technical Committee, while 3 had Chinese green certification, respectively accounting for 2.7% and 2.1%; 2 ads stated they were Energy Star 4, accounting for 1.4%; each of the others had one each, a combined total of 14, such as the Blue Angel environmental signs, accounting for 9.6%.
Distribution of Greenwashing Ads
Among the 1,388 ads, 512 or 36.9% were perceived to be greenwashed. The vast majority of greenwashing displayed the sin of no proof, accounting for 52.1%. About 23% of ads committed the sin of the lesser of two evils, 17.8% of ads exhibited the sin of vagueness and 14.1% of ads altered the concept of green. The sins of irrelevance and fibbing accounted for 5.5% and 2.7%, respectively.
Further analysis of means showed that on average 46% of the domestic enterprises, 38% of joint ventures and only 25% of foreign-owned enterprises were suspected of greenwashing. An analysis of variance showed that the differences between the three groups were significant (p=0.000). Post hoc analysis showed that the greenwashing phenomenon in domestic enterprises and joint ventures was significantly higher than among foreign-owned enterprises, at significance levels of 0.000 and 0.005.
Analysis of the Greenwashing Matrix
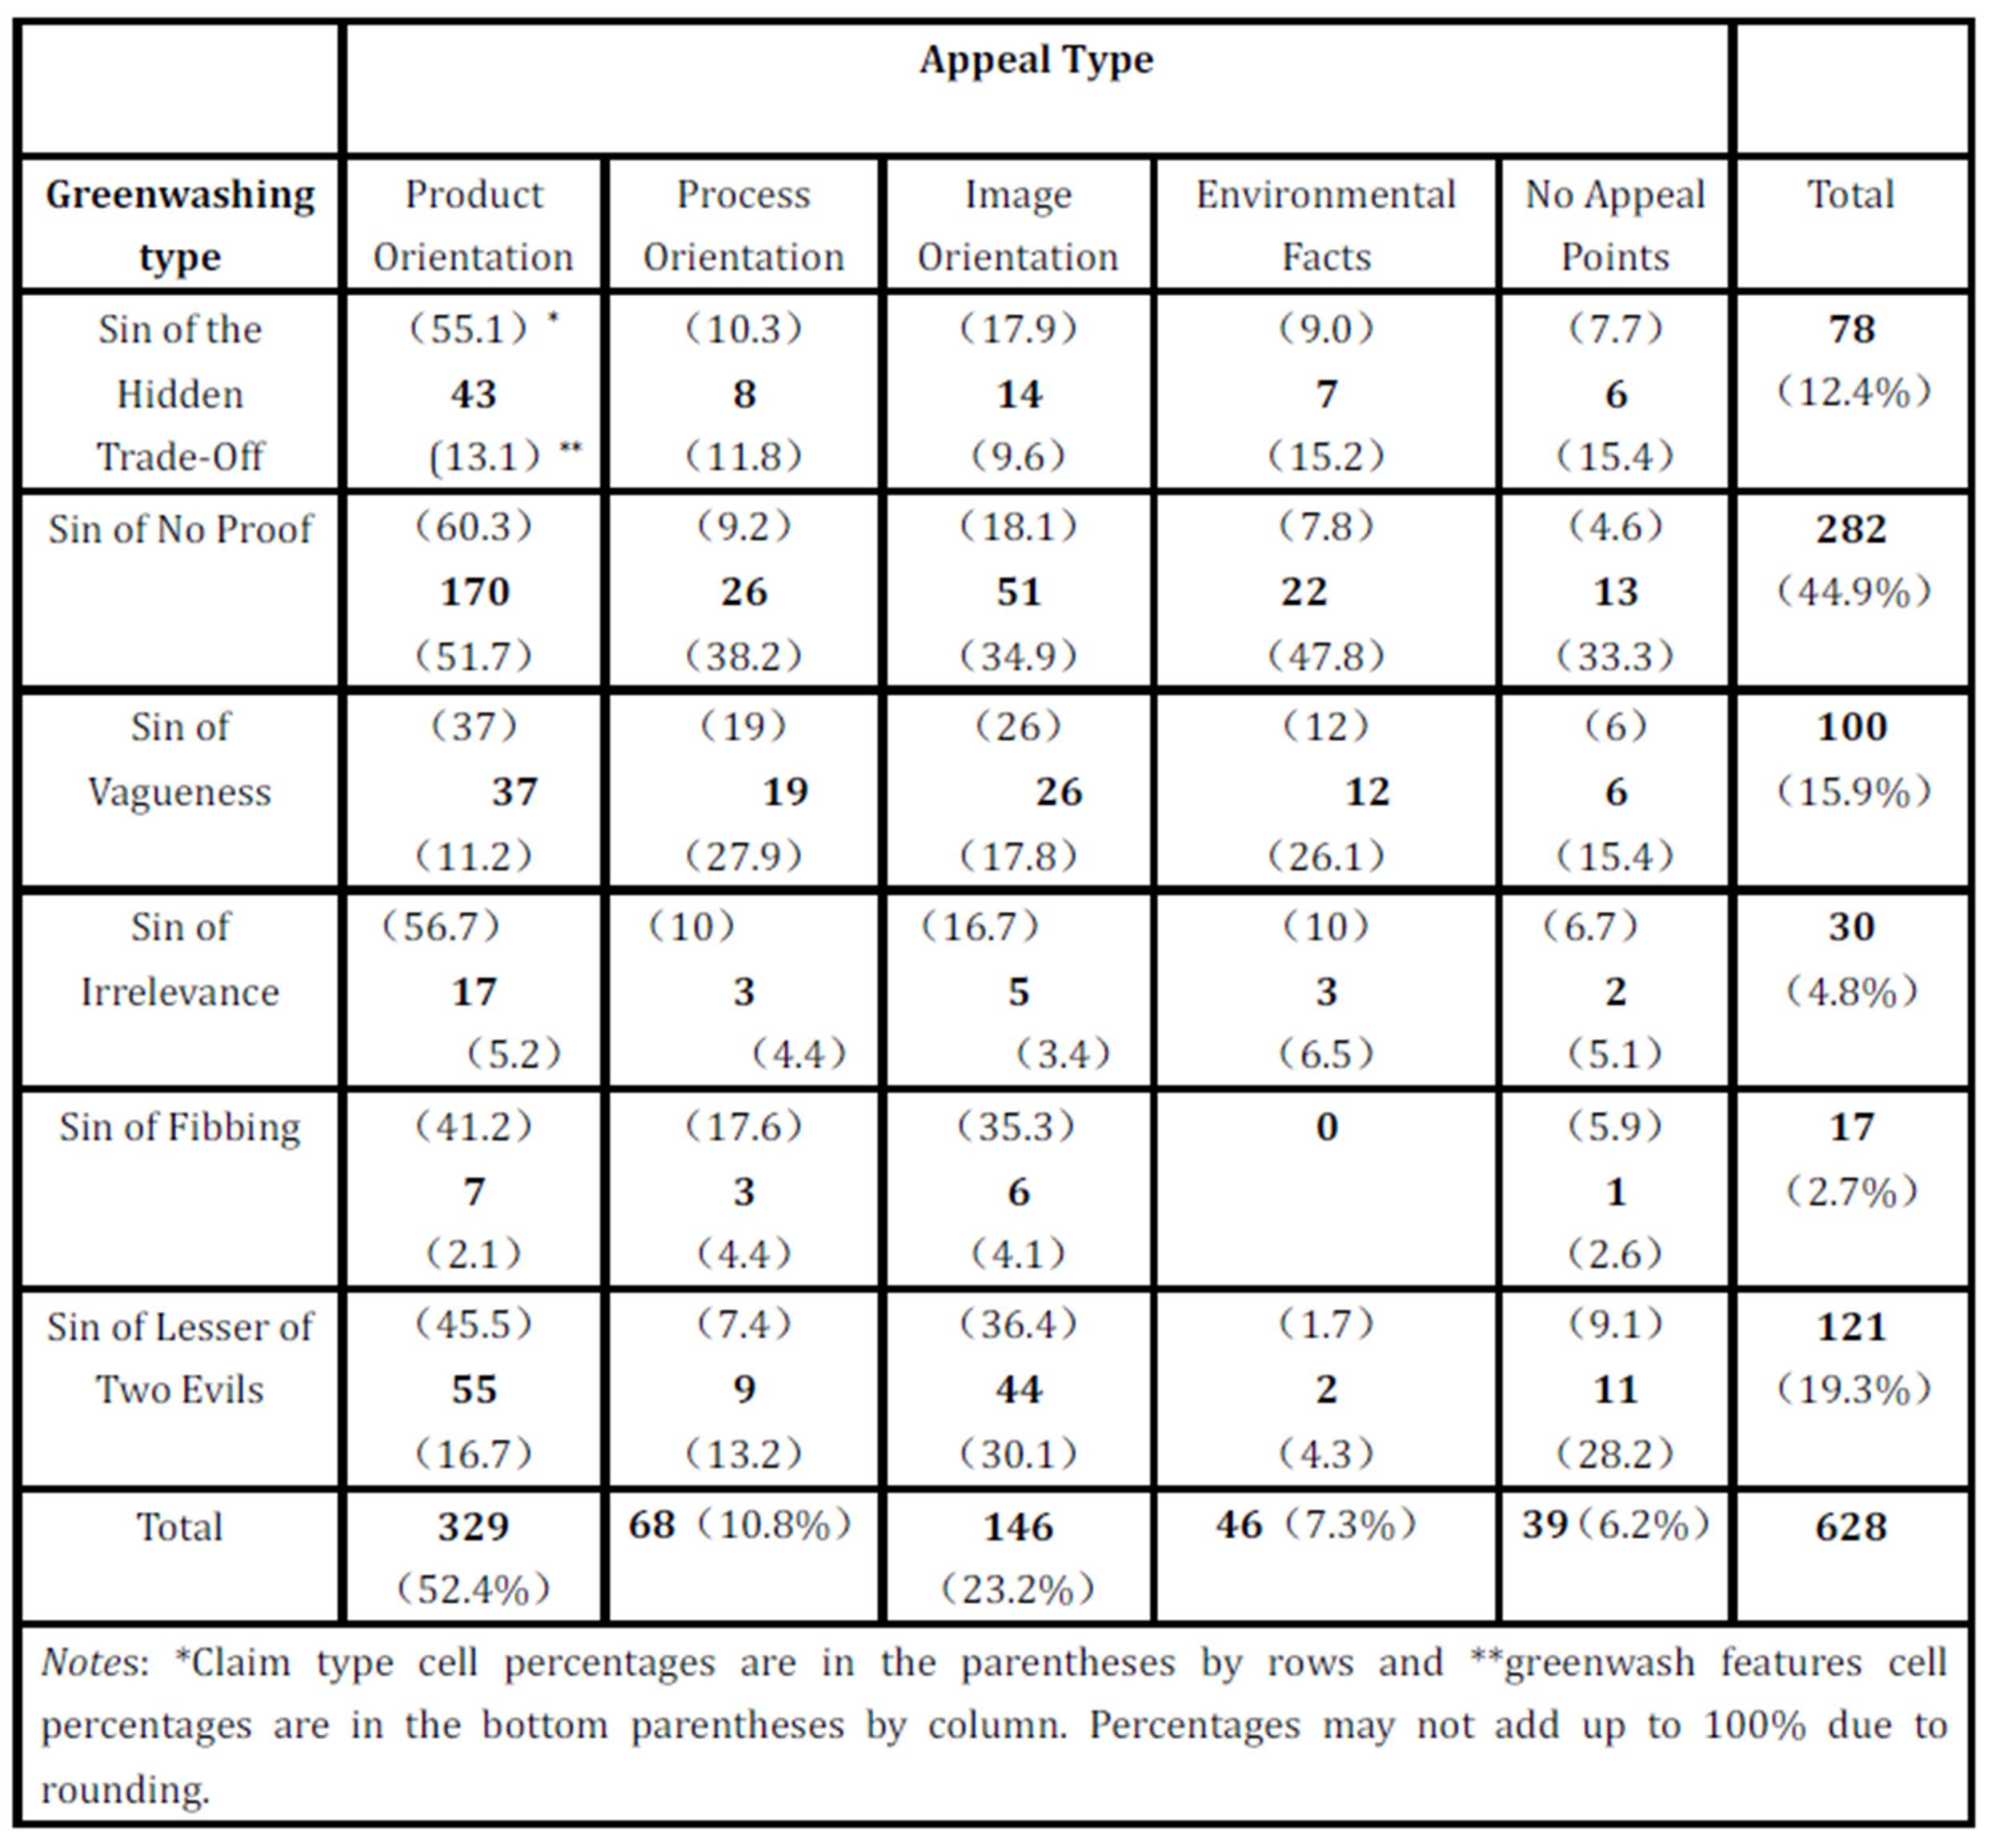
The matrix of greenwashing types and claims distribution in ads is shown in Table 8. Because there was a portion of ads having more than one claim, this resulted in 628 claims. The following analyses were all based on the amount of claims instead of that of ads. In order to validate the difference in greenwashing features, a series of analyses using Chi-square were performed. Overall, in terms of claims, greenwashing advertising promoted more product benefits (n=329) than environmental facts (n=46) (X2=336.6, df=3, p<0.05). Claims attaching more importance to products’ green attributes were more likely to commit the sin of no proof than the sins of irrelevance or fibbing (n=7) (X2=150.1, df=1, p<0.05). The finding is similar when the orientation of claims is not considered, with the sin of no proof the most common (n=282) and the sin of irrelevance (n=30) as well as the sin of fibbing (n=17) the least common (X2=436.7, df=5, p<.005).
Examining the data from the perspective of greenwashing, analyses were performed in terms of prevalence of the sins of no proof, the hidden trade-off and vagueness. Ads that commit more sins of no proof appeared to be more product-oriented with a percentage of 60.3% (n=170) than image-based (n=51, 18.1%), process-based (n=26, 9.2%) and stating environmental facts (n=22, 7.8%) (X2=216.7, df=3, p<0.05). Similarly, claims with the sin of the hidden trade-off were deemed more product-oriented (n=43, 55.1%) than image-oriented (n=14, 17.9%), process-oriented (n=8, 10.3%) and environment-oriented (n=7, 9.0%) (X2=47.89, df=3, p<0.05). The results were basically similar, with ads committing the sin of vagueness (X2=14.51, df=3, p<0.05) with environmental facts weighing more for these ads (12%) when compared to other greenwashing types.
Table 8: Analysis of Advertising Greenwashing Matrix

Discussion
The findings show a few interesting characteristics. While there is an increasing trend of using green advertising in China, these green ads were mainly from manufacturing industries, especially from the local and foreign enterprises. The results showed that from 2000 to 2009 the numbers of domestic green advertisements were increasing steadily. Almost half (48.8%) of the green ads were published by domestic enterprises, 9.9% were published by joint ventures, and 40.8% were published by foreign-owned enterprises. There was a significant difference in the repetition of these advertisements. The green ads from domestic enterprises were frequently repeated, while the ads from foreign enterprises were repeated less and more likely to be new. About two thirds of green ads occupied a half page, full page or folio. It is worth noting that, although green advertisements were large, more than 60% of the advertisements had no relevant picture related to green identity or any green symbolic logo. In total, greenwashing ads accounted for 36.9% of the total sample. Ads committing the sin of no proof accounted for 52.1%, followed by the sin of the lesser of two evils, which accounted for 23%. These ads only promote the concept of greenness, organics or nature, while the actual ecological performance of the product was less often mentioned. Through variance comparison, it can be seen that the Chinese enterprises adopted product strategies, while foreign enterprises adopted a more balanced approach by promoting both the corporate image and products. There are a few reasons that could explain the differences. First, Chinese consumers are pragmatic; they seek product-specific information in advertisements to substantiate their purchase decision instead of corporations’ promises or a narrative of environmental facts (Chan, 1999; Davis, 1994; Chan, 2004). Second, Chinese enterprises are not very advanced in green and environmental technology, and thus not able to advertise their manufacturing processes as green. Third, China is still a developing country facing the challenge of protecting the environment while developing its economy, and enterprises pay more attention to profits than the environment.
When comparing corporations in China and their greenwashing frequency, the findings suggest that domestic enterprises in China to a large extent commit more greenwashing than foreign enterprises. The most prominent feature is the tendency to commit sins of no proof. It is likely that Chinese enterprises are not very advanced in green and environmental technology, hence getting green certification can be a barrier. The results of this study revealed that sins of no proof usually abuse the term “natural” without concrete meaning to support a claim. This perhaps is why Iyer (1993) warned that green advertising was altruism motivated and the objective of organizations or corporations was to lead consumers to believe in green activities.
The Terra Choice Environmental Marketing research firm (2007) investigated the greenwashing of North American products, and they found that the sin of the hidden trade-off is the most common (57%), followed by the sin of no proof (26%), then the sin of vagueness(11%), the sin of irrelevance (4%) and the sin of the lesser of two evils (1%). As that study was based on products, the product orientations of Chinese greenwash ads were compared. The most frequent category is the sin of no proof (more than 51.7%), followed by the sin of the lesser of two evils (16.7%), then the sins of the hidden trade-off and vagueness (respectively 13.1% and 11.2%), while the sins of irrelevance and fibbing are the least common. As foreign enterprises are more advanced in their manufacturing processes, they are likely to mature from the stage of obtaining green certification for their products; therefore their percentage of sin of no proof is expected to be lower than that for the Chinese enterprises.
Implications
This study provides several implications for green advertising researchers and regulators. First, using the classification framework to analyze the practices of Chinese green ads, the study enables researchers to understand and further examine Chinese green advertising development and to monitor green advertising irregularity in China. Second, the study enables future trend tracking of corporate green ad strategies in China with those of other developed countries. The differences and similarities in misleading green advertising provide a reference for the development and improvement of Chinese green advertising regulation.
As for Chinese regulators, the regulation of green advertising policy could be enhanced in the following aspects:
1) Developing a misconduct registry for green advertising and penalizing advertisers for the misleading use of green ads;
2) Strengthening advertising regulation on the certification of green advertising to prevent over-exaggeration and misleading content; and
3) Developing national guidelines and providing training for advertisers, publishers and organizations who intend to enhance their image by means of the green ads.
Regulators should also be aware that green ads are rather dynamic, depending on internal and external forces, and should prepare to monitor greenwashing trends and impose guidelines on good practices (Leonidou et al., 2011). Finally, Chinese regulators can take advantage of existing green regulation from developed countries such as the USA (The Federal Trade Commission, The National Advertising Division), UK (The Department for Environment, Food, and Rural Affairs), Australia (Green Marketing and the Australian Consumer Law) and New Zealand (ASA Code for Environmental Claims) to complement China’s regulatory framework.
Marketers should be aware of the large percentage of greenwashing advertisements discovered in this study. As previous studies indicated that greenwashing advertisements can create skepticism toward green advertising and influence decision making, marketers should ensure that their green advertisements contain sufficient evidence to convince consumers, especially the environmentally concerned individuals (do Paço and Reis, 2012) and avoid further greenwashing to tarnish organizations’ images or product credibility.
In regard to developing China’s green economy, based on the findings, the government needs to formulate incentive strategies to encourage companies to develop genuine green products and green ads and in parallel improve the awareness of environmental protection for consumers. There is an urgent need to control greenwashing and to revise relevant advertising law and regulation in order to achieve a healthy green economy and a socio-ecological system. It should constantly remind all types of enterprises in China that green communication must adhere to business ethics and good practices.
Limitations
The findings of this study must be interpreted with its limitations in mind. First, the samples were selected from printed ads, and there is no investigation of green ads in other media formats such as television, multimedia and video. Second, the current study only investigated the number of green ads in domestic mainstream media; other professional or industry-specific media were excluded. It is recommended that future investigations should conduct a more comprehensive investigation of all types of advertising and of all aspects of the industry in order to generalize the findings and to provide more comprehensive guidance for domestic green advertising practices. Third, the analysis used only the four claim orientations classification proposed by Carlson et al. (1993); other parameters such as non-profit organizations and product life cycle are not considered. It is possible that a more detailed sub-classification may be required to fully capture and analyze the greenwashing advertising in China. Lastly, the timeframe of the study can be extended to reflect and compare with more recent practices. However despite its limitations, this research provides a starting point for future research and a methodology that can be developed to suit the context for investigating China’s green ad activities.
Conclusion
While the study revealed significant differences in the nature of green advertising between local Chinese enterprises and foreign-owned enterprises, there is a need to further understand the motives, strategies and effectiveness of green advertising from the Chinese enterprise perspective. Therefore, future research on green advertising should investigate the reasons behind greenwashing in China, and investigate the responses of consumers to different greenwashing advertising appeals or ad types (corporate advertising or product advertising) to determine the effectiveness of green advertisements. It is also necessary to conduct a larger scale study and investigate the continuing and recent trends in green advertisements in different media and compare with foreign advertising to predict potential greenwashing in advance and to formulate meaningful guidelines for regulatory purposes. Last, classification of green ads can explore the crowdsourcing method to quantify greenwashing advertisements. This will potentially minimize the coding error and provide an authentic evaluation from actual consumers’ perspectives.
Acknowledgments
This project is funded by the National Natural Science Foundation of China under grant number #70902011, #71272126 and the Victoria University of Wellington project #97122. We also acknowledge the assistance of Meixing Jing, Shilan Tong, Juan Huang and Zhu Lu in data collection.
References
1. Albayrak, T., Caber, M., Moutinho, L. & Herstein, R. (2011), ‘The Influence Of Skepticism On Green Purchase Behavior’, International Journal of Business and Social Science, Vol. 2, pp. 189-197.
Google Scholar
2. Banerjee, S., Gulas, C. S. & Iyer, E. (1995), ‘Shades of green: a multidimensional analysis of environmental advertising’, Journal of Advertising, Vol. 24, pp. 21-31.
Publisher – Google Scholar
3. Baum, L. M. (2012), ‘It’s Not Easy Being Green … Or Is It? A Content Analysis of Environmental Claims in Magazine Advertisements from the United States and United Kingdom’, Environmental Communication: A Journal of Nature and Culture, Vol. 6, pp. 423-440.
4. Bazillier, R. & Vauday, J. (2009), ‘The GreenWashing Machine: Is CSR more than communication?’, Document de Recherche du LEO, Vol. 10.
Google Scholar
5. Beder, S. (2002), ‘Environmentalists help manage corporate reputation: Changing perceptions not behaviour’, Ecopolitics: Thought + Action, Vol. 1, pp. 60-72.
Goolge Scholar
6. Bergeson, L. L. (2008), ‘The explosion of green marketing claims: FTC jumps into the fray‘, Environmental Quality Management, Vol. 18, pp. 71-78.
Publisher – Google Scholar
7. Caa. (2009), ‘100 most valuable advertising media’, available at: http://www.cnad.com/html/Article/2009/0227/20090227165506779.shtml (accessed 8 Feburary 2013).
8. Carlson, L., Grove, S. J. & Kangun, N. (1993), ‘A content analysis of environmental advertising claims: A matrix method approach‘, Journal of Advertising, Vol. 22, pp. 27-39.
Publisher – Google Scholar
9. Cciced. (2011), ‘Development Mechanism and Policy innovation of China’s Green Economy, China Council for International Cooperation on Environment and Development Report’, available at: http://www.cciced.net/encciced/policyresearch/report/201205/P020120529371605387628.pdf (accessed 8 Feburary 2013).
10. Chan, R. Y. K. (1999), ‘Environmental attitudes and behavior of consumers in China: Survey findings and implications‘, Journal of International Consumer Marketing, Vol. 11, pp. 25-52.
Publisher – Google Scholar
11. Chan, R. Y. K. (2004), ‘Consumer responses to environmental advertising in China‘, Marketing Intelligence & Planning, Vol. 22, pp. 427-437.
Publisher – Google Scholar
12. Chan, R. Y. K., Leung, T. K. P. & Wong, Y. H. (2006), ‘The effectiveness of environmental claims for services advertising‘, Journal of Services Marketing, Vol. 20, pp. 233-250.
Publisher – Google Scholar
13. Chang, C. (2011), ‘Feeling Ambivalent about Going Green: Implications for Green Advertising Processing‘, Journal of Advertising, Vol. 40, pp. 19-31.
Publisher – Google Scholar
14. Cheah, I. & Phau, I. (2011), ‘Attitudes towards environmentally friendly products‘, Marketing Intelligence & Planning, Vol. 29, pp. 452-472.
Publisher – Google Scholar
15. Cone. (2009), ‘2009 Consumer Environmental Survey’, available at: www.coneinc.com/content2030 (accessed 8 Feburary 2013).
16. Cone. (2012), ‘Cone green gap trend 2012’, available at: http://www.conecomm.com/2012-cone-green-gap-trend-tracker (accessed 8 Feburary 2013).
17. Davis, J. J. (1994), ‘Consumer response to corporate environmental advertising‘, The Journal of Consumer Marketing, Vol. 11, pp. 25-37.
Publisher – Google Scholar
18. Delmas, M. A. & Burbano, V. C. (2011), ‘The Drivers of Greenwashing’, California Management Review, Vol. 54, pp. 64-87.
Publisher – Google Scholar
19. Do Paço, A. M. F. & Reis, R. (2012), ‘Factors Affecting Skepticism toward Green Advertising‘, Journal of advertising, Vol. 41, pp. 147-155.
Publisher – Google Scholar
20. Greendex. (2012), ‘Greendex 2012: Consumer Choice and the Environment—A Worldwide Tracking Survey’, available at: http://images.nationalgeographic.com/wpf/media-content/file/GS_NGS_2012GreendexHighlights_10July-cb1341934186.pdf (accessed 8 Feburary 2013).
21. Guo, F., Chen, K. & Wang, X. (2011), ‘Analysis of the academic research on green marketing in China’, IEEE International Conference on Business Management and Electronic Information (BMEI), 13-15 May 2011, Guangzhou, China pp. 776-779.
22. Iyer, E. & Banerjee, B. (1993), ‘Anatomy of green advertising’, Advances in Consumer Research, Vol. 20, pp. 494-501.
Google Scholar
23. Kilbourne, W. E. (1995), ‘Green advertising: Salvation or oxymoron?’, Journal of Advertising, Vol. 24, pp. 7-19.
Publisher – Google Scholar
24. Kronrod, A., Grinstein, A. & Wathieu, L. (2012), ‘Go Green! Should Environmental Messages Be So Assertive?‘, Journal of Marketing, Vol. 76, pp. 95.
Publisher – Google Scholar
25. Laufer, W. S. (2003), ‘Social accountability and corporate greenwashing’, Journal of Business Ethics, Vol. 43, pp. 253-261.
Publisher – Google Scholar
26. Lee, Y. H. & Ang, K. S. (2003), ‘Brand name suggestiveness: a Chinese language perspective‘, International Journal of Research in Marketing, Vol. 20, pp. 323-335.
Publisher – Google Scholar
27. Leonidou, L. C., Leonidou, C. N., Palihawadana, D. & Hultman, M. (2011), ‘Evaluating the green advertising practices of international firms: a trend analysis’, International Marketing Review, Vol. 28, pp. 6-33.
Publisher – Google Scholar
28. Li, X. (2010), ‘Communicating the “incommunicable green”: A comparative study of the structures of desire in environmental advertising in the United States and China’. PhD, The University of Iowa.
29. Liu, F. 2007. A study to regulations and developments of advertising in China, Beijing, China Industry and Commerce Press, 2007.
30. Munshi, D. & Kurian, P. (2005), ‘Imperializing spin cycles: A postcolonial look at public relations, greenwashing, and the separation of publics’, Public Relations Review, Vol. 31, pp. 513-520.
Publisher – Google Scholar
31. Perreault, W. D., Jr. & Leigh, L. E. (1989), ‘Reliability of Nominal Data Based on Qualitative Judgments’, Journal of marketing research, Vol. 26, pp. 135-148.
Publisher – Google Scholar
32. Responsibility, B.-B. F. S. (2009), ‘BSR-Futerra Report Helps Companies Rise Above the Noise of Greenwash’, available at: http://www.csrwire.com/press_releases/27461-BSR-Futerra-Report-Helps-Companies-Rise-Above-the-Noise-of-Greenwash (accessed 8 Feburary 2013).
33. Schmitt, B. H., Pan, Y. & Tavassoli, N. T. (1994), ‘Language and Consumer Memory: The Impact of Linguistic Differences between Chinese and English‘, Journal of Consumer Research, Vol. 21, pp. 419-431.
Publisher – Google Scholar
34. Shields, T. & Zeng, K. (2012), ‘The Reverse Environmental Gender Gap in China: Evidence from “The China Survey”*‘, Social Science Quarterly, Vol. 93, pp. 1-20.
Publisher – Google Scholar
35. Sourthern. (2012), ‘2011 Greenwash Hall of Shame’, Sourthern Weekly. available at: http://www.infzm.com/topic/2011plb.shtml
36. Tan, B.-C. & Yeap, P.-F. (2012), ‘What Drives Green Restaurant Patronage Intention?‘, International Journal of Business and Management, Vol. 7, pp. 215-223.
Publisher – Google Scholar
37. Terrachoice. (2007), ‘The ‘Six sins of greenwashing”, available at: http://www.terrachoice.com/files/6_sins.pdf (accessed 8 Feburary 2013).
38. The Association of China Advertising 2012. The Almanac of China Advertising, Beijing: Xinhua Press 2012.
39. Wagner, E. R. & Hansen, E. N. (2002), ‘Methodology for evaluating green advertising of forest products in the United States: A content analysis’, Forest Products Journal, Vol. 52, pp. 17-23.
Google Scholar
40. Wang, F. (2010), ‘China’s Population Destiny: The Looming Crisis ‘, available at: http://www.brookings.edu/research/articles/2010/09/china-population-wang.
41. Wong, E. (2013), ‘China Lets Media Report on Air Pollution Crisis’, The New York Times.