Introduction
The recent years have witnessed a revolutionary development in mobile technologies. The development has involved the hardware, software, and network communications. Therefore, leaders of mobile technologies like mobile device manufacturers and mobile services/apps developers compete to attract the increasingly growing wide section of mobile users to fulfill their demands.
According to the statistics published by eMarketer (2014), the number of Smartphone users will exceed 2 billion in 2016 (the year of this research) worldwide with increasing percentage of 3.5% as of 2015. The expectations say that in the year 2017, the number of Smartphone users may reach around 2.38 billion, with an increasing percentage of 3.1% compared to 2016. In the year 2018, the number is expected to increase up to 2.6 billion. For more assertion, the number of Smartphone users and the increasing percentages published by the eMarketer conform to the statistics published by “statista” (2013) for the same purpose.
Mobile services, from a practice point of view, play a primary role in mobile users’ daily-life processes. Task scheduling, social networking, game playing, Internet browsing, and so many others are examples of mobile users’ daily tasks. In this paper, the term “mobile service” will be used, from a software development perspective, to point to any application that could be executed on a mobile device. The concept of mobile service, however, could be defined differently in the research community but typically is understood as the service that makes use of mobile devices and/or mobile network as mentioned by Smura T. et al (2009).
Utilizing mobile services to the maximum level is a significant objective to the developers of services. In practice, this will help developers to collect reported errors and discover bugs in these services; thus further enhancements could be performed. The levels of practice skills and amount of user’s experience, acquired from executing mobile services, depend on several factors. The list of these factors may include, but not limited to, the fitness degree of mobile service to the user demands, usage experience, popularity of mobile service (e.g. according to users rating), user familiarity to the device she/he is using (Ristola A. et al (2005)), and the lack of user trust in mobile services especially when financial issues are encountered as pointed to by Gao L. and Waechter K., (2015). More factors have been addressed by Sarmento T. and Patrício L. (2014).
Several research papers have been published which investigate the different relevant aspects and factors affecting human-(mobile device) interaction. Some researchers studied the effects of human behavioral factors on the use of mobile devices and mobile services. Ristola A. et al (2005), the authors study how the mobile devices and the initial trial time used affect the initial mobile service usage experience, then how this experience affects the probability of continuous usage. The research assured that the familiarity of the mobile device used in the performed tests had a significant impact on the experience of use.
The research conducted by Rawal B. et al (2014) focus on measuring the quality of mobile-phone services. According to the exploratory factor analysis performed, it was found that reliability, perceived network quality, convenience and empathy, and affordability are all factors of service quality. All these factors, however, affect the experience and usage of mobile services. The behavior of mobile users toward energy consumption has been studied by Heikkinen M. et al (2012). The research comes to the results that mobile users need more knowledge and detailed information about energy consumption. In addition, their research demonstrates that mobile users need to understand the way in which the mobile applications can consume the mobile battery and how they can affect that amount of consumption.
A quantitative study of mobile service experience has been presented by Sarmento, T. and L. Patrício (2012). A measurement model has been constructed for the factors of users’ experience. The study emphasized the impacts of some mobile experience factors like awareness, availability, ease-of-use, and usefulness on experience outcomes such as emotions, attitudes, and social self-concept. The research inspires constructing a measurable model for the effects of mobile users’ knowledge of platform to service utilization; thus usage experience.
Our research concentrates on the knowledge of mobile users about the platform of mobile devices and its relevance to user experience. To our knowledge, no previous research studies have studied this aspect as most of them focus on the user experience itself (see Park J. et al (2013-a) and Park J. et al (2013-b)). We argue that mobile users who have a specific level of knowledge to the platform of their mobile devices attain more experience in using mobile services; in this way, they achieve better service utilization, than those mobile users who have low knowledge levels. This research investigates the relationship between platform knowledge and the best utilization of mobile services. For this purpose, statistical study and hypothetical model are constructed and analyzed in order to measure this knowledge and study its impact on mobile services utilization. We are motivated by the unprecedented usage of mobile devices by users at all ages, and the goal of inspecting how to enhance users’ experience in using mobile services the best way.
The paper is organized in seven sections as follows: Section two presents some terminologies and key concepts that pave the road for the study details and discussions. Section three presents a conceptual model to depict the relationships between mobile users, mobile services and mobile platform. In section four, an analytical discussion is made for mapping the hypothesis of study to the measurement quantities. Section five presents the methodology of data collection and analysis. In section six, an analytical study is presented to demonstrate the research findings. Finally, section seven concludes and suggests some future works.
Terminologies and Key Concepts
This section paves the road and puts readers in the context of the study’s main idea. The following terminologies and key concepts have been defined from our perspective so they will serve in an appropriate way the purpose of this research:
- Mobile service is any online or offline application or partial autonomous application functionality that runs on a mobile device. Even though no single definition for “mobile service” attains the consent of software development and information technology communities, the definition above is put to spin most of the other definitions.
- Mobile service platform is the set of hardware (CPU, RAM, Storage, Battery, etc.), Operating System (OS), and any necessary software that is required to execute mobile services. The minimum requirements the users’ mobile devices must have to run services and apps in the best way, explain partially some aspects of mobile platforms. Some mobile services, however, have high or total dependency on other services to complete their functionality.
- The utilization of a mobile service is the maximal benefit that a mobile user attains from using that service according to the service developer’s objectives. As an entity, utilization could be weighed qualitatively from the perspective of mobile users themselves. In this research, utilization will be referred to as a quantitative entity for measurement purposes.
- The keyword knowledge will be used to point out to the amount of mobile user’s cognizance of the mobile device she/he owns. The purposed knowledge includes the awareness of user to mobile platform hardware specifications, and the recognition of the very basic and advanced features of the mobile OS and its functionalities.
- Mobile user experience will be defined, in context of mobile service utilization, as the capability level of the user to make use of all mobile service features in the best way. Though, it has been shown in the study by Park, J. et al (2013-a), that there is no universal definition of user experience.
The following sections consolidate these concepts and terms to formulate a conceptual model. Therefore the importance of knowledge and its relationship to service best utilization are better emphasized.
A Conceptual Model for Utilization Entities Inter-Relationships
The utilization of mobile services has a strong relevance to users’ knowledge concerning mobile platform. To achieve (or getting close to) the maximal level of utilization, users need to have a specific level of experience of how to deal with mobile platform. Many mobile users, however, execute many mobile services and apps without much anxiety regarding the platform on top of which these services and apps are executed. While this lack-of-knowledge affects negatively the utilization of mobile services, many other factors can lead, in total, to poor utilization, such as (unawareness of mobile user to her/his actual needs).
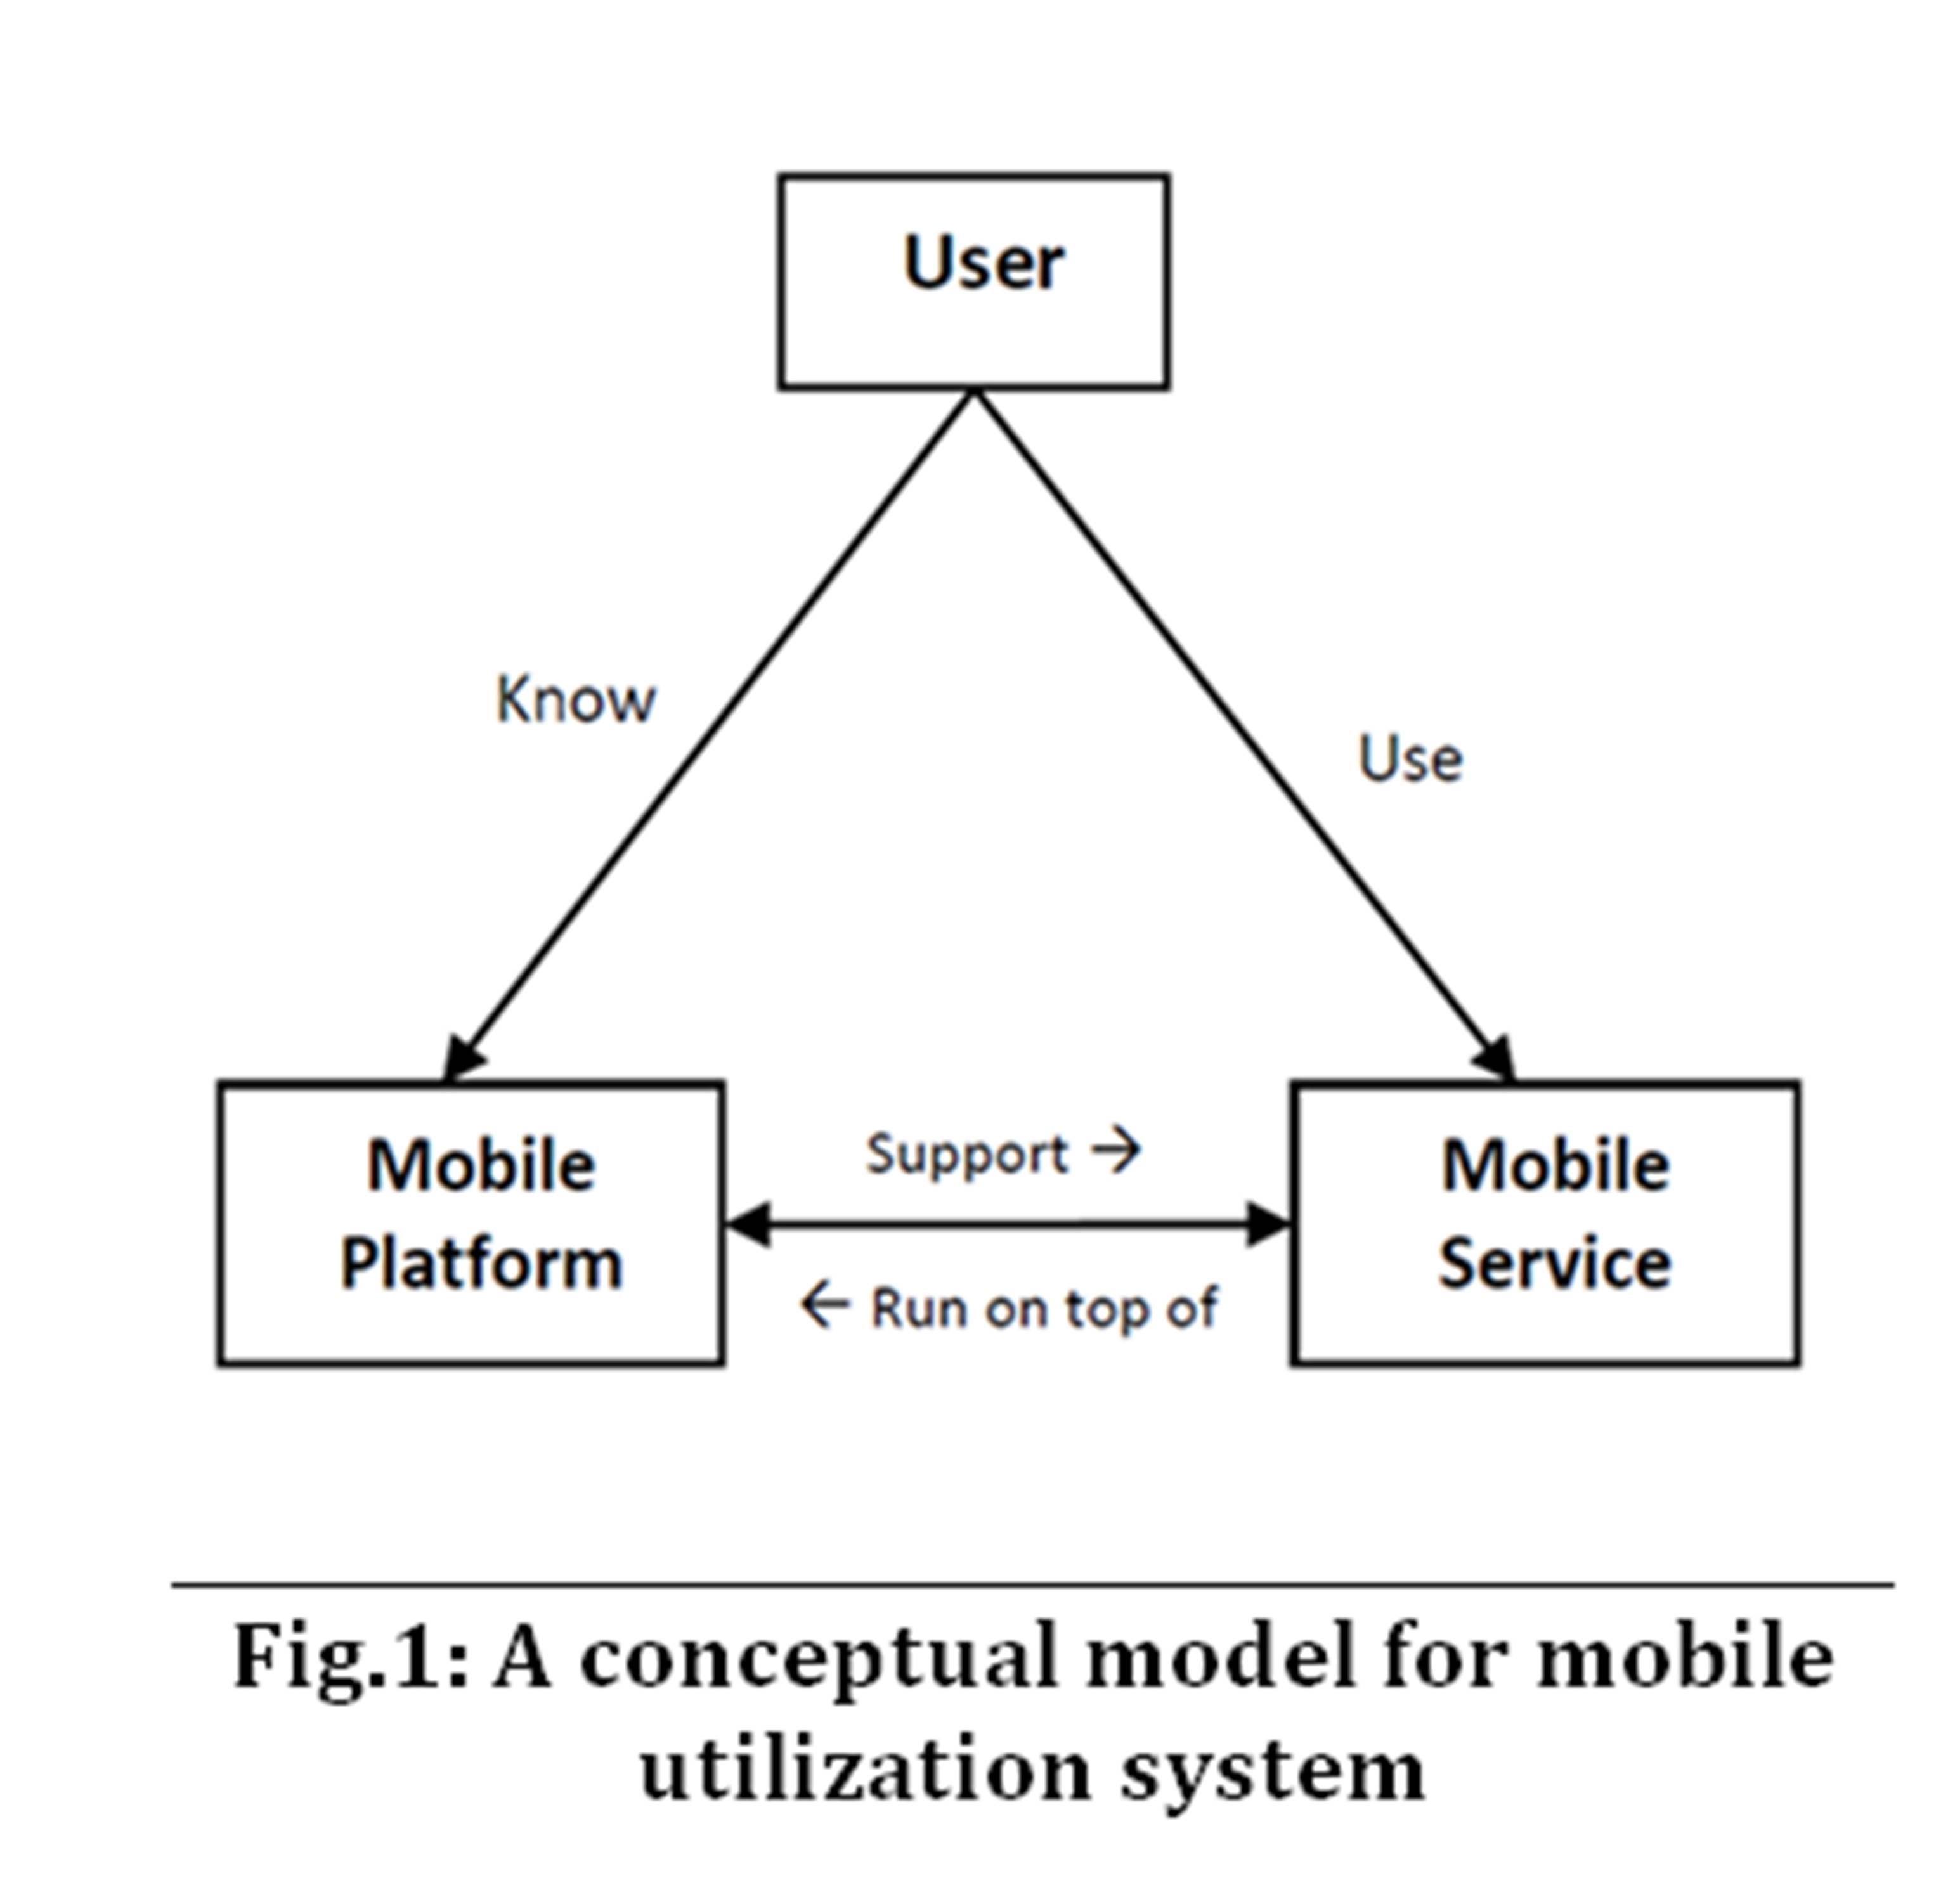
This section presents a conceptual model to capture, for better discussion, the relationships between the main utilization entities; the user, the mobile service, and the mobile platform. These (inter-) relationships form the triangle shown in Fig.1.
The blocks at the triangle vertices are the main entities that communicate in a harmony to form mobile utilization. Each edge in the triangle forms a relationship. The User-Service (edge) points out to the relationship between mobile user and mobile service. From a utilization point of view, this relationship simply means that the mobile user can execute and use mobile services. The knowledge of the user to mobile platform, however, is a primary factor to determine whether she/he is using a mobile service to maximum utilization.
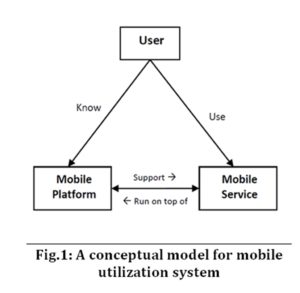
The edge connecting the user and the mobile platform entities forms another relationship. The User-Platform relationship represents what knowledge level the user has to mobile platform. Once the user’s experience of platform management increases, she/he will get a better exploitation of the mobile services; thus, results in better utilization.
The last edge connects mobile services with the mobile platform on which these services are executed. Going further in the relationship represented by this edge is out of this research scope.
The separation shown in Fig.1 between mobile service and mobile platform comes from the fact that the same mobile service can be executed on several mobile platforms.
Hypothesis Set and the Quantities’ Measurement
To emphasize the relationships between entities of the study, this section presents the assumptions and hypothesis that are coined to construct a measurable quantity model. The quantity model is, in essence, the result of mapping these assumptions and hypothesis (discussed below) to a mathematical equation model.
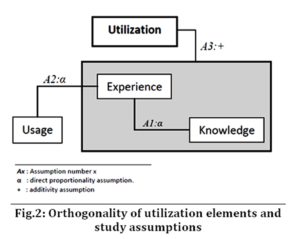
Inspecting deeply the relationships depicted in Fig.1, the following assumptions have been made:
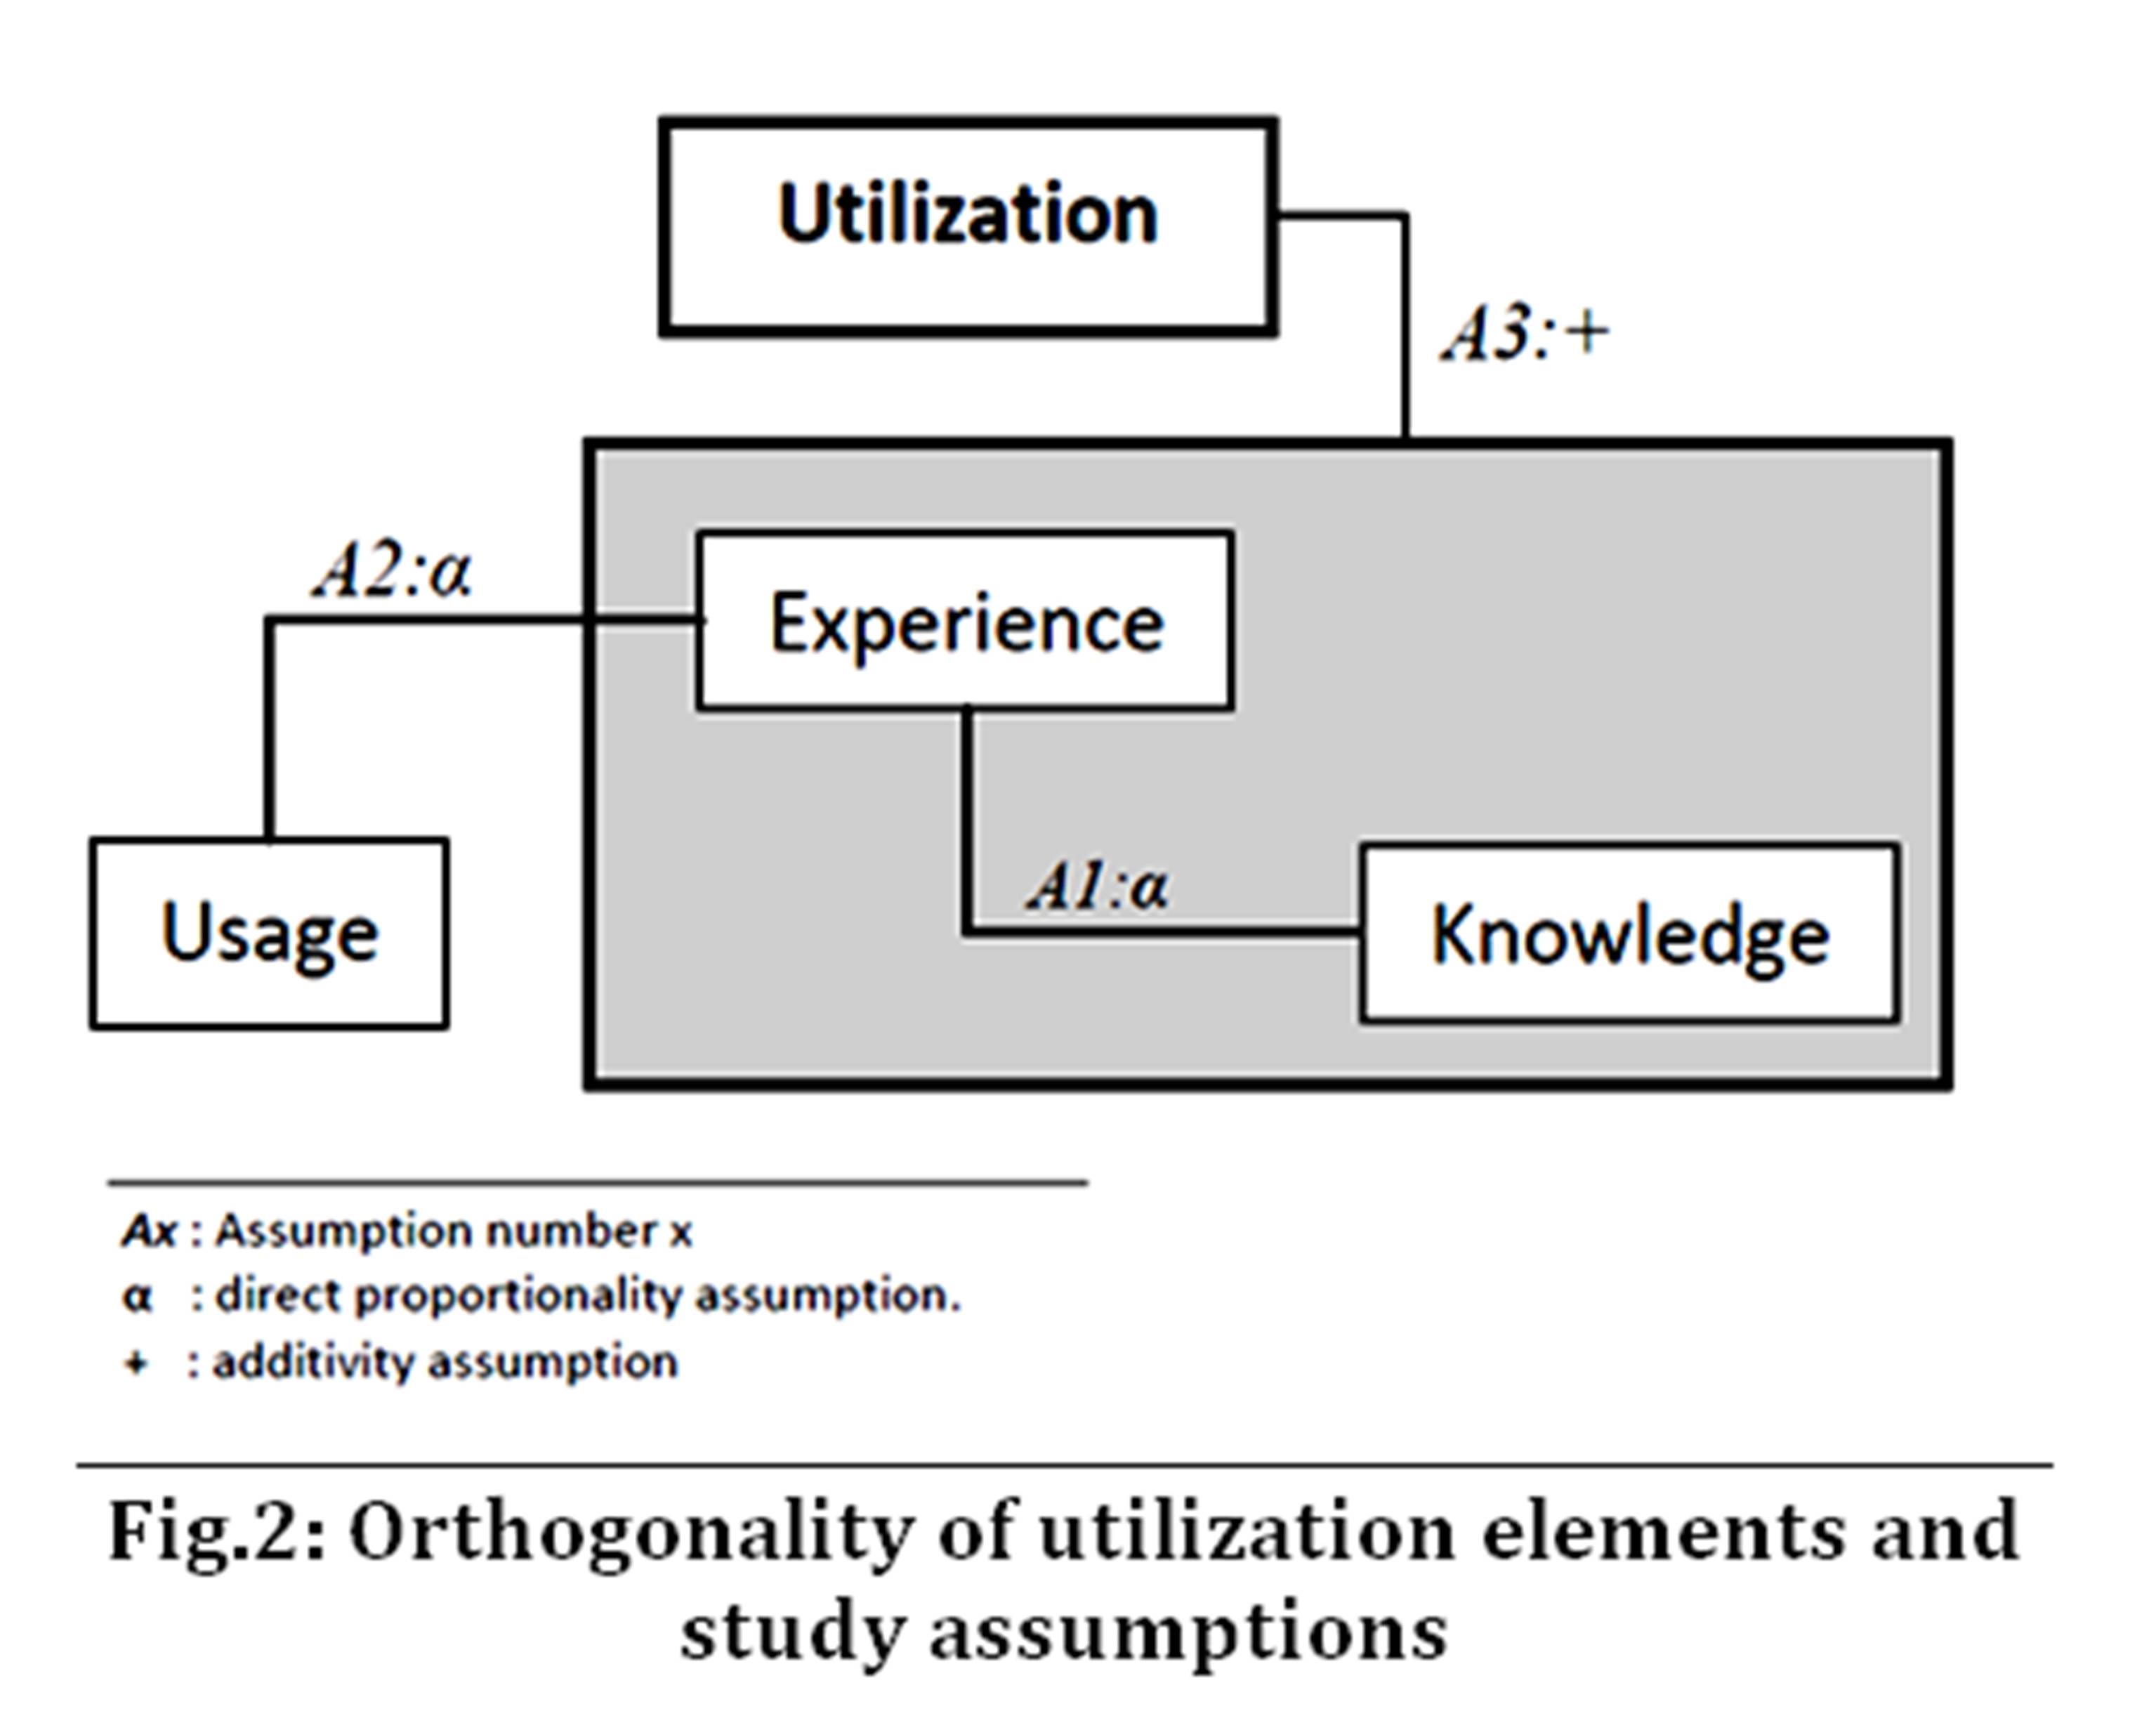
Assumption 1: There is a direct proportion between mobile service, usage experience, and the mobile user knowledge of mobile platform.
Assumption 2: The experience of mobile user to utilize mobile services in the best way has a direct proportion to mobile service usage.
The first assumption could be represented formally as depicted in formula (2), while the second one is represented in formula (1). It is worthy to notice that both assumptions say nothing about the time of use. In other words, mobile users’ knowledge and usage experience are considered without taking into account the time of use; since attaining experience in most cases is a user-skillful dependent issue rather than time-relevant factor (Ristola A. et al (2005)).
Kn α Exp (1)
Where:
Kn — user knowledge to mobile platform.
Exp — user experience in using mobile services.
Exp(si) α Usg(si) (2)
Where:
Exp — mobile user experience to mobile service si.
Usg — the usage of mobile service si.
The two assumptions above consider service utilization with the dependent variables of knowledge, usage, and experience need to be studied deeply. However, another assumption to combine these variables (so that a clear relationship between “utilization elements” is created) can be formulated as follows:
Assumption 3: The utilization of a specific mobile service is the amount of experience a user attains due to mobile service use, plus the amount of knowledge to mobile device platform she/he has.
This assumption could be reformulated mathematically as:
Ut(si)= Exp(si) + Kn (3)
Then, the null hypothesis we argue about in this research is formulated as follows:
Hypothesis-0 (H0): All mobile users who have the knowledge to mobile platform have, by necessity, experience in using mobile services better than those users who do not have the same (i.e. less) level of knowledge.
Talking quantitatively, the null hypothesis stipulates that mobile users who have the knowledge to mobile platform should have utilization values, according to equation (3), larger than mobile users whom knowledge is relatively low. While this hypothesis seems to be axiomatic, a real attestation must be provided (e.g. mathematically or statistically) to prove its credibility.
To sum up the relationships between the main elements of mobile services utilization, Fig.2 demonstrates these relationships orthogonal to the aforementioned assumptions.
Data Collection and Study Methodology
In order to verify the assumptions made previously, a survey instrument has been used. The survey is divided into two main parts; the first one asks the participants about some demographic information, education levels, and basic information about the mobile devices they are currently using. The second part is a questionnaire, which asks the participants 26 questions. All questions are generic and unbiased with respect to specific mobile service or mobile platform.
The questions are grouped into three categories according to the mobile utilization model discussed above. The three categories are: the users’ knowledge to mobile platform (10 questions), their experience of using mobile services (8 questions), and the way how mobile services are used (usage) (8 questions). For experience category, questions mainly measure some of the user experience elements suggested by Park J. et al (2013-b) like usability and affect value. Each question has four choices scaled on a 4-rank meter (4 to 1); as 4 to indicate (excellent) down to 1 to point to (don’t know). The ranks of questions are used as weights for calculating quantities of utilization for each participant. The four-option answer is enough to measure, and then obtains, the participant’s qualification with respect to the aim of the question. In addition, the four-option answers do not exceed the discriminative capacity of the subject of study as concluded by Luis M. et al (2008)
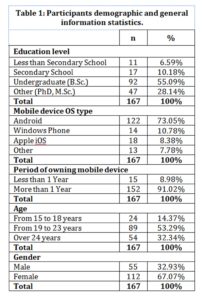
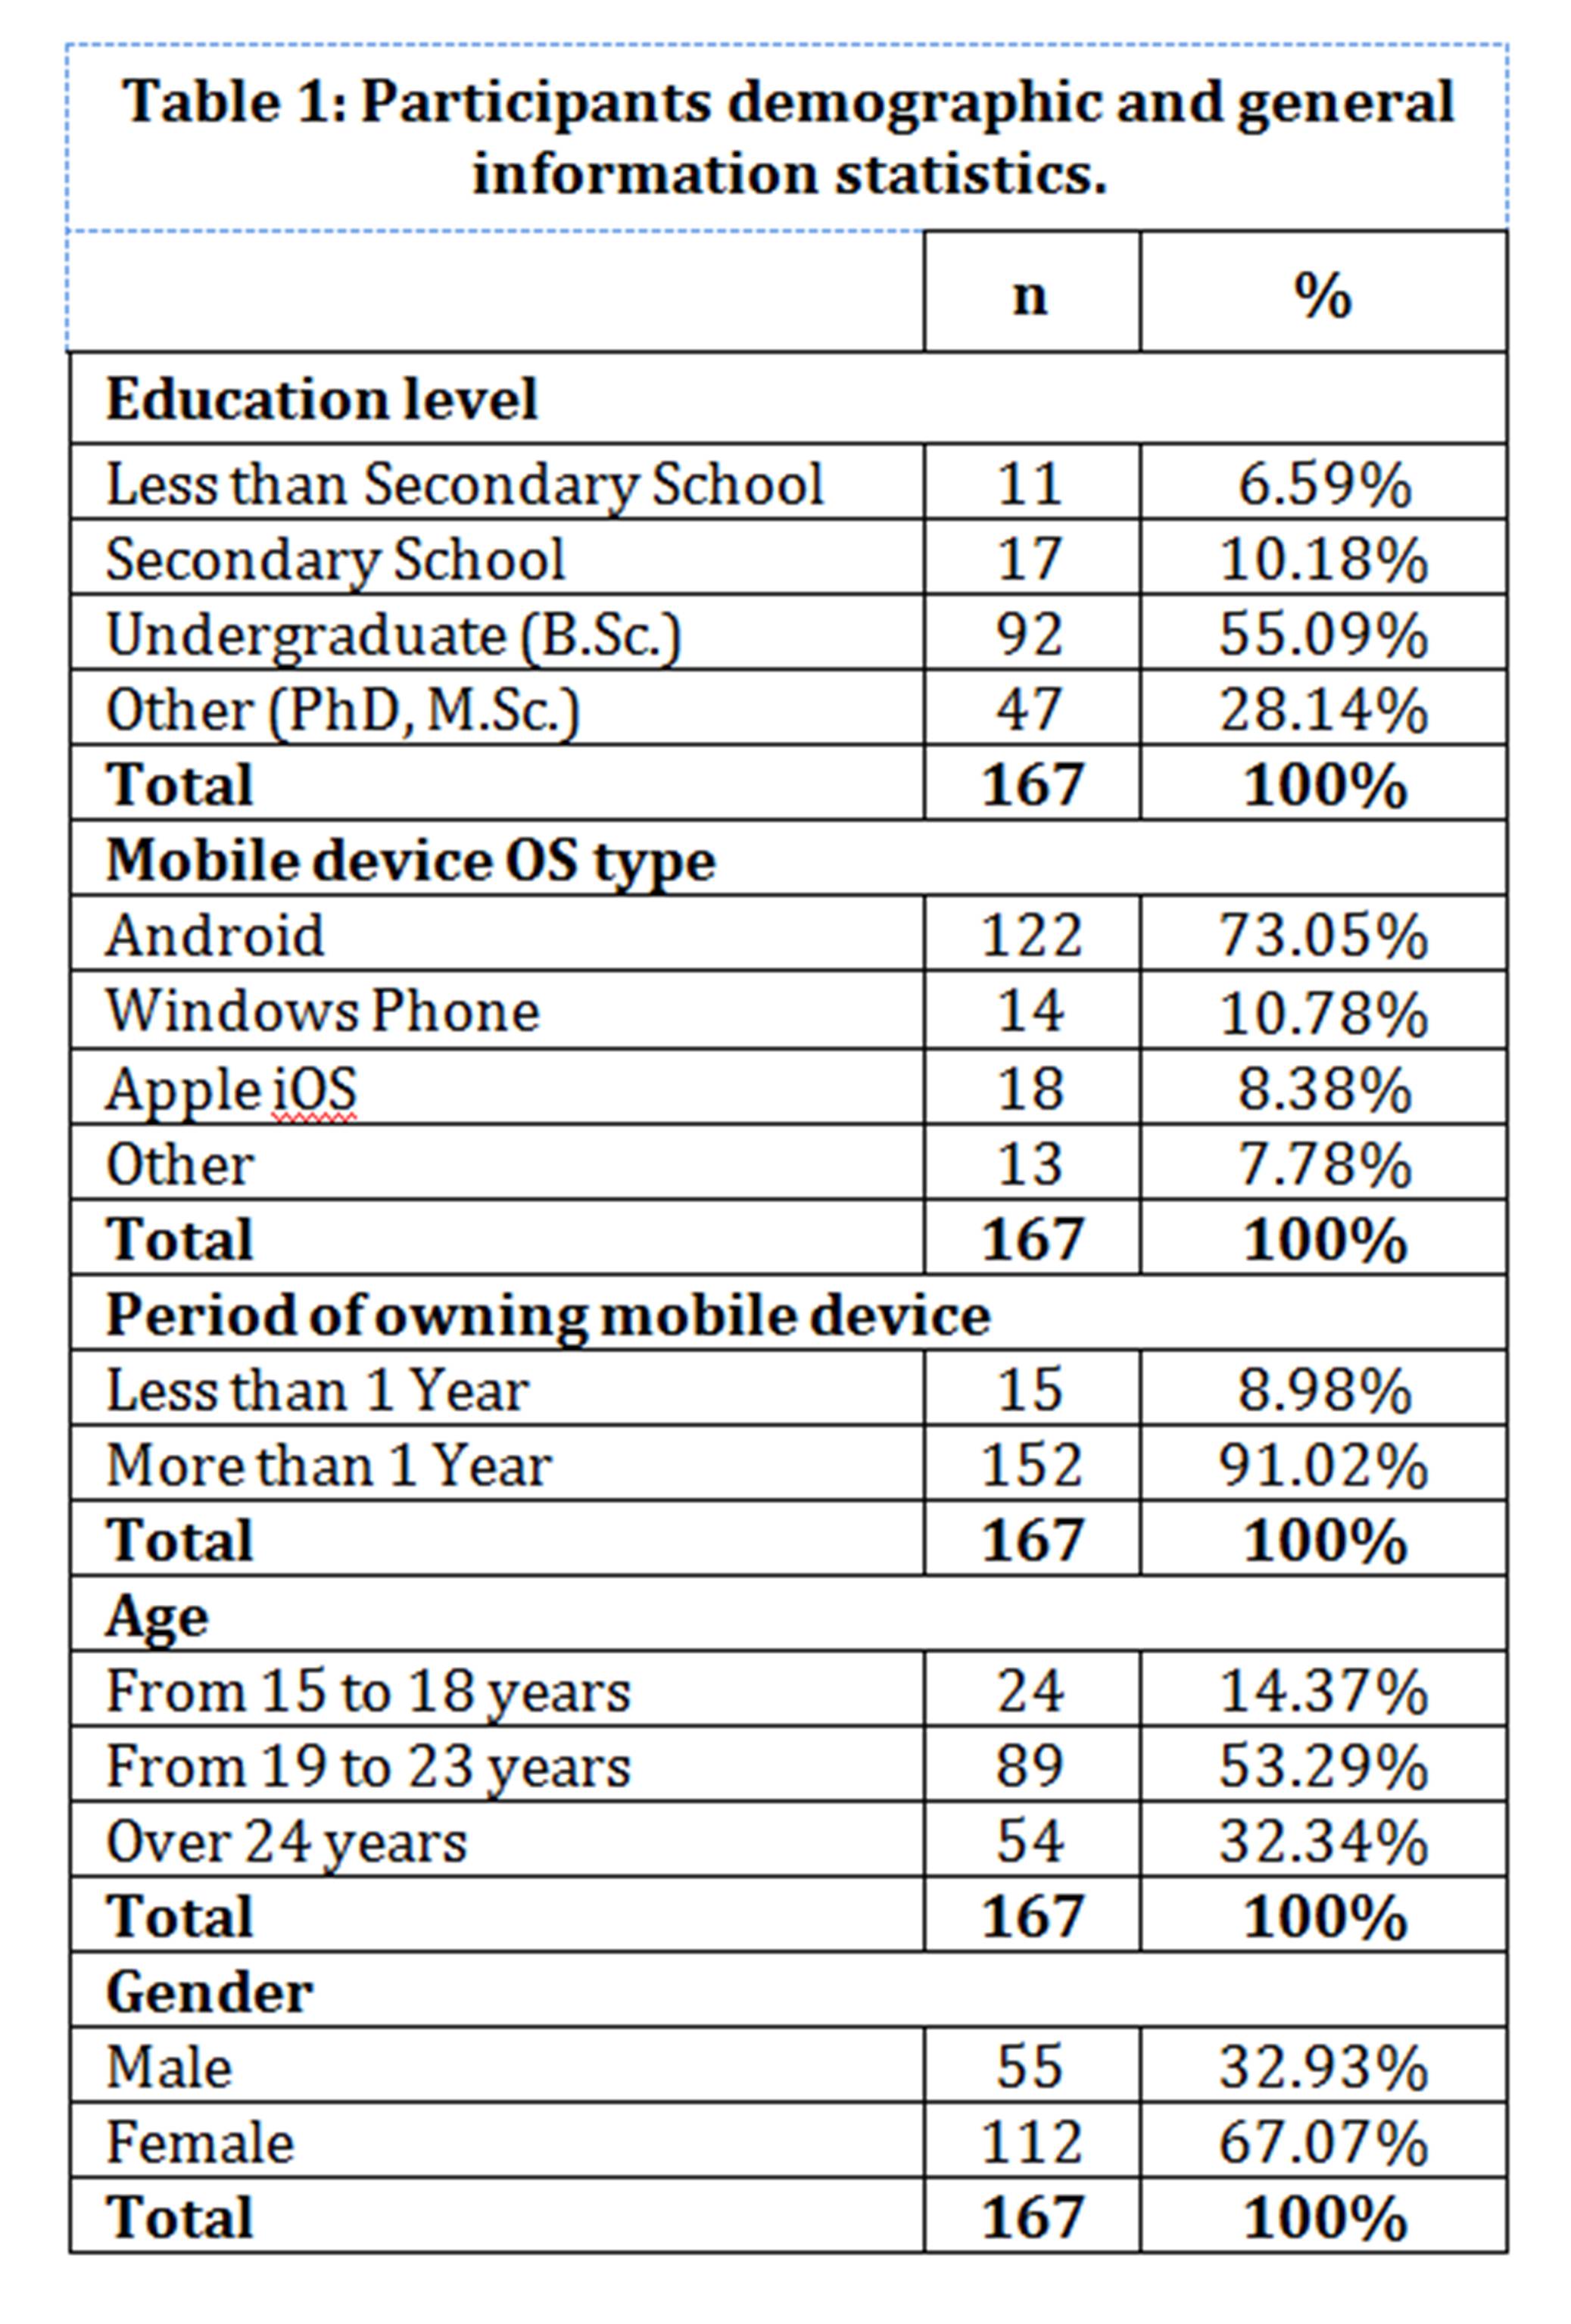
The survey targets 167 participants who are grouped according to age, educational level, gender, period of mobile device owning, and mobile device OS type criteria. Table 1 illustrates the distribution of participants according to these criteria. As shown in the table, most of the participants are undergraduate students with the percentage of 55.09%. We aim to target this type of participants on purpose; since they are most likely to own and deal with mobile devices, and exercise different mobile services. Another important criterion need to be discussed is the mobile device OS type. The mobile OS types listed are those of the most popular platforms. However, the choice “Other” points to any other non-listed OS. It is obvious that most participants are familiar with “Android” with percentage 73.05%; this familiarity may come from the ease of use, and the variety of mobile devices manufactured to operate by “Android”.
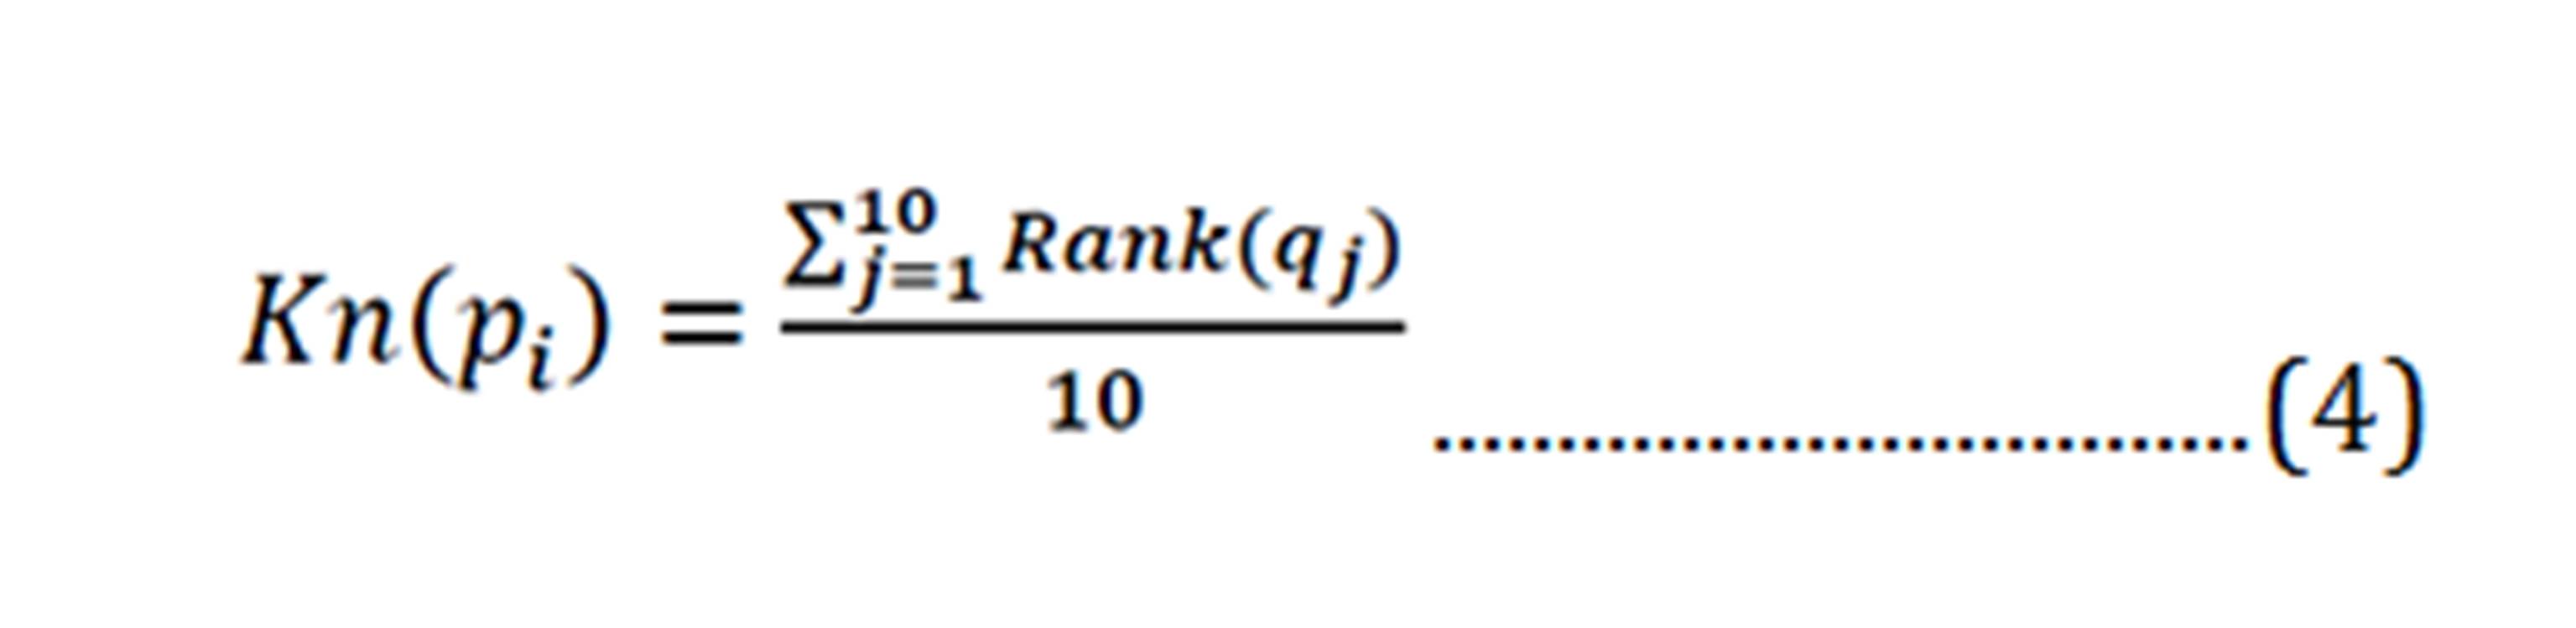
The weights of participants’ answers are used to calculate the amounts of the three main quantities of mobile services utilization (represented in equations 1, 2, and 3). In order to calculate the amount of so-called “knowledge quantity”, the average of weights of knowledge questions for each participant are computed. Mathematically, this amount is calculated according to the following equation:
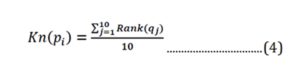
Where:
pi— participant number i.
qj— question number j.
Rank — is the rank value of question qj.
The equation results in a value between 1.0 and 4.0; where the value of 1.0 indicates the lowest level of knowledge and the value of 4.0 indicates the highest level.
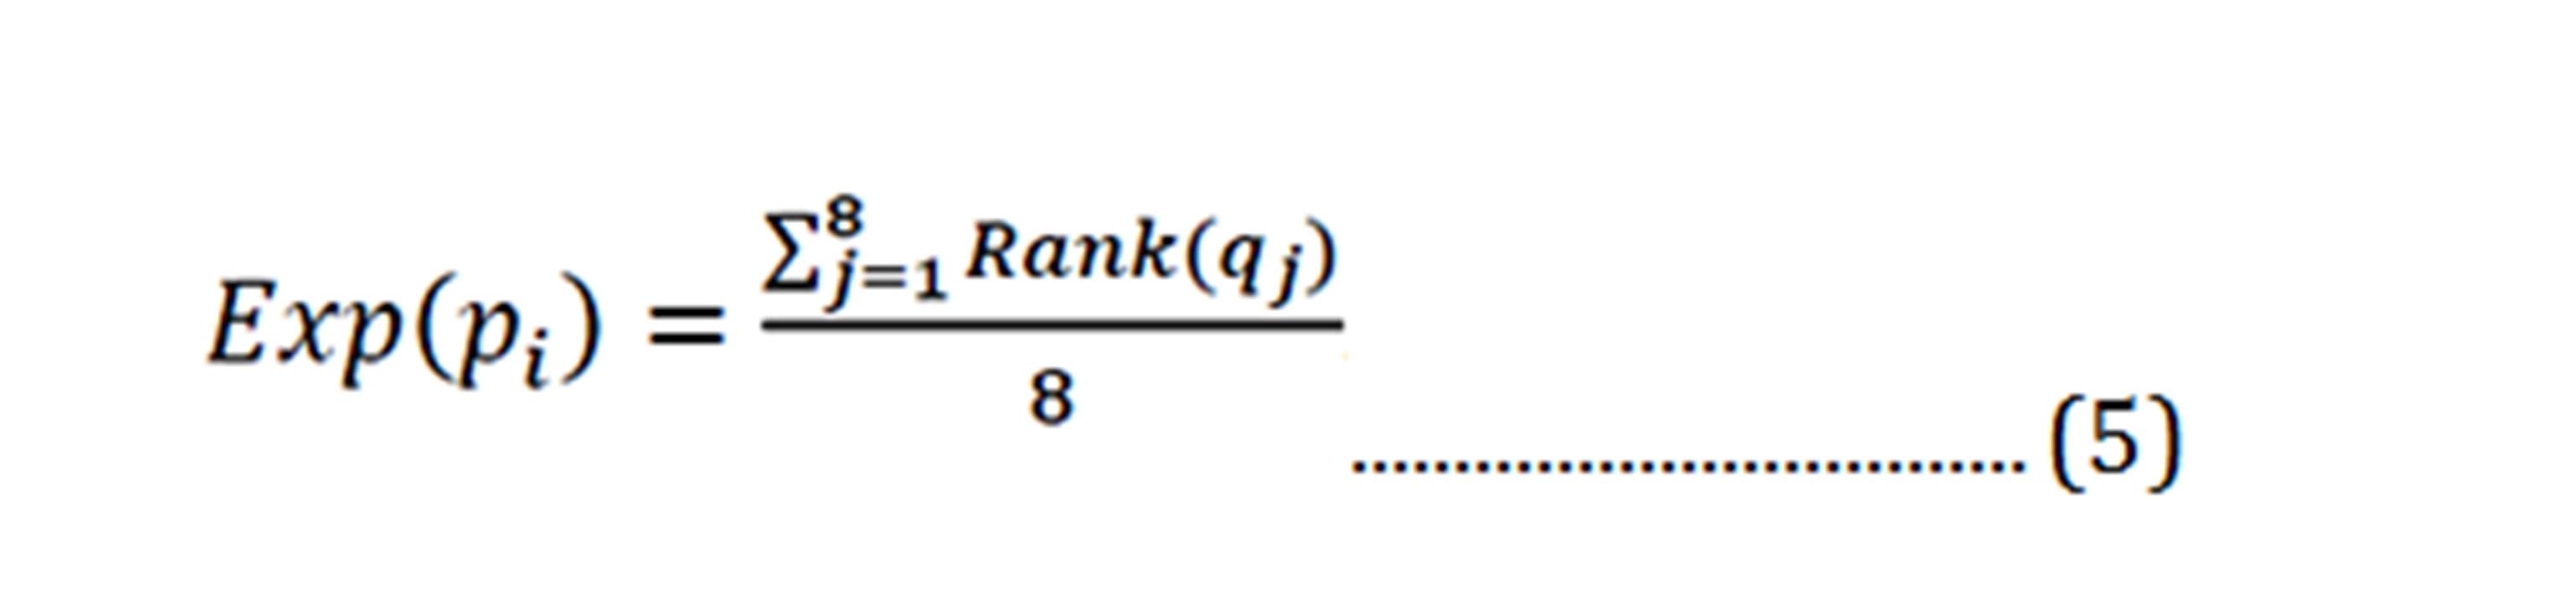
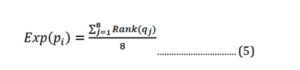
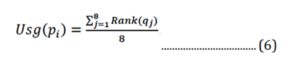
Similarly, the amount of “Experience quantity” is calculated as follows:
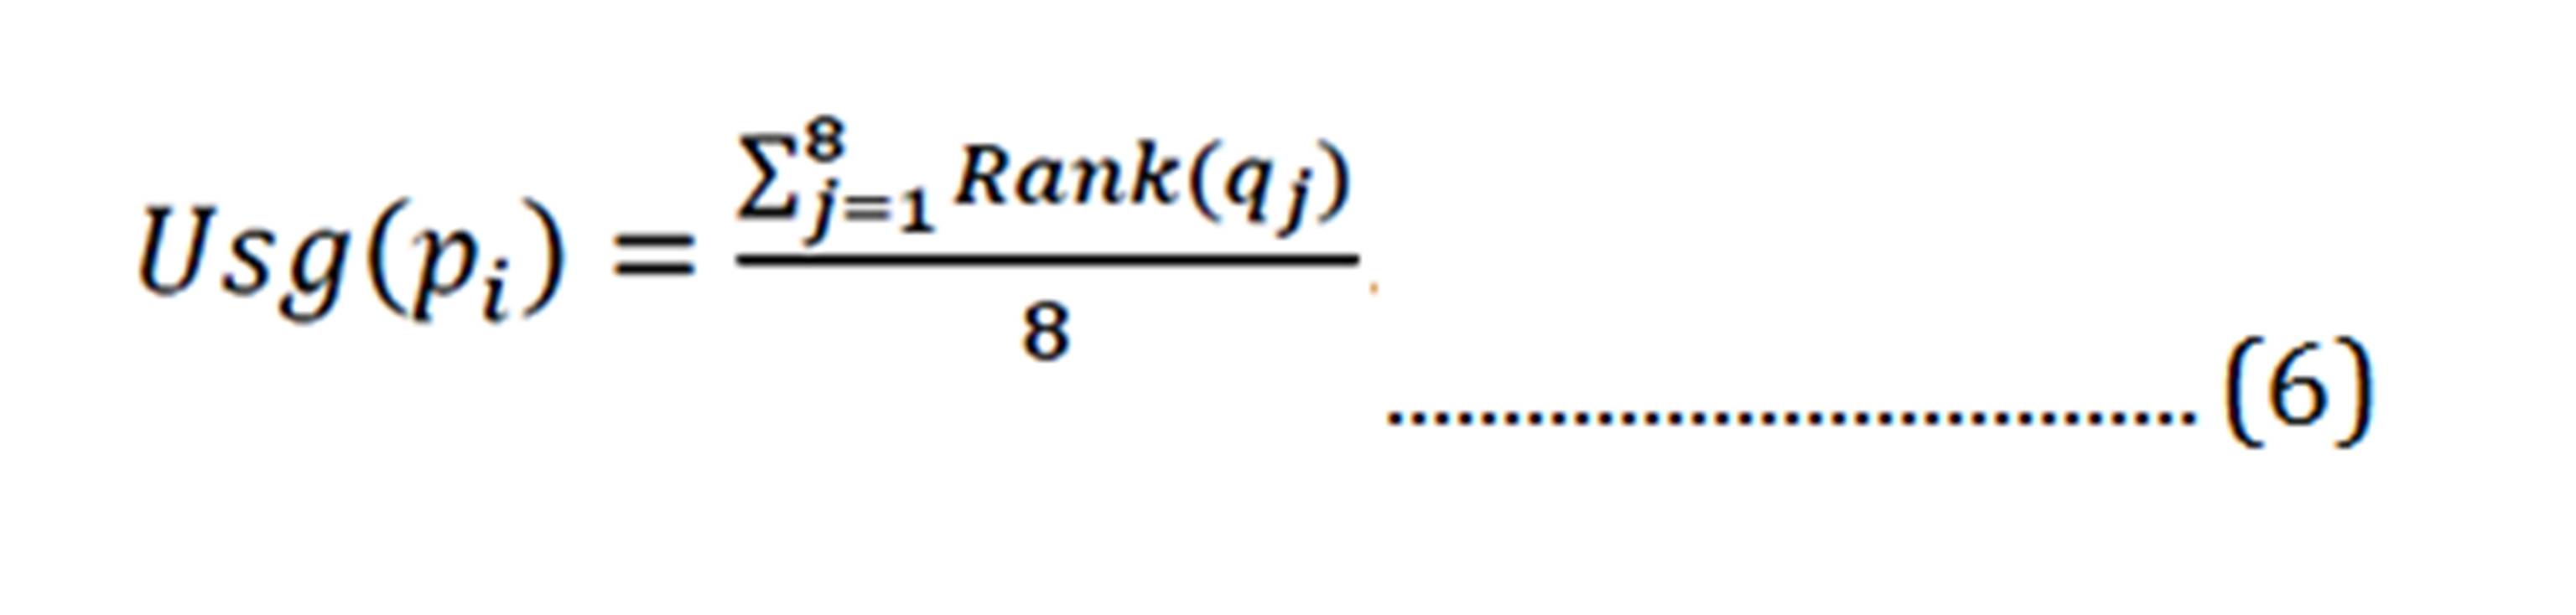
Finally, the amount of “Usage quantity” is calculated by averaging the ranks of usage questions answers as follows:
The quantification mechanism mentioned above results in generating new statistical sample data that could be used to verify the assumptions and hypothesis of this research. For assumption (A1), the correlation coefficient between knowledge-quantity and experience-quantity values can reveal the relationship between the two quantities. Similarly, calculating the correlation between experience-quantity and usage-quantity values can prove or disprove the direct proportion we assume in (A2). As for assumption (A3), if (A1) is proved, then (A3) is implicitly satisfied; because the increasing of Exp value implies, by necessity, an increasing in Kn value.
In order to test the null hypothesis, two mean values are calculated; the first value (called Generic Knowledge Mean (GKM)) represents the sample mean of knowledge-quantities, and the second value (called Generic Experience Mean (GEM)) represents the sample mean of experience-quantities. Consequently, the null hypothesis this research argues about could be represented as follows:
H0: The mobile users GKM = mobile users GEM.
The alternative hypothesis is then:
Ha: The mobile users GKM ≠mobile users GEM.
The following section presents an analytical study and discusses the results of the above tests.
Result Analysis and Discussion
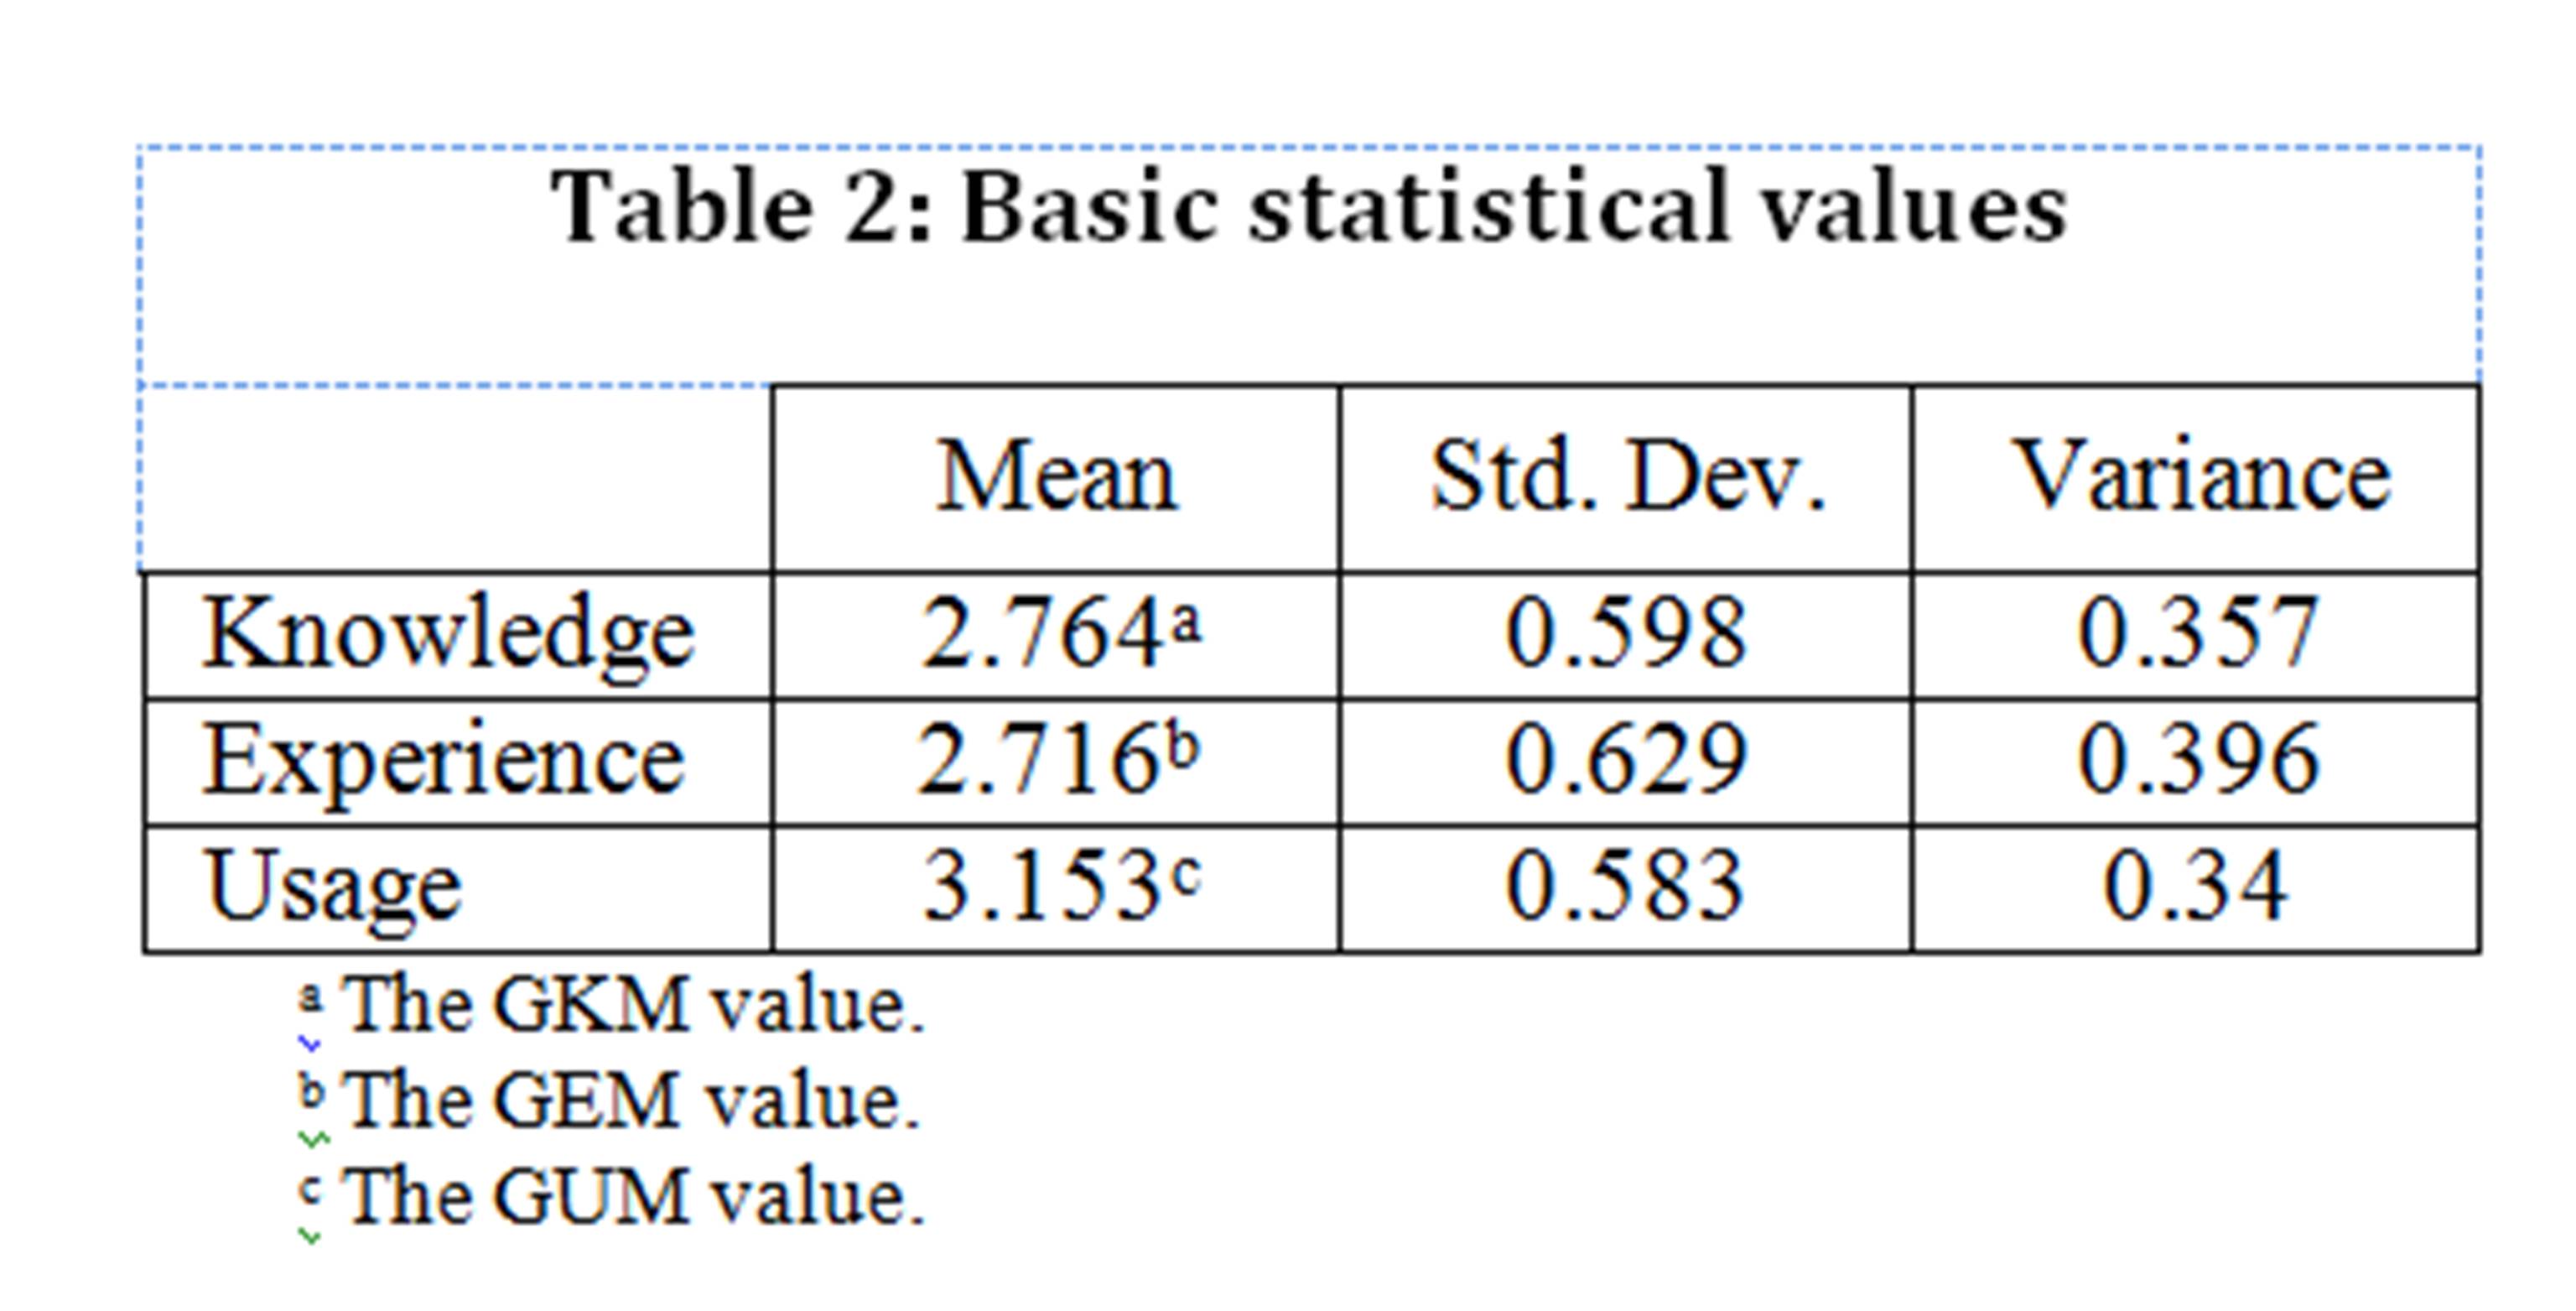
The survey data have been analyzed using SPSS® v13. Table 2 demonstrates some basic statistical values for the three variables (knowledge, experience, and usage). The mean values shown in the table reveal basically significant information about the expected relationship between the three variables.
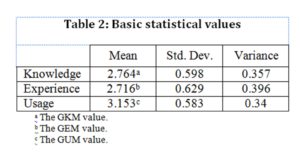
For “Usage”, it is obvious that the GUM value is higher than the values of “Knowledge” and “Experience”. The difference in “Usage” Mean results from the fact that mobile users have more skills in using mobile services without having all knowledge about mobile platform, or attaining experience on how these services execute on that platform.
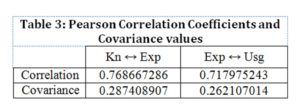
In order to verify assumptions A1 and A2, the Pearson Correlation Coefficient values have been calculated (as shown in Table 3). Firstly, the correlation between “knowledge” and “experience” is equal to 0.769; which indicates a strong positive linear relationship. This value is enough to verify A1 validity.
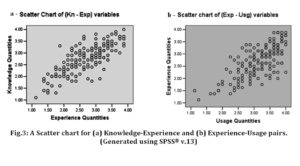
In addition, Fig.3 (a) demonstrates a simple scatter chart for this relationship. Secondly, the correlation value between “experience” and “usage” is 0.718; which results in a strong positive linear relationship as illustrated in Fig.3 (b). This proves the validity of A2. The positive value of covariance in both cases assures the tendency of positive linearity.
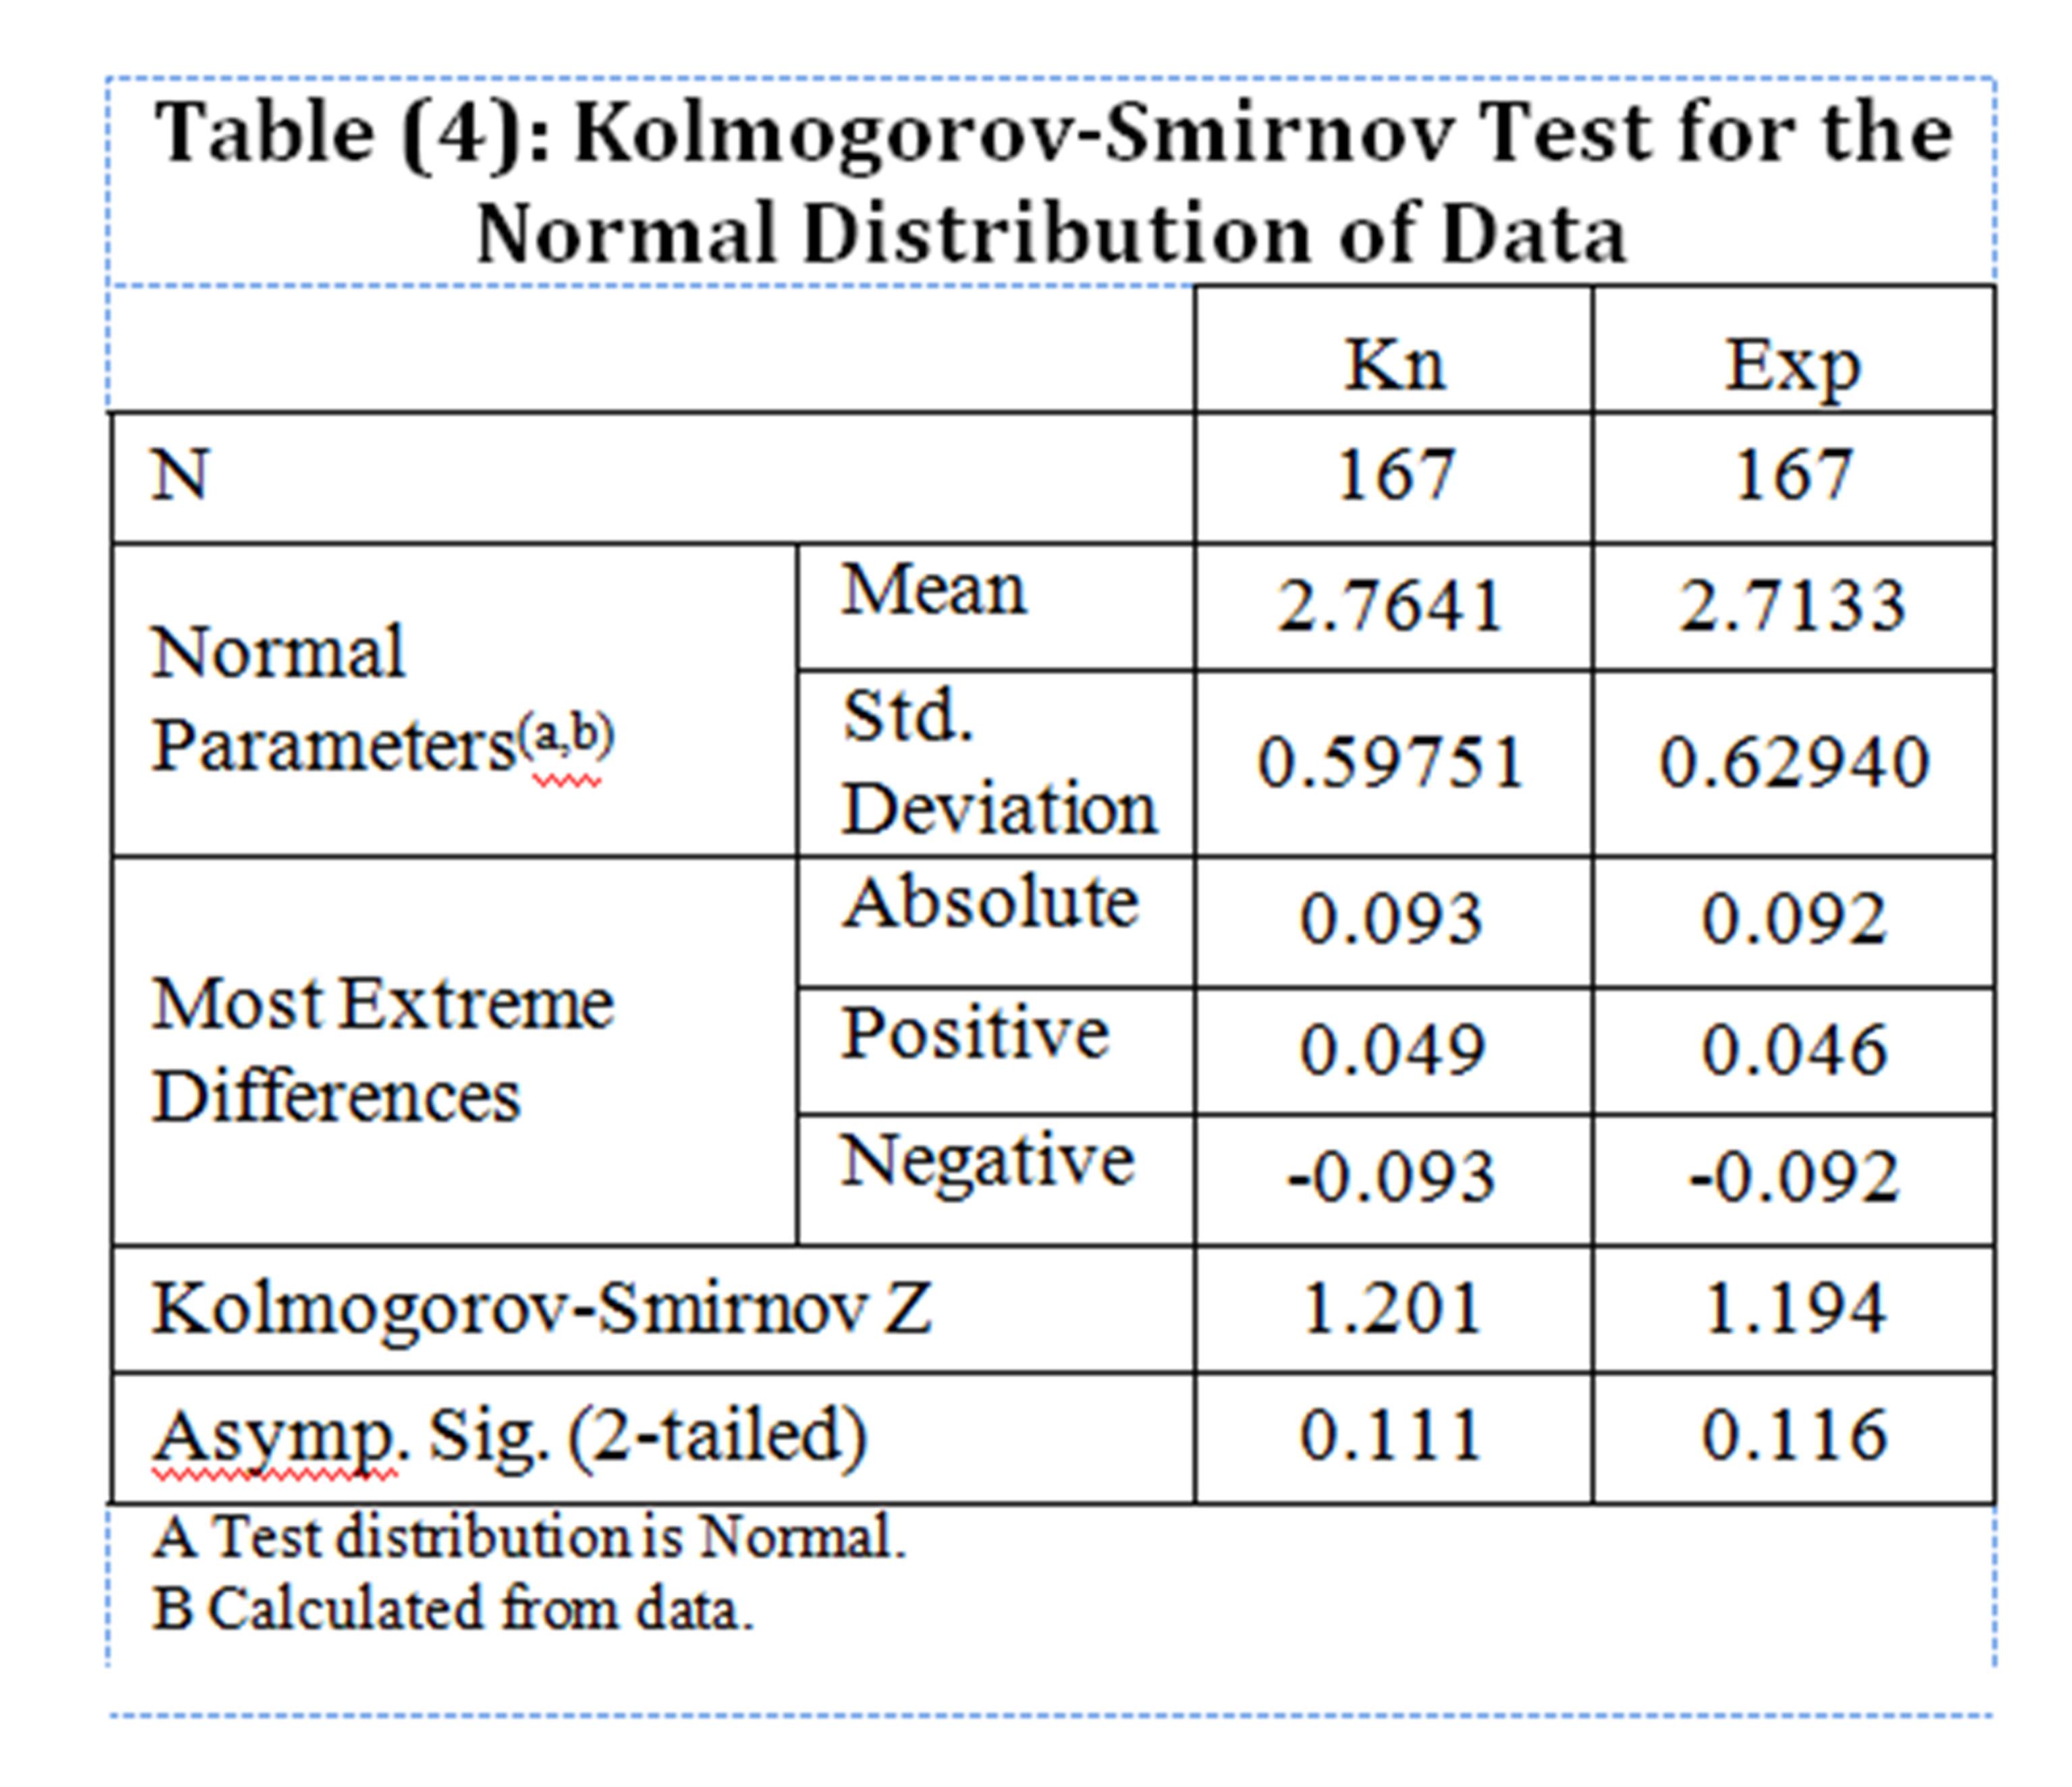
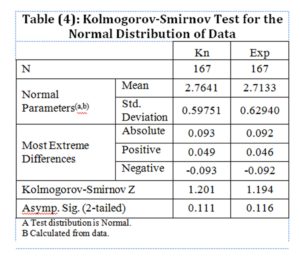
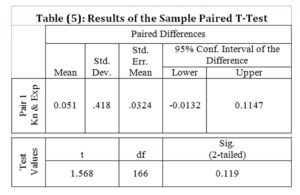
To test the null hypothesis, the “Paired Sample T-Test” is applied, but before that, the values of knowledge-quantity and experience-quantity must be tested against normal distribution. The results of Kolmogorov-Smirnov Test are shown in Table 4. The Sig. (2-tailed) values in both cases are greater than 0.05 (P>0.05). Therefore, the values of knowledge and experience quantities are normally distributed. The results of T-test are recorded and reorganized in Table 5. Since the value of Sig. (2-tailed) > 0.05, then the null hypothesis is accepted at signification level (α = 0.05).
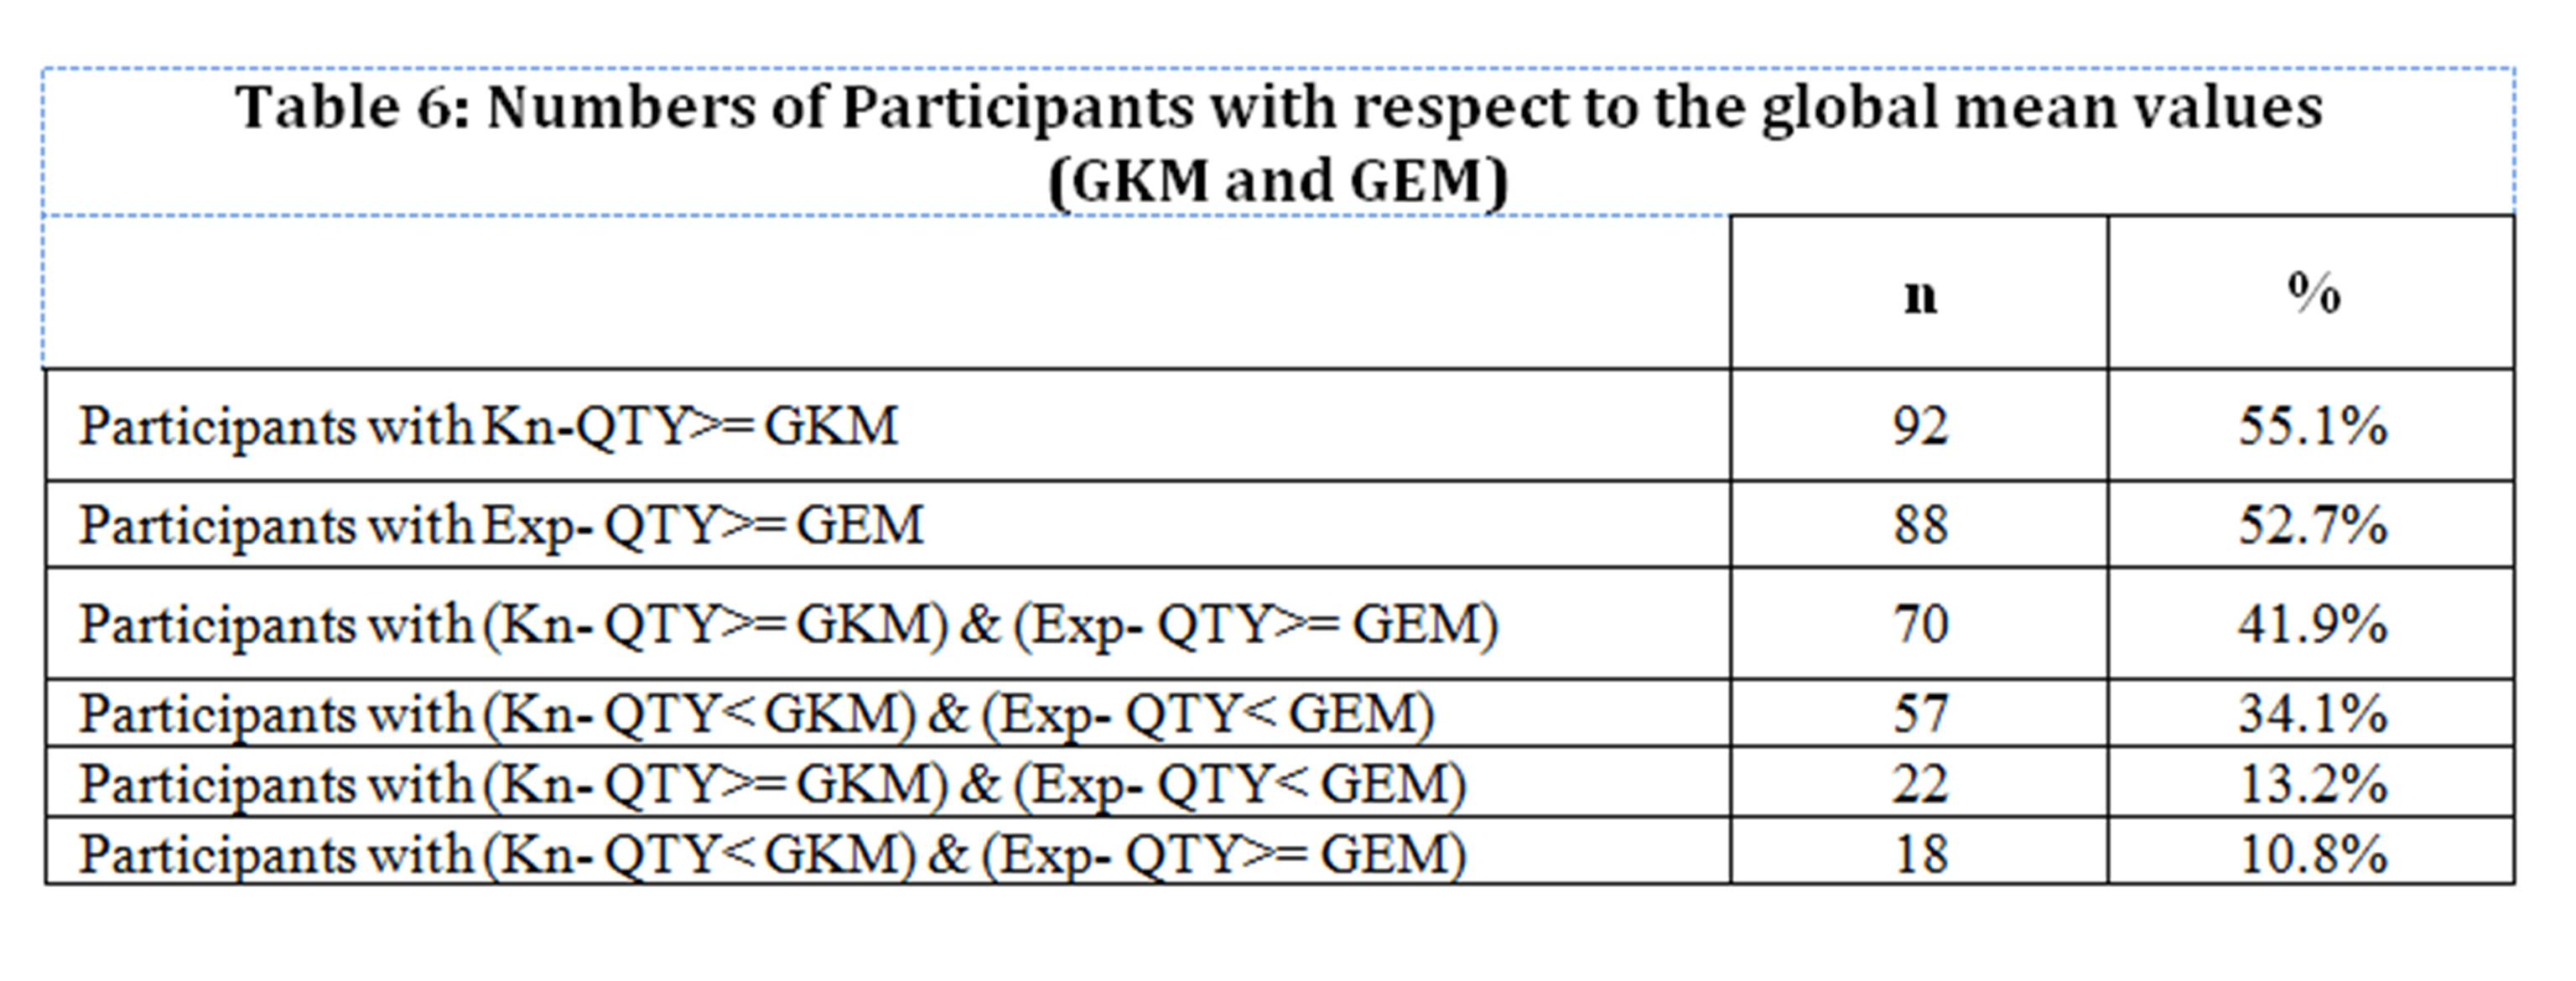
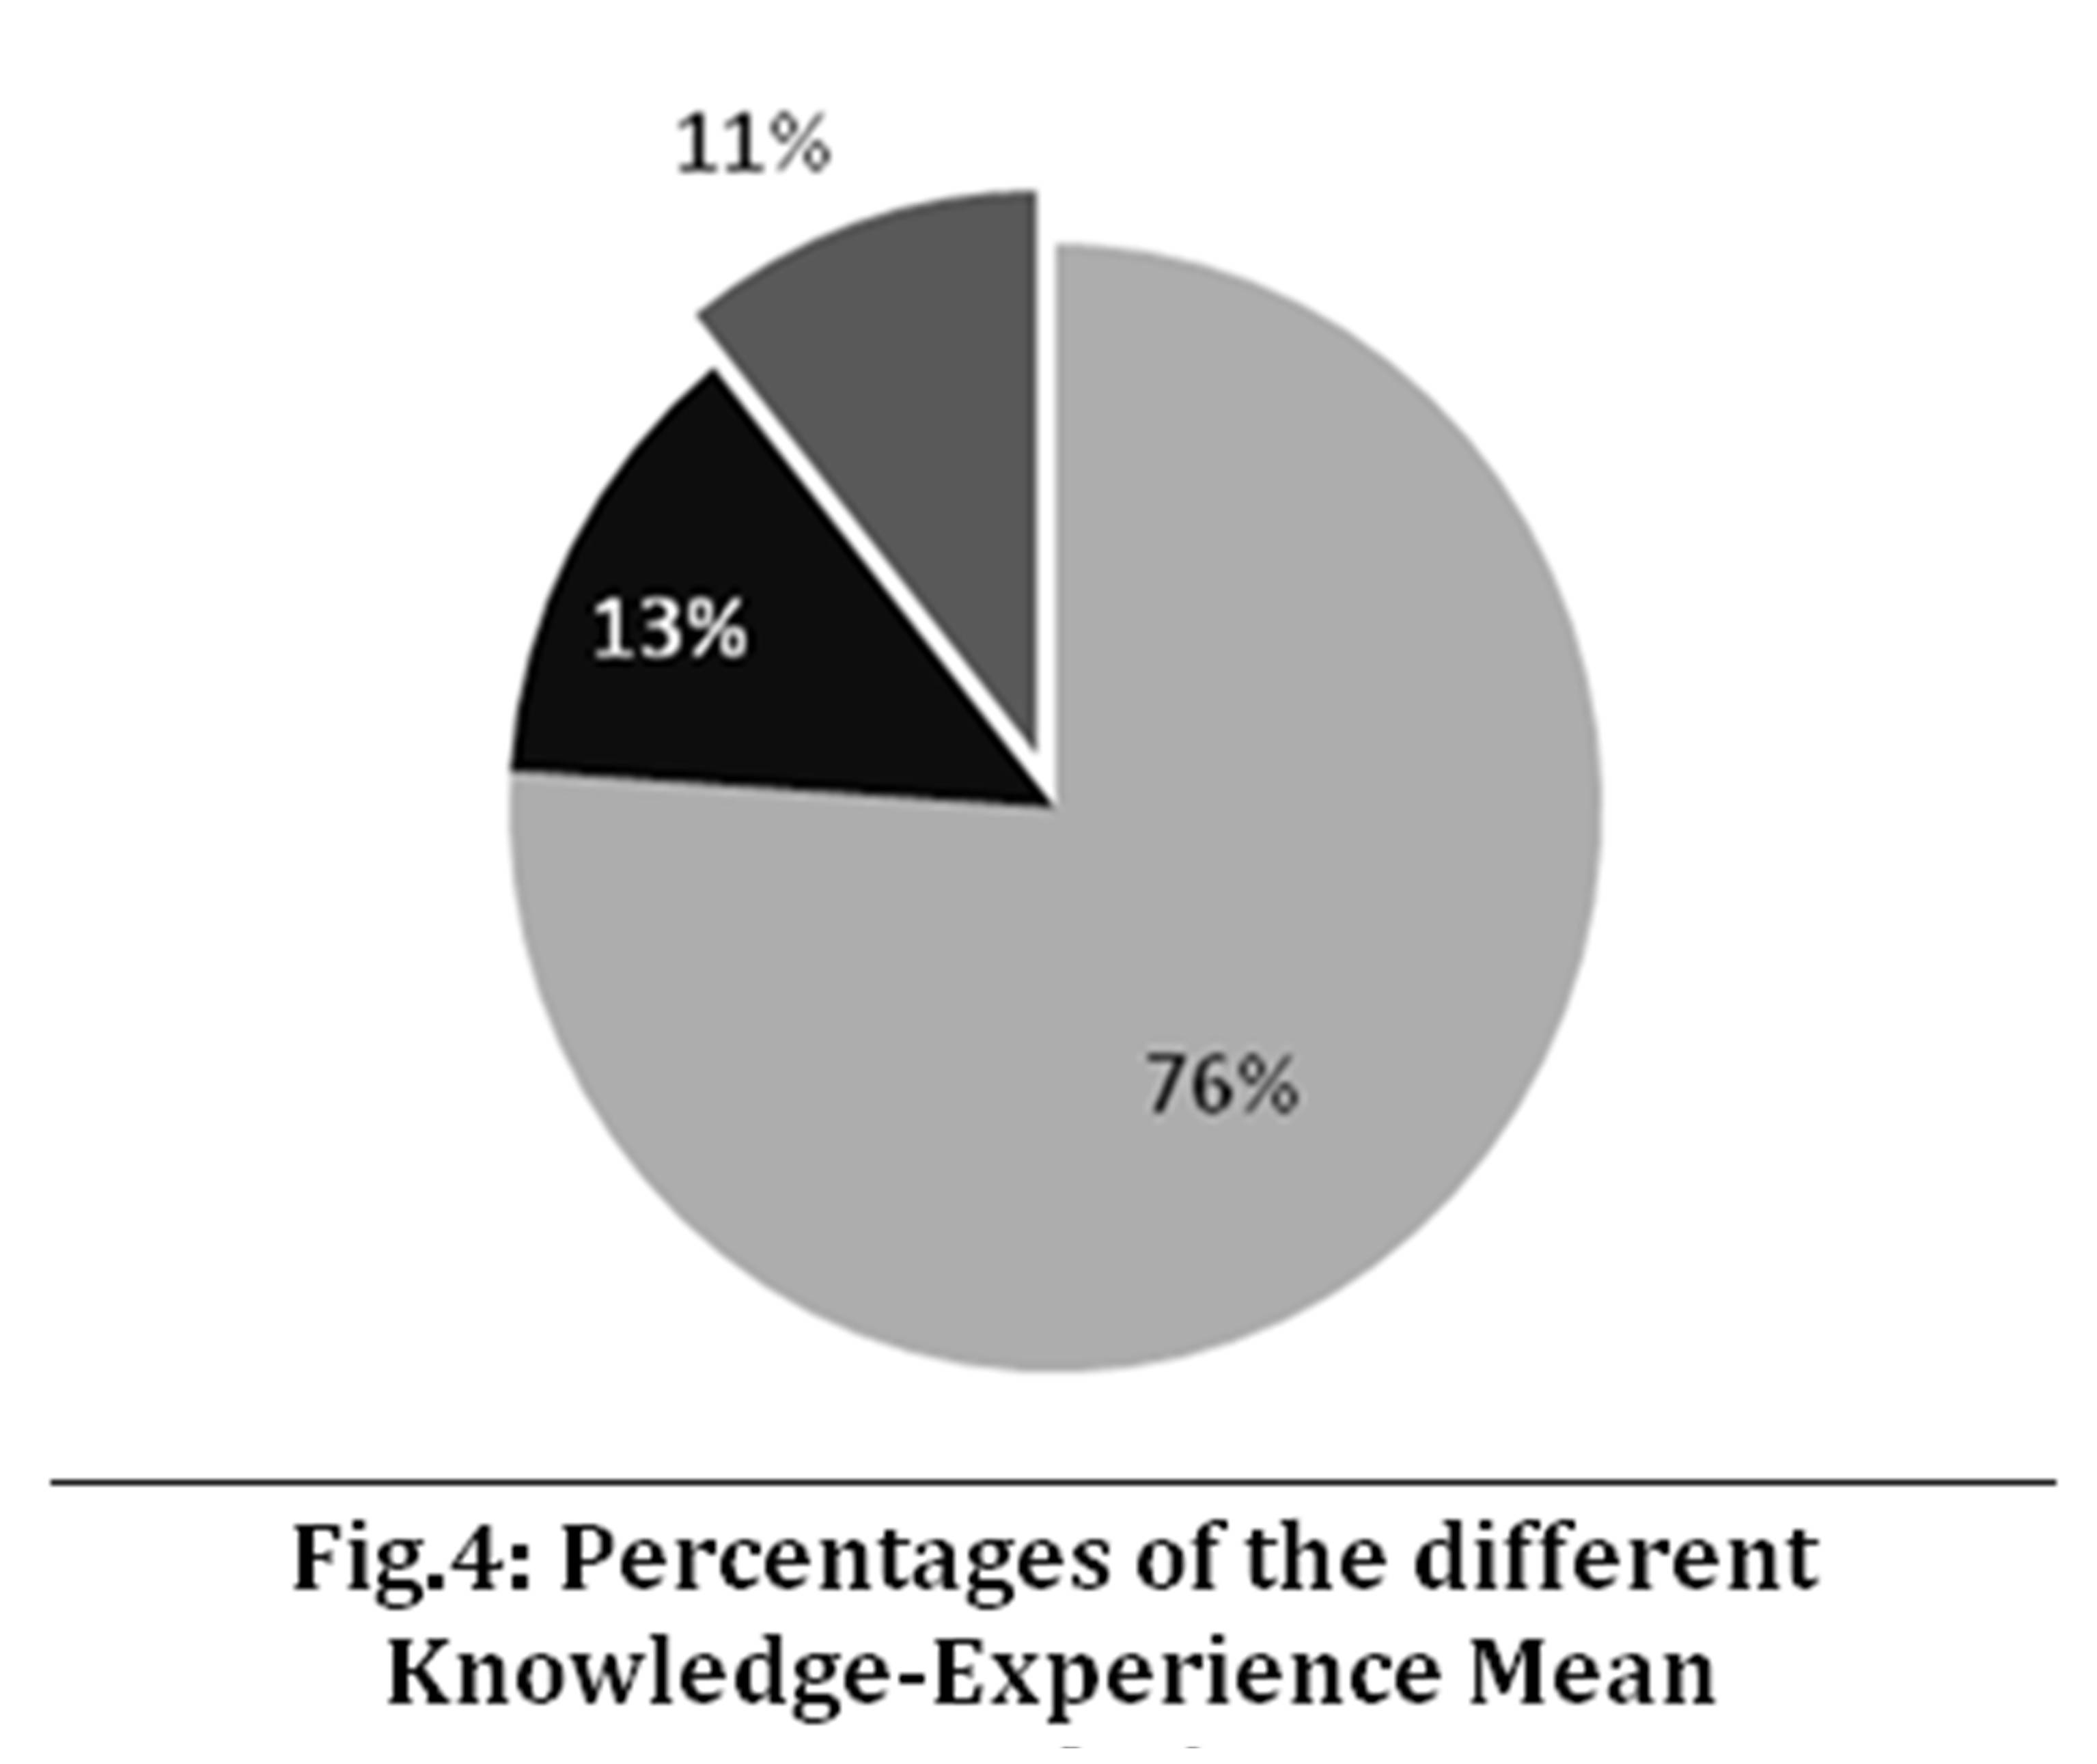
Furthermore, an additional statistical analysis has been performed. As shown in Table 6, the number of participants who are having knowledge-quantities is greater than the GKM and, at the same time, having more experience-quantities than the GEM is 70 (41.9%). Similarly, the number of participants with knowledge-quantities less than GKM and experience-quantities less than GEM is 57 (34.1%). The two participant groups realize the acceptance of the null hypothesis with a total of 127 persons out of 167 and a percentage of 76.0% as illustrated in Fig.4.
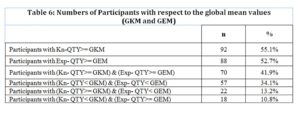
The remaining participants show different knowledge-experience relationships; 22 of them (13.2%) record knowledge-quantities greater than the GKM but experience-quantities less than the GEM. Inspecting the experience-quantity values of these participants, their mean value = 2.4523(with standard error of mean= 0.0434 and variance= 0.041). By observation, the highest 13 participants’ experience-quantities (among the 22) have an average value equal to 2.6 (to the GEM, this records a standard error of mean = 0.058 and variance = 0.0067).

On the contrary, 18 participants show experience-quantity values greater than the GEM but knowledge-quantities less than the GKM.
Once again, inspecting the knowledge-quantity values of these participants, the mean of these 18 values (10.8%) was found to equal 2.461 (with standard error of mean=0.0705and variance=0.0896). In addition, it has been found that the top 10 knowledge-quantity values (among the 18) record a mean value of 2.66 (to the GKM value, this registers a standard error of mean= 0.052 and variance = 0.0054). Consequently, it might be concluded that even 40 participants show unexpected values (hereafter considered as odd values) for knowledge- and experience-quantity, the small values of standard error of means and variance of 23 of them point to tangible and closer values to the GEM and GKM values.
However, several factors can cause the oddity of knowledge- and experience-quantities of the 40 participants. First, and likelihood, the participant may misunderstand some survey questions; which may cause her/him to fill the answers of these questions in a random way rather than leaving them unanswered. A second reason could be due to the low educational level; the survey data point to that 28 participants out of 167 (the sample size), with a percentage of 16.77%, have low educational levels (i.e. 12thschool class or less[1]). Eleven of them record odd values for knowledge- and experience-quantities (with a percentage close to 40.0%).
Conclusions and Future Works
In this paper, the mobile service utilization has been studied from three aspects; the knowledge of mobile users to mobile platform, the experience of mobile users in manipulating mobile services, and the way they use these services. This aims at measuring the effects of these aspects on mobile services’ utilization through a survey instrument.
The statistical analysis and tests’ results have shown that participants who have the knowledge of their mobile platforms have better experience levels than those who do not have the same level of knowledge. The results expected to help mobile services developers to pay attention to the “knowledge” aspect regarding services interoperability with mobile platforms. From another side, mobile devices manufacturers can make use of the research results. For example, a tutorial might be shipped with the device to explain the hardware specifications of the mobile device along with how mobile OS manages the hardware. This will increase the knowledge level of mobile users to the platform, which leads to better experience; hence, better utilization.
Despite the results calculated upon the questionnaire’s statistical analysis in this research, the following limitations have been encountered. First, the environment where the questionnaire has been distributed targets Jordan only. A second limitation is the unrealistic answers and low liability level of some participants towards the research questionnaire; although the number of such participants is very small, the statistical analysis has been affected with a slight deformation. As discussed in the previous section, this unrealistic participation could result from the misunderstanding of questionnaire questions or the low educational level.
For future work, wider range of participants needs to be included in the survey, so that generalization of research results could be verified. In addition, more statistical tests might be carried out; therefore, further suggestions could be extracted. Also, the effect of knowledge to mobile platform on services’ utilization needs to be studied considering other factors like time-of-use, demographic and emotional criteria, and the financial issues.
References
- eMaketers, (2014), 2 Billion Consumers Worldwide to Get Smart(phones) by 2016, [Online], web address: http://www.emarketer.com/Article/2-Billion-Consumers-Worldwide-Smartphones-by-2016/1011694[last visited: May, 2016]
- Gao L. and Waechter K., (2015), “Examining the role of initial trust in user adoption of mobile payment services: an empirical investigation”, Information Systems Frontiers, DOI: 10.1007/s10796-015-9611-0, Springer US, pp. 1 — 24, November.
Google Scholar
- Heikkinen M., Nurminen J., Smura T., and Hämmäinen H., (2012), “Energy efficiency of mobile handsets: Measuring user attitudes and behavior”, Telematics and Informatics,
Vol. 29, Iss. 4, pp. 387-399, ISSN 0736-5853.
Google Scholar
- Luis M., García-Cueto E., Muñiz J., (2008), “Effect of the number of response categories on the reliability and validity of rating scales”. In: Methodology: European Journal of Research Methods for the Behavioral and Social Sciences, Vol 4(2), pp. 73-79.
Google Scholar
- Park, J., Han, S. H., Kim, H. K., Cho, Y. and Park, W., (2013-a), “Developing Elements of User Experience for Mobile Phones and Services: Survey, Interview, and Observation Approaches”, Hum. Factors Man., 23: 279—293. doi: 10.1002/hfm.20316.
Google Scholar
- Park J., Han, S. H, Kim H, Oh, S., Moon, H., (2013-b), “Modeling user experience: A case study on a mobile device”, International Journal of Industrial Ergonomics, Volume 43, Issue 2, March 2013, pp. 187-196, ISSN 0169-8141, http://dx.doi.org/10.1016/j.ergon.2013.01.005.
Google Scholar
- Rawal B., Rehman A. and Rao S., (2014), “Measuring Service Quality in Cellular Phone Service”, International Journal of Engineering and Management Research (IJEMR), volume 4, issue 7.
- Ristola A., KoivumakiT. and KestiM., (2005), “The effect on familiar mobile device and usage time on creating perceptions towards mobile services”, International Conference on Mobile Business (ICMB’05), pp. 384-391.
Google Scholar
- Sarmento, T. and L. Patrício (2012). “Mobile Service Experience – a quantitative study”, Proceedings of IPDMC, 19th International Product Development Management Conference, University of Manchester, UK, 215,216
- Sarmento, T. and L. Patrício (2014). “Incorporating the customer experience along different iterative cycles of service design”, ServDes.2014 Fourth Service Design and Innovation conference, April, 2014, Lancaster University, UK, pp. 301 – 312
Google Scholar
- Smura T., KiviA. and Töyli J., (2009), “A framework for analysing the usage of mobile services”, Info, Emerald Group Publishing Limited, ISSN 1463-6697, Vol. 11 Iss 4 pp. 53 — 67.
Google Scholar
- Statista, (2013), Number of smartphone users worldwide from 2014 to 2019 (in millions), [Online], http://www.statista.com/statistics/330695/
[last visited: May, 2016]