Introduction
Among the first reference papers devoted to the knowledge organization and to knowledge management, we note “The Knowledge Creating Company”, by I. Nonaka (1998), included in “Harvard Business Review on Knowledge Management”.
The author characterizes the knowledge-based organization as one that focuses on ideals and ideas, both central for innovation, it’s essence being to redesign the world in line with a particular vision or ideal (Nonaka, 1998). The other works under the umbrella of “Harvard Business Review on Knowledge Management” (1998), present the knowledge organization as a learning organization, together with all related management issues, such as: managers not realizing that most people do not know how to learn (Argyris, 1998) or the type of mentality needed in such an organization (Garvin, 1998).
Thus, as stated by Noe and McGraw-Hill (2010), companies are beginning to realize that they must retain the knowledge that they hold, in particular through the generation of “baby boomers” (1945-1960), and continue to seek ways to integrate the human capital into the organization.
After extensive research, new approaches to this type of organization appear, even if under different names. One of the relevant works referred to is “Harvard Business Review on the Innovative Enterprise” (2003), a collection of articles which introduce the readers to the knowledge organization and its specific management, even though the focus is on innovation and creativity this time.
Later, the focus stands on two essential and complementary features that allow the company to put the so “knowledge resource” (Nicolescu and Nicolescu, 2011) in motion, namely the following aspects, as explained by Saint-Onge and Armstrong (2004): its ”Ÿcapabilities”, which ”Ÿare the link between strategy and performance”, as well as its ”Ÿconductivity”, which is ”Ÿthe capability to effectively transmit high-quality knowledge throughout the organization as well as with and between customers and employees”.
What followed was an explosion in terms of the number of papers on the knowledge organization and knowledge management, many experts from around the world making significant contributions: the Japanese school makes its input on knowledge management, through the well-known work of Takeuchi and Nonaka (2004); then, David Schwartz elaborates the first and only authentic encyclopedia in this field of knowledge (2006); later, Geisler and Wickramasinghe devote a third of their work to knowledge-based organizations (2009); recently, Kimiz Dalkir presents the second edition of “Knowledge Management in Theory and Practice” (2011). Latest research lead to the idea that there is a “new generation” of knowledge management, namely the one under the influence of new technological developments, such as smart phones, social networks, etc. (O’Dell and Hubert, 2011).
What all the research mentioned above share, is that it treats the knowledge organization in terms of qualitative research. There are various models contained in the papers listed, which allow positioning of a certain company on a certain level in the staircase up to the upper floor, where we find an organization which makes the most of its knowledge and knowledge-related processes. Up to a point, all these models are much alike, because none of them permits the launch of a theory or statements with quantitative precision.
An important and emerging field as the one concerned, cannot be deprived of quantitative approaches, and here we are dealing exactly with a quantitative approach to a management issue. Therefore, in this paper, we seek to identify one or at most two aggregated indicators, which allow us to make an informational synthesis of the characteristics of knowledge organizations, reflected thorugh different (and many) indicators.
Thus, shifting into one mathematical dimension or even in two dimensions, significantly increases the sphere of knowledge for those interested in concretely nominating whether an organization is knowledge-based or not.
Research Method
The method which allows us the informationl synthesis in order to obtain an authentic aggregate indicator is the Principal Components Analysis (PCA). Principal Component Analysis (PCA) is an explorative technique used for the integration of the data. Its main advantage is that it allows the rephrasing of the original variables by ”Ÿreducing the number of dimensions, without much loss of information” (Smith, 2002).
The initial set of data usually has numerous deficiencies, which include redundancy or high dimensionality of the data, hence the difficulty to arange the cases, as it is explained by Ruxanda (2001). The extremely important utility of the PCA shows here, the methos helping us to express the initial variables through a same number of new variables, called principal components – wi; these principal components are uncorrelated with each other and they assume the entire amount of information contained in the original variables.
Using various criteria, we will later choose how many of these new variabile we want to keep for the analysis, losing only minimal information, but significantly reducing the dimensions of the mathematical space of the analysis.
We may express the problem in the following way:
W = á¼€1x1 + á¼€2x2 + … + á¼€nxn (1)
Where W is the vector of the principal components; xi is our data; á¼€ is a scalar number. The question now is: what should be the value of á¼€i, so that wn can assimilate the maximum amount of information from our initial vector of information X?
PCA may use the covariance matrix or the correlation matrix. Usually, it calls for the covariance matrix, which is the “classical” way, but in the case study illustrated below, the author has chosen the correlation matrix. Using the latter mentioned matrix is equivalent to processing standardized data processing (subtracted mean and division to the standard deviation). The logic of the analysis remains the same in both cases.
The covariance matrix is the matrix which has the variance of the original variables on the main diagonal and the other elements are the covariances of the variables that are placed on that line and column. Once we have the covariance matrix, it can be demonstrated, as Dedu, Armeanu and Enciu (2009) have, that the á¼€ vector which defines the principal components vector (W) is an eigenvector of the matrix, following the formula:
MX = á¼€X (2)
Where á¼€ is a number called ”Ÿeigenvalue”, M is any matrix, and X is the initial vector of data.
Thus, we can say that “PCA is the simplest of the true eigenvector-based multivariate analyses” (Wikipedia, 2012). Further on, the question is that of choosing which of the eigenvectors of the matrix (as it has a number of eigenvectors equal to its dimension) we use to define the principal components, wi. This is where the dimensionality reduction happens, because we shall keep only the first k principal components for the analysis, the ones with the biggest variance, depending on the needs of our analysis.
Two important results from the PCA are of interest now. The first one is the principal scores matrix. The principal scores represent coordinates of our initial objects, but in the new space with reduced dimensionality, where the principal components were defined.
The second important matrix is the factor matrix. This is, itself, also a correlation matrix, but between the original variables (in lines) and the principal components retained for analysis (in columns). Thus, this matrix helps to interpret the principal components, specifically allowing us to give a name and explanation for them, based on the correlation of each principal component with the original variables. Also for interpretation purpose, we can use a simplified form of factor analysis, because “PCA is closely related to factor analysis” (Wikipedia, 2012), both being mathematical methods based on the eigenvectors of a (covariance or correlation) matrix.
Next, we show how the PCA can help us solve the quantitative management problem which is the subject of this paper. We have a data set from 20 companies for 10 indicators. The data was collected from the balance sheets of these companies and, partly, from semi-structured interviews with various people in management positions.
Because of the high degree of specialization required by the type of data collected, regarding knowledge processes, we assume that only 20 cases is enough for the phase in which the research is in. The Romanian companies have to learn that, first, they have to collect this kind of information (about innovation, learning rates, etc.) and ease the access of researchers to it. Since in this study we are primarily interested in whether this methodology works or not (and we shall find that it does), at this point we run the software program on the 20 companies which, indeed, have collected the kind of data that we need. In the near future, we shall repeat the study on a larger sample and extend the results to a national level.
Also, for the accuracy of the results, it is better to run the analysis on 20 authentic knowledge-based organizations, rather than on 100 companies which know nothing of this domain. So, for now, we want to know which of the 20 organizations are knowledge organizations and to what extent are there differences between the companies from this point of view.
The 10 indicators selected to characterize the firms were gathered from six directions, or actually represent six major areas of a knowledge-based organization:
- Innovation: already became a sine qua non for survival, not enough on its own in order to characterize a knowledge organization, but certainly having a significant contribution. We measure the importance granted by companies to promote innovation by the number of ideas submitted by an employee, during one year, in the idea-box of the organization (number of ideas / employee / year – IB);
- Continuous learning: we can call it the “twin sister” of innovation, both of them going hand in hand to ensure the competitiveness and even the satisfaction of employees in today’s organizations. We measure the degree or intensity of concern for lifelong learning, by counting the days dedicated to learning by each employee (days assigned and granted by the employer) of the company, during one year (days / employee / year – DS);
- Flexibility: being an important characteristic in identifying knowledge-based organizations, we follow with interest as it is manifested in the companies selected, through two indicators proposed by J. Ivancevich, J. Donnelly, Jr. and J. Gibson (1989) and later presented in a work of Russu, Dumitrescu and Plesoianu (2008): investment in the professional development of employees (hundreds of thousands – IPD) and expenditure on research and development (tens of thousands – RD).
- Technological development: we seek to express through this indicator the degree of work performed electronically by an employee (average percentage of work performed electronically / employee – TD). This direction of analysis is important, because, according to Geisler and Wickramasinghe (2009), the knowledge society and, therefore, the knowledge-based organizations, came as an improvement, as a logical continuation to the information society which had already been outlined.
- Intellectual capital: starting from the general classification of the intellectual capital made by Saint-Onge and Armstrong (2004), we chose one single indicator we considered to be representative for each type of intellectual capital, indicators we subsequently partially adapted. Thus, initially, the human capital is measured by many indicators, from which we chose the ”Ÿpercentage of new ideas that are actually implemented”; we adapted and used the indicator as the number of ideas implemented in a year (NII). The structural capital is proposed to be measured by the ”Ÿrevenue per employee”, adapted and used as labor productivity (hundreds of thousands / person – W), considered to be more relevant. The customer capital is given by the market share, as “percentage of penetration and coverage”, but still we consider it to be reflected by the gross margin (GM – expressed as percentage).
- Economic performance: reflected through two widely used indicators in the economic, investment, even management field, namely RoE and RoA (Russu, Dumitrescu and Plesoianu, 2008).
The Principal Component Analysis (PCA) aims to identify a synthetic indicator, which is not characterized by redundancy and contains the maximum of information from the 10 original variables. For data processing we used the software Statistics 8 and, when necessary, Microsoft Office Excel 2007.
We chose data aggregation using the correlation matrix, because it involves the use of standardized data, and unbiased version, with (n-1) degrees of freedom, where n is the total number of observations or cases.
Results Found
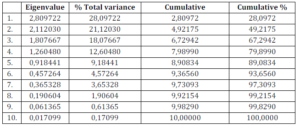
After running the analysis, we find several important information, from the perspective of the aggregate indicator we are searching for: first, the eigenvalues are found in Table 1:
Table 1: Eigenvalues of the Original Variables
The factor matrix is another result of the analysis, but it is very complex in terms of information. Using the ”ŸFactor Analysis” option of Statistics 8, we can rescale the variables, so that it becomes more apparent how to find an interpretation of the principal components.
The results are found in the following Table 2. Another result is the principal scores matrix, but this will be present further on, in order to facilitate the explanation of its properties.
Interpretation of the Results and Analysis
Table 1 introduces the specific results of the PCA. In the table find the eigenvalues of our variables. The first eigenvalues, for example, contains 28.09722% of uncorrelated information of the ten original indicators. The second component contains 21.12030%, and the first two principal components combined would share 49.2175% of the initial information.
The reduction of the dimensionality can already be observed: from a space with 10 dimensions, we skiped into a two-dimensional space, keeping about half of the information. However, we need to retrieve more information, so as to have a lower informational loss.
Thus, we hold for the analysis several principal components, so that the loss of information to be tolerable. Table 1 shows that if we hold on to the first four principal components for the analysis, we retain 79.8990% of the information, thus losing about 20%, amount deemed acceptable.
In this case, we conclude that it was not possible to reduce the dimensionality so as to summarize to two or three dimensions, so we shall combine the four main components. What will be obtained is an aggregate indicator which contains 79.8990% of the initial information, allowing us to rank the 20 companies or even to plot them.
Table 2: Factor Analysis for the First 4 Principal Components
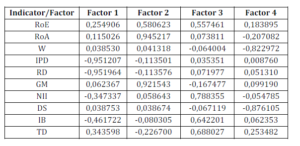
Before, however, we use the information in Table 2 to actually name these first four principal components that we decided to keep in the analysis. Thus, we see that the first factor (or the first principal component – w1) is strongly negatively correlated with IPD and RD, exactly the two indicators chosen to measure flexibility.
If this factor increases, IPD and RD will drop. Obviously, the first principal component will be called “degree of rigidity” (DR) and we will seek a low value for it. The second principal component is strongly positively correlated with RoA and GM.
This shows that this indicator can be called “efficiency of assets” (EA), as RoA and GM require an effective asset management. The third principal component is positively correlated with the number of ideas actually implemented. Thus, we can call it “rythm of change implementation”(RCI), because implementing a big number of ideas implies being open to change.
The last principal component is negatively correlated with W and the number of days devoted to learning by each employee. In other words, it is the “opposite” of employee productivity, but also of their dedication to lifelong learning.
To summarize, it could be the opposite of the psychological or emotional commitment of the employees for the company. Thus, this component could be called “lack of commitment” (LC); a small value for this factor will be desired.
Having revealed the four indicators that may characterize a knowledge-based organizations effectively (degree of rigidity, efficient assets, the implementation rate of change, lack of commitment.), we return to the idea of a single aggregate indicator.
This aggregate indicator will be obtained based on the four indicators or four principal components we retrieved. Given their informational content, we calculate an importance coefficient for each of the four main components. Knowing that together they comprise 79.8990% of the initial information, the importance coefficients are weighted, their sum being 1:
Ci(a) = var(wa)/ (3)
(3)
Where Ci(a) is the coefficient of importance for factor a and var(wj) is the variance of the i-th principal component. Numerical, for w1 it will be 28,0972/79,899; for w2 it will be 21,1203/79,899 and so on and so far. Thus, the aggregate indicator (IA) will be calculated using Ruxanda’s (2001) formula:
IA =  (4)
(4)
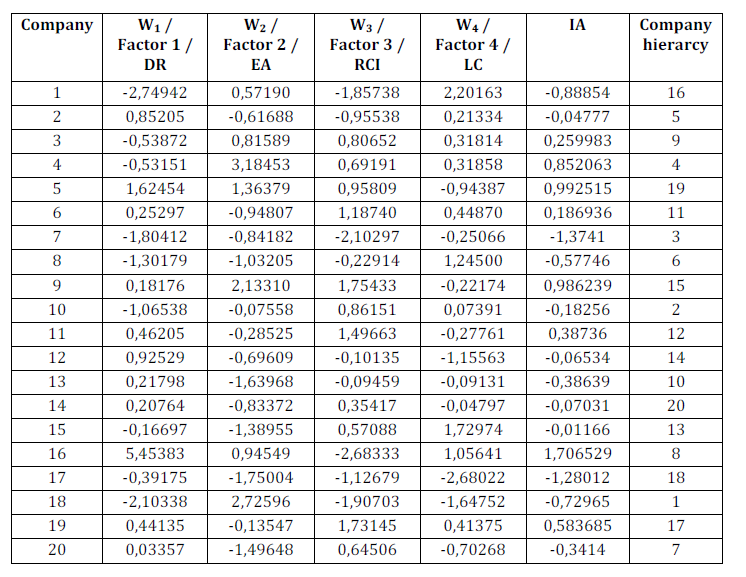
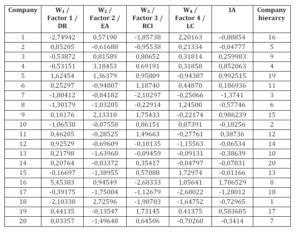
In order to calculate the aggregate indicator using the formula above, we need the values of w1, w2, w3, w4 for each company, values which are found exactly in the principal scores matrix. In Table 3 we show in columns 2 to 5 the principal scores retrieved from Statistics 8; the first column has the 20 companies, our cases or objects; in the last two columns contain the calculation of the aggregate indicator using the formula above and the hierarcy of the companies, in descending order, according to the IA values. As shown in the table, the best company, the one we can say is ”Ÿthe best knowledge organization”, is company number 18, followed by companies number 10 and 7. The last companies in the ranking are companies number 17, 5, and 14.
Table 3: Principal Scores Matrix and Calculation of the Aggregate Indicator (IA)
Conclusions
The Principal Component Analysis undertaken above has led to two main results. The first result is the informational synthesis of the 10 original indicators into 4 principal components that contain about 80% of the initial information.
The four main components are the degree of rigidity of the company, the lack of attachment of the employees towards the company, the efficiency of the assets and the rythm of change implementation. For the first two indicators, the optimal values in terms of management must be low; for the last two indicators, we seek high values. The second important result is the development of an aggregated indicator of the knowledge organizations, which showed the hierarhy and allows the graphical representation of the 20 companies that we analyzed.
The literature in this field does not contain, at the moment, any indicator presented and expressed in this way, referring mainly to knowledge-based organizations, nor are there any economic or business models that allow such as ordering of the companies, as it may be done with such an aggregate indicator. In addition, this analysis and its findings pave the way for a potential future research direction, namely: knowing that there are some international companies which are already recognized among theoreticians and practitioners as knowledge-based companies, values for the original 10 indicators in these firms could be obtained, and then these aggregate indicators could be calculated.
When knowing the IA values for these firms, with international recognition of their status, any organization can be compare with them (via IA for the companies) and robust statements can be made regarding their status as knowledge-based organization.
References
Argyris, C. (1998). Teaching Smart People How to Learn, Harvard Business Review on Knowledge Management, Harvard Business School Press, USA.
Publisher
Dalkir, K. (2011). Knowledge Management in Theory and Practice. 2nd ed., The MIT Press, London.
Publisher – Google Scholar
Dedu, V., Armeanu, D. & Enciu, A. (2009). “Using the Multivariate Data Analysis Techniques on the Insurance Market,”Romanian Journal of Economic Forecasting, 4, 170-9.
Publisher – Google Scholar
Garvin, D. A. (1998). ‘Building a Learning Organization,’ Harvard Business Review on Knowledge Management, Harvard Business School Press, USA.
Geisler, E. & Wickramasinghe, N. (2009). Principles of Knowledge Management: Theory, Practice and Cases, M. E.Sharpe, New York.
Publisher
Harvard Business Review on The Innovative Enterprise (2003). Harvard Business School Press.
Google Scholar
Nicolescu, O. & Nicolescu, C. (2011). Organizatia si Managementul Bazate pe Cunostinte, Pro Universitaria, Bucharest.
Publisher
Noe, R. A. & McGraw-Hill, I. (2010). ‘Employee Training and Development,’ Fifth Edition, Irwin Professional Pub, USA.
Nonaka, I. (1998). The Knowledge-Creating Company, Harvard Business Review on Knowledge Management, Harvard Business School Press, USA.
Publisher
O’Dell, C. & Hubert, C. (2011). The New Edge in Knowledge — How Knowledge Management is Changing the Way we do Business, John Wiley & Sons, USA.
Publisher – Google Scholar
Russu, C., Dumitrescu, M. & Plesoianu, G. (2008). ‘Calitatea Managementului Firmei,’ Economica, Bucharest.
Google Scholar
Ruxanda, G. (2001). ‘Analiza Datelor,’ ASE, Bucharest.
Google Scholar
Saint-Onge, H. & Armstrong, C. (2004). The Conductive Organization: Building Beyond Sustainability, Elsevier, USA.
Publisher – Google Scholar
Schwartz, D. G. (2006). Encyclopedia of Knowledge Management, Idea Group Reference, USA.
Publisher – Google Scholar
Smith, L. I. (2002). A Tutorial on Principal Componets Analysis. [pdf] Available at: [Accessed 20 July 2012]
Publisher
Takeuchi, H. & Nonaka, I. (2004). ‘Hitotsubashi on Knowledge Management,’ John Wiley & Sons, Singapore.
Google Scholar
Wikipedia, 2012. Principal Component Analysis. [online] Available at: ‹http://en.wikipedia.org/wiki/Principal_component_analysis#Discussion”º [Accessed 20 July 2012]
Publisher