Profitability and Indianapolis Retail Gasoline Stations as Multi-product Firms
Since most gasoline stations in Indianapolis are multi-product firms, selling convenience goods is an important part of their overall profitability. Doyle et al. (2010) argues that gasoline stations that operate convenience stores have a greater incentive to undercut competitors during the undercutting phase of an Edgeworth price cycle. While growth in variable profits from gasoline sales increase at a decreasing rate the closer prices get to marginal cost, this can be offset by the gain in additional customers purchasing convenience goods that have higher profit margins. However, with technological improvements allowing customers to pay for gasoline at the pump, the additional profit from selling convenience goods may be less than stations expect8.
Many customers will purchase convenience goods with no intention of buying gasoline. As long as the transaction costs of convenience store purchases are less than the alternative, such as driving to a distant grocery store, gasoline stations profits will rise. These stations enjoy higher profit margins on the sale of convenience goods while the customer lowers transaction costs.
Gasoline stations that sell convenience goods in the Indianapolis market have faced additional competitive pressure from grocery chains such as Kroger and Walmart. These chains will engage in non-price competition by offering “loyalty points” earned from grocery purchases. When customers accumulate enough points based upon the amount of their expenditures, they are entitled to discounted gasoline prices. Grocery chains offer products at lower prices compared to convenience stores due to economies of scale. This results in lower profit margins per-unit for these chains. However, these lower margins are offset by a high volume of sales making overall profits larger compared to convenience stores.
What is the likely result of the intense competition gas stations face in Indianapolis? The outcome is a relatively fast cycle period during the Edgeworth undercutting phase, as gasoline stations aggressively undercut one another, attempting to increase variable profits and capture higher profit margins from convenience good sales. At the same time, Kroger and Walmart attempt to capture profits from convenience store operations by rewarding consumers with lower prices for groceries and gasoline.
The challenge for Indianapolis consumers is to lower overall costs for groceries and gasoline by planning purchases in advance, reducing the need to patronize gasoline stations with convenience stores. Many consumers find it difficult to plan all purchases and will attempt to lower transaction costs on occasion by patronizing convenience stores. To the extent that gasoline stations can lure these customers to their convenience store by aggressively undercutting their competitor during the cycle period, they will enjoy higher variable profits from gasoline sales and healthy profit margins from the sale of convenience goods.
Price Leadership and Edgeworth Price Cycles
Coordinating the Edgeworth price cycle mechanism in the Indianapolis retail gasoline market depends on how effectively price signals are communicated to market participants.
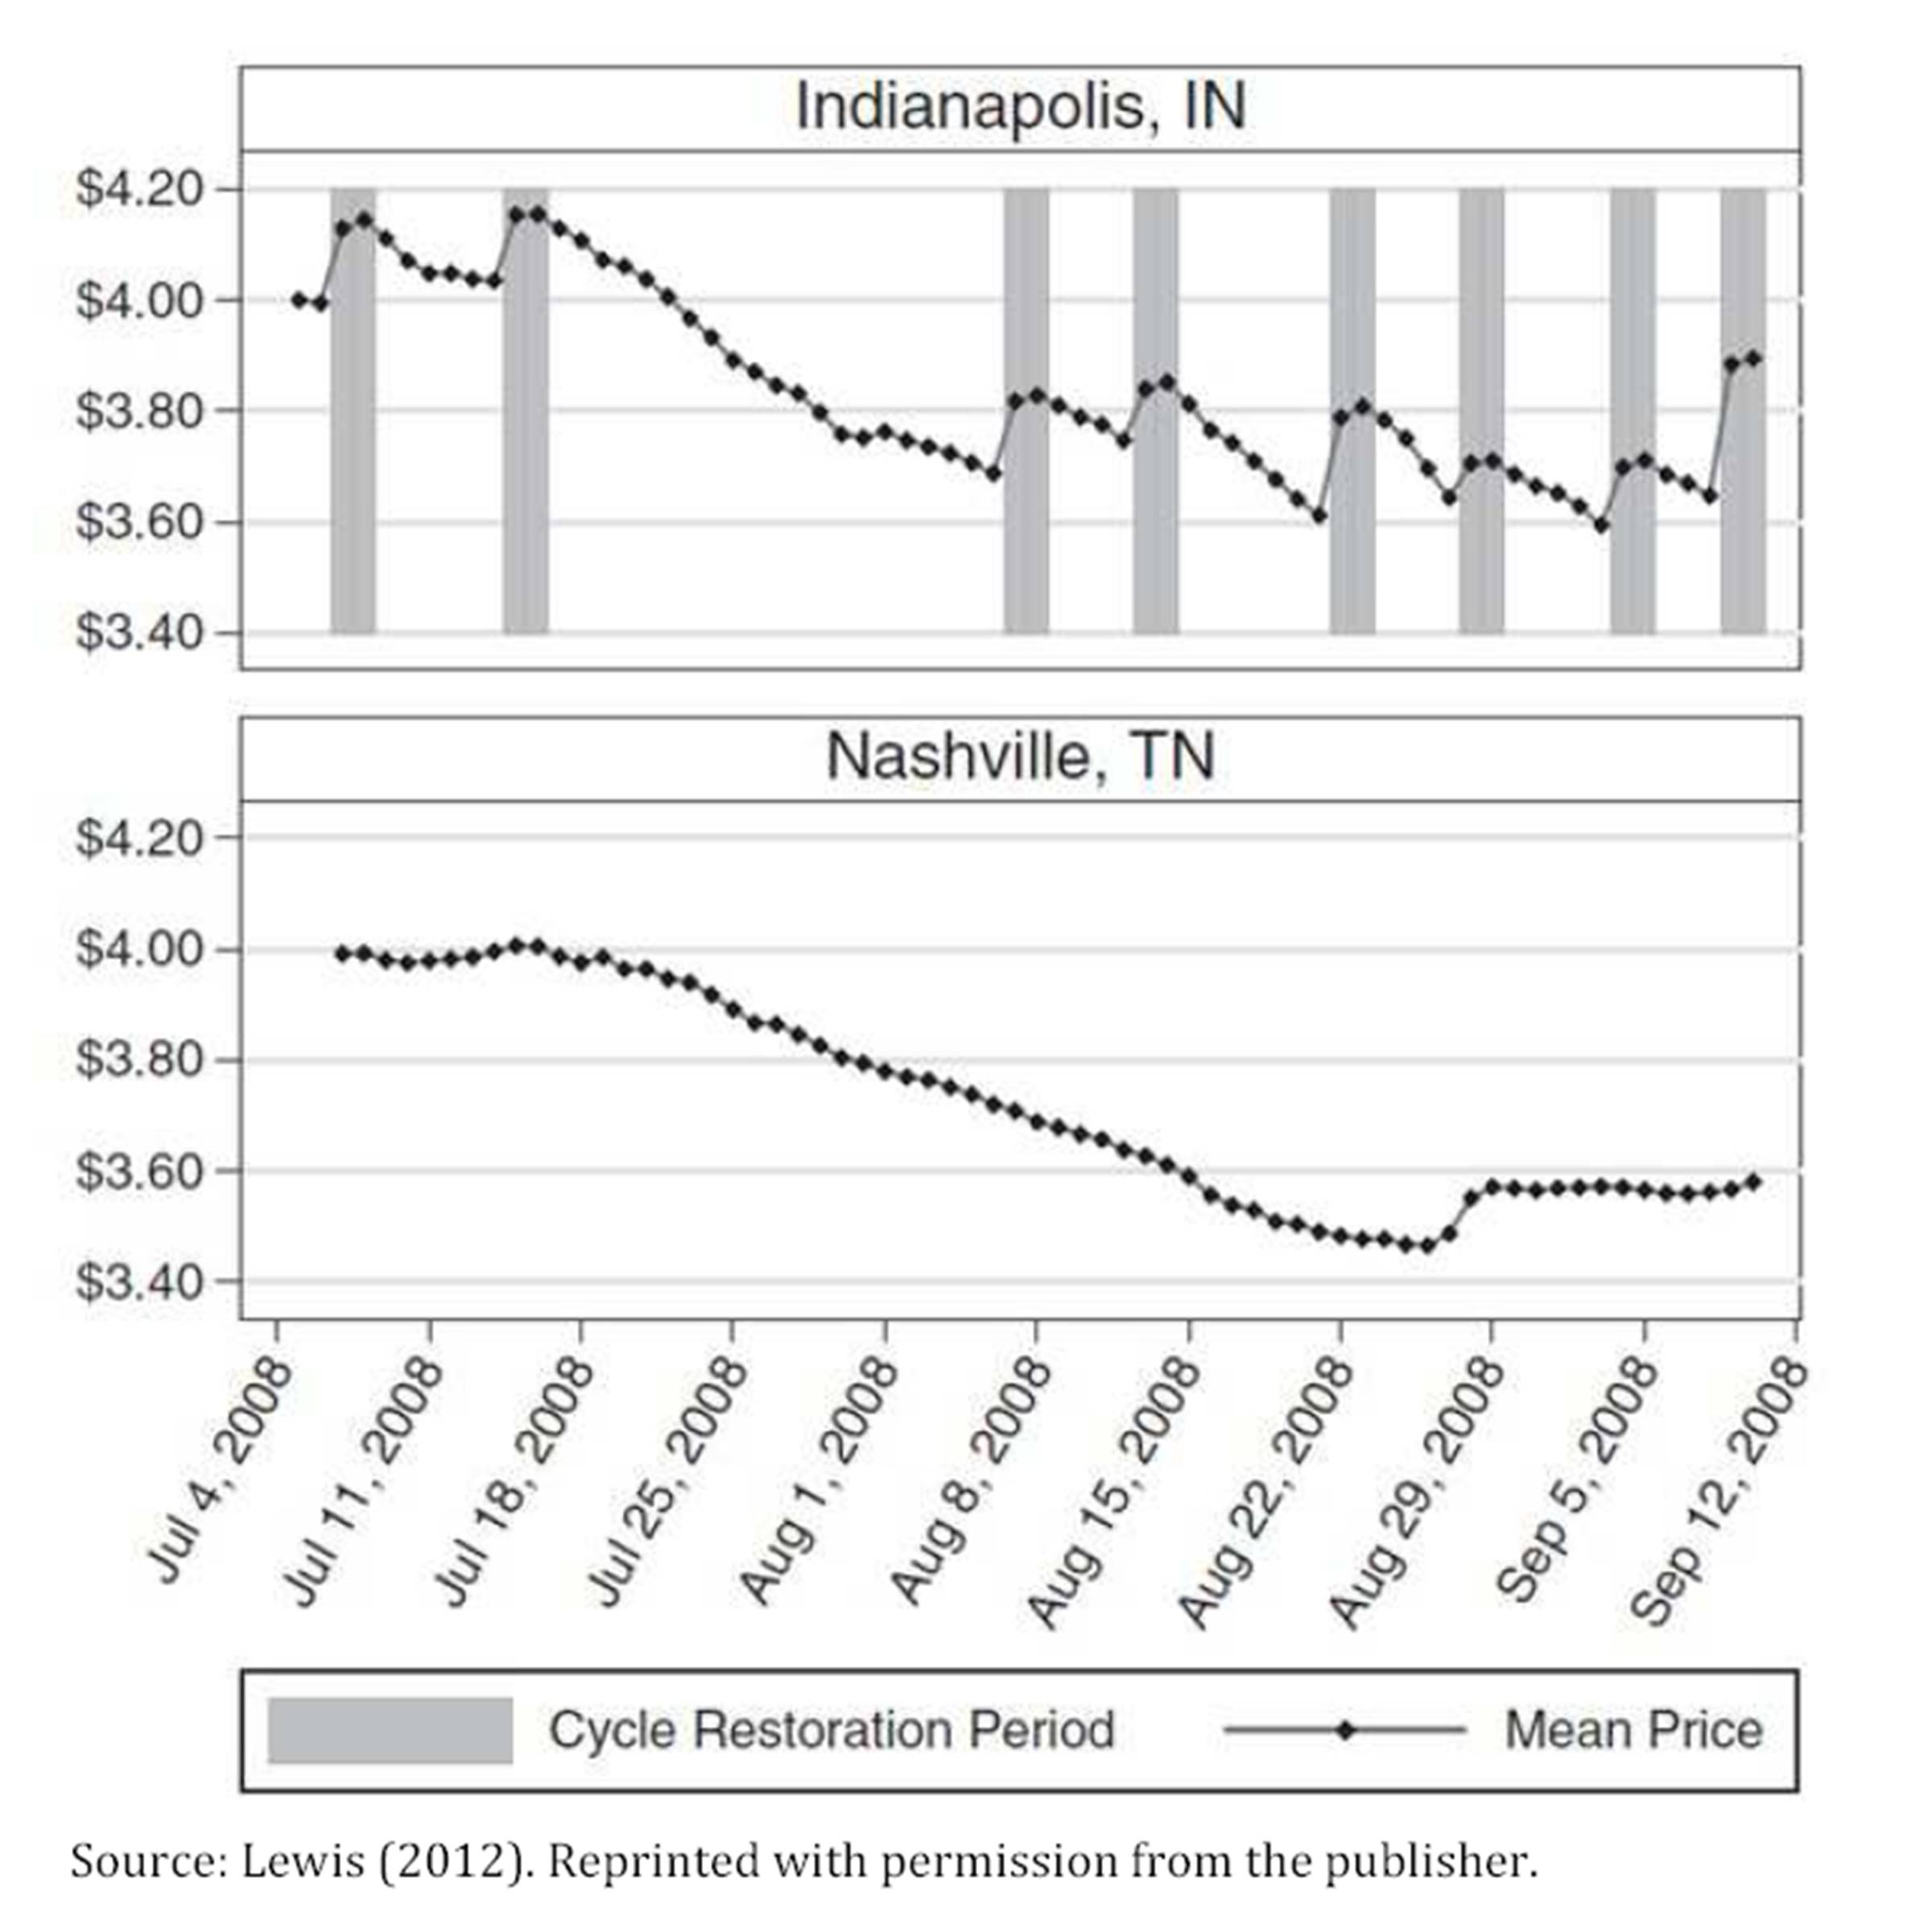
Lewis (2012) observes that price cycles occur when a leader retailer holds significant market share. Large firms are often viewed as more natural and effective leaders, especially during price restoration periods (Noel, 2007a). Firms with many gasoline stations and larger capacity fuel storage tanks per station often dominate a market as price leader. Speedway’s market share in Indianapolis is over 10 percent (Lewis, 2012). As a recognized price leader, it coordinates citywide price restorations by unifying stations’ prices on the day of restoration to signal and solidify the new market price level. To reinforce this signal, Speedway will simultaneously restore prices in its larger Midwestern operating region. Speedway can use their network of stations to signal the start of a restoration period to their spatially diverse competition (Byrne and Ware, 2013). Observational evidence suggests there is a high level of awareness and willingness of Speedway’s competitors to quickly respond to its initiation of a price increase during the restoration phase of an Edgeworth price cycle.
Market level price dispersion narrows once a successful price restoration is completed. However, when Speedway begins to initiate the undercutting phase of the cycle, price dispersion begins to rise. Price variation rises as the undercutting phase progresses as Speedway and other stations attempt to compete with local stations in different neighborhoods (Lewis, 2012). For example, within the Indianapolis market, observational evidence suggests price dispersion increases as one move from an intersection, to street, to the edge of the city.
Speedway’s Role as a Price Leader
In order for Speedway to serve as an effective price leader in the Indianapolis retail gasoline market, it must solve two problems: 1) it must be able to initiate a collusive arrangement and 2) it must determine how to implement a collusive agreement (Green et al. 2013).
It is unknown how Speedway might initiate an agreement among competitors. Green et al. (2013) indicates that competing stations may observe and react repeatedly to Speedway’s price changing behavior. In fact, this type of learning behavior could arise spontaneously in a highly concentrated market. Also, competing stations may simply “blunder” into a cyclical equilibrium by accident.
Fundamentally, some type of communication is required during the initiation and implementation stages of a price leadership regime. Tacit collusion is the commonly observed method of communicating within an oligopoly coordinated by a price leader (Harrington, 2012). As a communication strategy, tacit collusion involves indirect or implicit communication with competitors in order to avoid violation of U.S. anti-trust laws.
It is difficult to precisely characterize the market conditions that must be present in order for Speedway to establish its collusive intent. Perhaps its visibility, gasoline capacity per station, and its relatively large number of stations is sufficient to establish its role as price leader (Deneckere and Kovenock, 1992).
How does the Indianapolis retail gasoline market decide on what type of mechanism will be used to maximize the joint profits of gasoline stations and distribute them equitably? Establishing a cyclical equilibrium in order to extract consumer surplus and distribute this surplus in the form of higher variable profits to the retail gasoline oligopoly is the implementation challenge for Speedway as a price leader.
Observational evidence indicates that Speedway implements the price cycle mechanism by initiating both price increases during the relenting phase, as well as price decreases during the undercutting phase. During the war of attrition that occurs prior to the relenting phase, Speedway must forecast the likely time when its average competitor becomes capacity constrained and then restore the monopoly level price, allowing competitors time to replenish gasoline supplies. Relenting price increases are not typically small in the cycle equilibrium, because such a move would cause Speedway to lose market share (Wang, 2005). Monopoly level price increases serve as a strategic benefit as variable profits per gallon of gasoline sold increases (price effect) at each station. Also, those firms with multiple stations earn higher variable profits per gallon of gasoline sold (scale effect).
When Speedway initiates the undercutting phase of the cycle, price decreases tend to be small and frequent. These price decreases are not designed to punish competitors (Wang, 2005). Speedway’s price cuts are quickly followed by its competitors as they travel back to the bottom of the cycle. Variable profits increase at a decreasing rate, while the increase in the complementary sale of convenience goods adds to the marginal profit of gasoline stations.
Tacit collusion is self-sustainable if and only if gasoline stations put sufficient weight on future profits. Stations that have a lower discount rate (impatient stations) put more emphasis on short-run profits whereas those with a higher discount rate (patient stations) focus more on future profits.
Speedway must lead the distribution of gasoline stations in the Indianapolis market through the cycle equilibrium based upon the optimal discount rate in order to insure an equitable distribution of profits (Ivaldi et al. 2003).
The welfare gains to Indianapolis gasoline stations in a cyclical equilibrium are in the form of supra-normal profits. Given that this is a concentrated market, information costs are relatively low, helping to insure enforcement. However, the next section will explore how better informed consumers could affect the duration and amplitude of the cycle equilibrium. If consumers learn to time their gasoline purchases more strategically, it could diminish the duration and amplitude of the price cycle (Noel, 2007a). Consumer learning could potentially cause the Edgeworth price cycle to collapse. The result would be a convergence towards a competitive equilibrium. This would allow consumers to re-capture some of their surplus and move Indianapolis gasoline stations closer to normal profit levels.
Welfare Gains from Consumer Search and Learning
The existence of Edgeworth’s cyclical equilibrium in the Indianapolis retail gasoline market requires that the distribution of heterogeneous consumer preferences match the distribution of prices. Clearly, consumers have incentives to disrupt the cycle equilibrium by responding to non-price competition such as loyalty rebates at Kroger or Walmart. They could also re-capture their consumer surplus by more strategically timing their gasoline purchases.
Gasoline stations in the Indianapolis market can successfully practice intertemporal price discrimination because some consumer groups are impatient, myopic or simply make gasoline purchases randomly. The variation in price sensitivity across consumer groups also contributes to the Edgeworth price cycle (Ekert, 2013). Clearly, it is easier for consumers to search for the lowest gasoline price when there is a high density of stations (Noel, 2007b). However, as price dispersion increases during the undercutting phase of the cycle, there is less price transparency causing search costs to rise. The willingness of consumers to search is also influenced by the magnitude of currently observed and past price changes (Ekert, 2013).
Indianapolis consumers may adopt different gasoline search strategies. These strategies use various amounts of information and may or may not be related to the timing of the price cycle. Noel (2011b) offers five possible consumer search strategies:
a. Myopic Strategies: Indianapolis consumers may 1) purchase gasoline when their fuel gage reading falls below a comfortable level, 2) choose a station with no queue, 3) purchase gasoline from a preferred major brand or independent station.
b. Position Based Strategies: Consumers 1) check wholesale and retail prices and calculate the current position of the cycle, 2) purchase gasoline when the price reaches a given threshold.
c. Spike and Wait Strategy: Consumers purchase gasoline a fixed number of days after the last observed price increase.
d. Spike and Buy Strategy: When consumers observe a large price difference between any two stations, they will buy from their preferred station if it has the low price or a nearby station with the lowest price.
e. Calendar Based Strategy: Consumers purchase gasoline at a specific time given that they know cycle periods are serially correlated.
Indianapolis consumers may adopt any one of the above strategies or choose a hybrid one. For some consumer groups, the non-monetary search costs related to time and effort may overwhelm the monetary gains from adopting a gasoline search strategy (Noel, 2011b). While the model illustrated in Figure 3 does not directly specify the non-monetary costs of intertemporal substitution of gasoline purchases, Noel (2011b; 2012) indicates these costs include:
a. The cost of collecting price information that is necessary to predict the timing of the troughs under most timing strategies.
b. The cost of extra visits to the gasoline station to fill a consumer’s fuel tank.
c. The cost of queuing.
d. The utility cost of brand switching.
As long as these costs are less than the benefits of adopting timing strategies, consumers willing to pay higher prices may even find it optimal to choose a lower price strategy.
Using Public Policy to Improve Consumer Welfare
When examining potential consumer welfare gains from Edgeworth price cycles, one can look at differences between cycling and non-cycling cities and within cycling cities. Doyle, et al. (2011) estimated that cycling cities in the Midwest (including Indianapolis) had, on average, lower prices by 1 to 2 cents per gallon compared to non-cycling cities. Using daily data from April 1, 2000 to March 31, 2001, they found that cycling cities have price cycles that spend about equal time above and below the price levels in non-cycling cities.
If all consumers within the Indianapolis market were homogeneous and equally informed, the average price paid for 1 gallon of fuel would be lower compared to a market with heterogeneous consumer preferences. In practice, consumer groups have different time preferences, price elasticity of demands, and degree of myopia. Therefore, it may be very difficult for all groups to re-capture their consumer surplus.
Impatient consumers with low discount rates and more inelastic demands may not respond to price cycle information. Lack of learning is surprising, given the general interest in gasoline prices (Noel, 2011b). However, if gasoline stations’ attempt to charge a higher than monopoly price during price restorations, consumer groups may invest in learning how to time their gasoline purchases (Noel, 2007a).
Clearly, welfare gains could be realized by informing myopic consumers of the existence of price cycles. Public policy should focus on increasing the awareness of these cycles in Indianapolis by providing accessible information to consumers giving them an opportunity to reduce their myopia and improve welfare.
Public service announcements, letters to the editor, and local television station broadcasts have a large reach across the Indianapolis retail gasoline market. Web-site information posting daily gasoline prices at branded and independent stations is available from GasBuddy9.
Informing consumers of timing strategies needed to take advantage of cycles would lead to a re-optimization towards a new long-run gasoline price equilibrium (Noel, 2007a, 2011b). A greater awareness of price cycles, coupled with faster learning, could reduce their duration and amplitude in the Indianapolis market. This would at least allow myopic consumers to recover some of their surplus, while moving gasoline stations profits closer to a normal level. The result would be improved economic efficiency in the Indianapolis retail gasoline market.
Conclusion
Empirical and observational evidence indicate the existence of Edgeworth price cycles in the Indianapolis retail gasoline market.
The dynamic nature of these cycles results in a cyclical equilibrium. This type of equilibrium generates a sequence of prices creating a pathway gasoline stations can follow. This allows stations to increase their variable profits by capturing consumer surplus from a distribution of consumer groups with heterogeneous preferences.
Price leadership provided by Speedway insures that competing stations within the Indianapolis retail gasoline oligopoly are able to earn supra-normal profits.
Public policy should focus on increasing the awareness of price cycles, especially to myopic consumer groups. This would give them an opportunity to re-capture some consumer surplus and lead to more normal profit levels in the Indianapolis retail gasoline market.
Economic efficiency would be enhanced by reducing the duration and amplitude of these cycles. The result would be gains to consumer welfare moving the Indianapolis retail gasoline market closer to a competitive equilibrium.
Acknowledgements
I thank an anonymous referee for providing useful comments on an earlier draft of this paper. Also, I thank Anna Lang and Traci L. Moyer for technical research assistance.
Notes
1For surveys of theories of oligopoly see Shapiro (1989) and Friedman (1983).
2Maskin and Tirole (1988) formalized Edgeworth’s theory by developing a more mathematically rigorous treatment of the model and some implications.
3This result is not necessarily characteristic of an Edgeworth price cycle equilibrium. The model proposed by Maskin and Tirole (1988) predicts that the price at the top of the cycle may be above or below the monopoly price and many amplitudes are possible in equilibrium.
4Details of data sources are available in Lewis (2012).
5Most stations sell gasoline with three octane levels as well as diesel fuel.
6This stylized model builds upon and extends a model proposed by Pindych and Rubinfeld (2013). I ignore fixed costs that are independent of gasoline stations’ fuel output decisions.
7Incremental variable profit (Δπ) = (P-MC) ΔQ. I ignore residual consumer surplus. For example, I ignore area (DFI) + area (FHU) + area (HJV) + area (JLR). This residual consumer surplus results from discontinuities in gasoline quantities as these quantities represent different consumer groups based upon their purchase timing decisions. If Figure 3 was a model of a monopolist practicing perfect first-order price discrimination, all residual consumer surplus would be eliminated because the monopolist could charge each and every individual customer a different price for each marginal quantity (gallon) of gasoline sold, e.g. quantities between Qt+3 and Qt+4, and Qt+4 and Qt+5, etc. Total variable profit is the sum of all Δπ’s. Total Profit = Total variable profit — Total fixed costs.
8Stations’ however, heavily advertise products at each point-of-sale gasoline pump to induce consumer purchases of convenience goods in their establishments. If this advertising is successful, stations’ profits would rise. This however, would defeat the purpose of customers paying for gasoline at point-of-sale pumps in an effort to reduce transaction costs.
9For daily Indianapolis gasoline price information from GasBuddy see: http://gasbuddy.com/Gas_Prices/Indiana/Marion/index.aspx
References
1. Byrne, D.P. and R. Ware (2013). Price Coordination and Consumer Search in Gasoline Markets with Price Cycles. [Online]. Retrieved June 3, 2013. Available: http://ssrn.com/abstract=1903558
2. Deneck, R.J. and D. Kovenock (1992). ‘Price Leadership’, The Review of Economic Studies 59, 143-162.
Publisher
3. Doyle, J., E. Muehlegger, and K. Samphantharak (2010). ‘Edgeworth Cycles Revisited’, Energy Economics 32, 651-660.
Publisher
4. Eckert, A. (2013). ‘Empirical Studies of Gasoline Retailing: A Guide to the Literature’, Journal of Economic Surveys 27, 140-166.
Publisher
5. Edgeworth, F.Y. (1925). ‘The Pure Theory of Monopoly’, in Papers Relating to Political Economy, Vol. 1, London, MacMillan, 111-142.
6. Friedman, J. (1983). ‘Oligopoly Theory’, Cambridge Surveys of Economic Literature, Cambridge, Cambridge University Press.
Publisher – Google Scholar
7. Green, E.J., R.C. Marshall and L.M. Marx (2013). Tacit Collusion in Oligopoly. [Online]. Retrieved June 5, 2013. Available: https://faculty.fuqua.duke.edu/~marx/bio/papers/tacitcollusion.pdf
8. Harrington, J.E. (2012). A Theory of Tacit Collusion. [Online]. Retrieved June 5, 2013. Available: http://www.econ.jhu.edu/People/Harrington
9. Ivaldi, M., B. Jullien, P. Rey, P. Seabright and J. Tirole (2003). ‘The Economics of Tacit Collusion’, Final Report for DG Competition, European Commission, IDEI, Toulouse.
10. Lewis, M.S. (2012). ‘Price Leadership and Coordination in Retail Gasoline Markets with Price Cycles’, International Journal of Industrial Organization 30, 342-351.
Publisher
11. Maskin, E. and J. Tirole (1988). ‘A Theory of Dynamic Oligopoly, II: Price Competition, Kinked Demand Curves and Edgeworth Cycles’, Econometrica 56, 571-599.
Publisher
12. Noel, M.D. (2007a). ‘Edgeworth Price Cycles: Evidence from the Toronto Retail Gasoline Market’, The Journal of Industrial Economics 60, 69-92.
Publisher
13. Noel, M.D. (2007b). ‘Edgeworth Price Cycles, Cost-Based Pricing and Sticky Pricing in Retail Gasoline Markets’, The Review of Economics and Statistics 89, 324-334.
Publisher – Google Scholar
14. Noel, M.D. (2011a). ‘Edgeworth Price Cycles’ in S.N. Durlauf and L.E. Blume, eds., The New Palgrave Dictionary of Economics. [Online]. Palgrave MacMillan. Retrieved June 3, 2013. Available: http://www.dictionaryofeconomics.com/article?id=pde2011_E000331
15. Noel, M.D. (2011b). ‘Edgeworth Price Cycles and Intertemporal Price Discrimination’, [Online]. Retrieved June 7, 2013. Available: http://dss.ucsd.edu/~mdnoel/research/NOEL_pricediscrimination.pdf
16. Noel, M.D. (2012). ‘Edgeworth Price Cycles and Intertemporal Price Discrimination’, Energy Economics 34, 942-954.
Publisher
17. Pindyck, R.S. and D.L. Rubinfeld (2013). Microeconomics, 8th Ed., Boston: Pearson Prentice Hall.
18. Shapiro, C. (1989). ‘Theories of Oligopoly Behavior’, in Handbook of Industrial Organization, Vol. 1, Chapter 6, R. Schmalensee and R.D. Willig, eds., Elsevier Science B.V.
Publisher
19. Vives, X., (1993). ‘Edgeworth and Modern Oligopoly Theory’, European Economic Review 37, 463-476.
Publisher
20. Wang, Z. (2005). ‘Edgeworth Price Cycle and Oligopoly Coordination: Trial Evidence from Australia’, [Online]. Retrieved June 5, 2013. Available: http://www.economics.neu.edu/papers/documents/05-004.pdf
21. Zimmerman, P.R. and J.M. Yun (2013). ‘Edgeworth Price Cycles in Gasoline: Evidence from the United States’, Review of Industrial Organization 42, 297-320.
Publisher