Introduction
According to Turban et. (2011), Business Intelligence can be defined as “a set of methodology that turns the raw data to useful information to the right people, and right time”. BI can be defined as “black box” that transforms the raw data from data source to useful information and displays the graphical representation to allow the user view business performance and hence improve decision making.
There has been a fast growing interest in BI area in the new century, but the success for implementing BI is still a questionable (Ang & Teo 2000; Lupu et.al (1997); Computerworld (2003)). Lupu et.al (1997) reported that about 60%-70% of business intelligence applications fail due to the technology, organizational, cultural and infrastructure issues. Furthermore, EMC Corporation argued that many BI initiatives have failed because tools weren’t accessible through to end users and the result of not meeting the end users’ need effectively. Computerworld (2003) stated that BI projects fail because of failure to recognize BI projects as cross organizational business initiatives, unengaged business sponsors, unavailable or unwilling business representatives, lack of skilled and available staff, no business analysis activities, no appreciation of the impact of dirty data on business profitability and no understanding of the necessity for and the use of meta-data. A maturity model is needed to provide systematic maturity guidelines and readiness assessment for such resourceful initiative. While there are many BI maturity models in the literature but most of them do not consider all factors affecting on BI. Some of BI maturity models focus on the technical aspect and some of the models focus on business point of view.
Therefore, this research seeks to bridge this missing gap between academia and industry, through a thorough formal study of the key dimensions and associated factors pertaining to Enterprise Business Intelligence (EBI). It aims to investigate the dimensions and associated factor for each maturity level. The remainder of this paper has been structured as follows; the next section discusses the review of BI maturity models, the third section then outlines and discusses the proposed EBIM model, then followed by a case study in one of the financial companies.
Literature Review
There are many Business Intelligence maturity models developed by different authors such as Business intelligence Development Model (BIDM), TDWI’s maturity model, Business Intelligence Maturity Hierarchy, Hewlett Package Business Intelligence Maturity Model, Gartner’s Maturity Model, Business Information Maturity Model, AMR Research’s Business Intelligence/ Performance Management Maturity Model, Infrastructure Optimization Maturity Model and Ladder of business intelligence (LOBI). This section reviewes several of business intelligence maturity models by different authors.
Table 1: Summary of Various BI Maturity Models
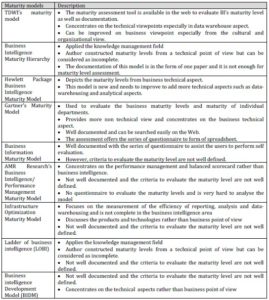
Table 1 above depicts a summary of various business intelligence maturity models. As shown in the table 1, the majority of the models does not focus on the business intelligence as entire which some of the models focus on the technical aspect and some of the models focus on business point of view. For example, TDWI’s model only concentrates on the data warehousing while Business Intelligence Maturity Hierarchy only concentrates on knowledge management. It is not complete to represent business intelligence. We know that business intelligence covers not only data warehousing, but also business performance, balanced scorecard, analytical components. In addition, the documentation of some maturity models above is not well defined and they do not provide any guidelines or questionnaire to evaluate maturity levels.
Proposed Framework
Based on the literature review above, the majority of the models does not focus on the business intelligence as entire which some of models focus on the technical aspect and some of the models focus on business point of view. If the organizations want to know exactly their business intelligence maturity levels as a whole, they have to use multiple models and that is time consuming. Hence, there is a need to have an integrated maturity model to combine existing different maturity model and questionnaires, and evaluation criteria should be provided. In view of this, an Enterprise Business Intelligence Maturity Model (EBI2M) is proposed.
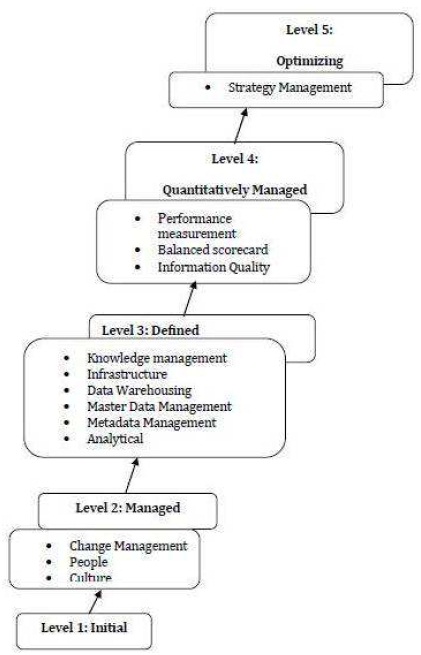
The proposed EBI2M consists of two representations: staged representation and continuous representation. The staged representation consists of five levels namely; initial, managed, defined, quantitatively managed and optimizing; all of which are adapted from CMMI maturity levels. There are thirteen key process areas, namely; change management, culture, strategic management, people, performance measurement, balanced scorecard, information quality, data warehousing, master data management, metadata management, analytical, infrastructure and knowledge management.
The continuous representation consists of thirteen dimensions (change management, culture, strategic management, people, performance measurement, balanced scorecard, information quality, data warehousing, master data management, metadata management, analytical, infrastructure and knowledge management) that adapted from various literature reviews such as Sen et.al (2006); Baskarada et.al (2006); Dyche and Levy (2009); Davenport and Harris (2007); Ferris (2008); Grembergen and Saull (2001); Kochilar (2000); Wettstein and Kueng (2002); Davis et.al (2006) ; Prosci (2004) ; Arveson et.al (2010) as well as Smith and Finger (2004).
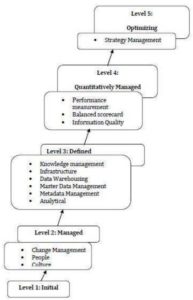
Fig1: Preliminary Enterprise Business Intelligence Maturity Model (EBI2M)
Developed by author
Methodology
The proposed Enterprise Business Intelligence Maturity model (EBI2M) was applied in the financial company in order to evaluate the maturity of BI implementation. This case study was prepared following a series of detailed interviews with staff, the collection of supporting documents and follow up interviews to clarify specific issues arising from the analysis of case study materials.
Table 2: Case Study’s Participate
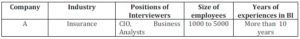
Company A is a very known insurance company in Malaysia. The headquarter is located in Kuala Lumpur and has more than 20 branches and outlets across Malaysia. Currently, the employees of the company are approximately 1000-5000. In 2011, the total revenue generated by company A is more than RM 200 million. Company A consists of MIS department which handles IT related jobs. Company A has more than ten years experience of using Business Intelligence (BI) application and has 11-15 persons to handle BI applications. The BI tools used in company A are Oracle, SAP and Informatics.
Results and Discussions
The respondents were instructed to rate their companies’ capabilities of BI implementation from level 0-5.
Below are the results of company A capabilities of BI implementation on thirteen dimensions
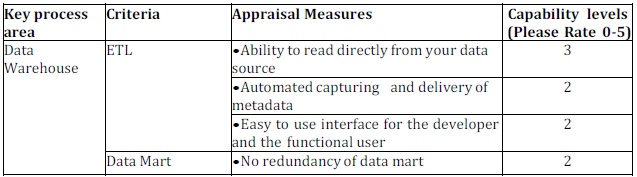
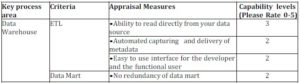
Data Warehouse Perspective
• The company has data warehouse and span across the enterprise.
• The company applied extract/transform/load (ETL) processes.
• The company uses automatic extraction all business data from various sources.
• The company has data marts and data warehouses which allow user to access information.
• The data in ETL are extracted and transformed on a consistent basis.
• The data platforms that the company used are integrated into a common, company -platform.
• The data warehouse in the company is not integrated with external parties, such as suppliers, customers or partners.
• The information in the company’s data warehouse is updated daily.
• The redundancy of dart mart in the company is seemed minimal.
• The data warehouse of the company is able to perform automatic capturing and delivery of metadata.
• The company has no strict rules or procedures for data management and is limited to system administrator.
• The company has semi automated system for integrating data from different sources.
• The enterprise data is available to any department that needs it.
• The data standard and definitions are set at enterprises level.
Table 3: Company A’s Data Warehouse Perspective
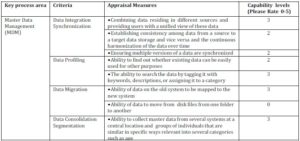
Master Data Management (MDM) Perspective
• The company is able to combine data residing in different sources and provides users with a unified view of these data.
• The company is not able to establish consistency among data from a source to target data storage and vice versa and continuous harmonization of the data over time.
• The company is able to ensure that multiple versions of data are synchronized.
• The company is able to search the data by tagging it with keywords, descriptions or assigning it to a category.
• The data in the company is able to move from disk files from one folder (or computer) to another with specific access right.
• The company is able to collect master data from several systems at a central location and groups of individuals that is similar in specific ways relevant into several categories.
Table 4: Company A’s Master Data (MDM) Perspective
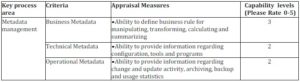
Metadata Management Perspective
• The company has no business metadata, technical metadata and operational metadata.
• The company does not implement any IT architecture for capturing and using business, technical and operational metadata.
• The company is able to define business rule for manipulating, transforming, calculating and summarizing.
• The company is able to provide information regarding configuration, tools and programs.
• The company is able to provide information regarding change and update activity, archiving, backup and usage statistics.
Table 5: Company A’s Metadata Management Perspective
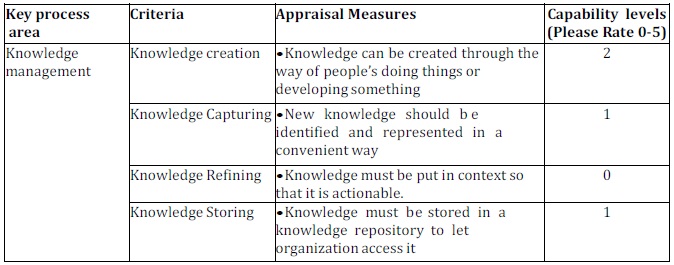
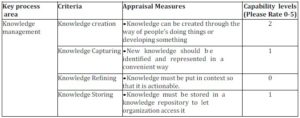
Knowledge Management Perspective
• The company is able to capture tacit knowledge.
• There is no tacit knowledge captured at the enterprise level to enable further learning.
• The company allows knowledge to be collated from different experts via Sharepoint.
• The company allows knowledge to be validated and maintained through forum and training.
• Knowledge in the company is shared across the enterprise through forum or training or corporate portal.
• Knowledge in the company can be created through the way of people’s doing things or developing something.
• The new knowledge in the company can be identified and represented in a convenient way but for certain context.
• Knowledge in the company cannot be put in context so that it is actionable.
• Knowledge in the company can be stored on a knowledge repository via corporate portal to let organization access it.
Table 6: Company A’s Knowledge Management Perspective
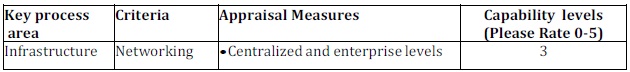
Infrastructure Perspective
• The company has centralized and enterprise levels infrastructure.
• The company provides improvement ideas campaign and daily operational feedback to improve operational systems.
• The partners, suppliers and customers have interactive role in the company’s information architecture.
Table 7: Company A’s Infrastructure Perspective

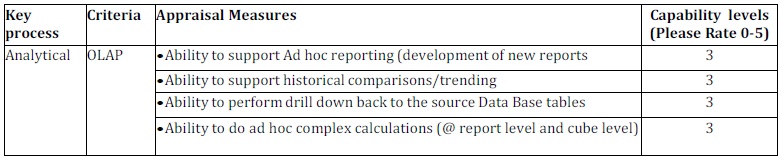
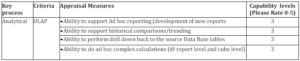
Analytical Perspective
• The company uses analytical or OLAP tools.
• The company is able to support Ad hoc reporting (development of new reports).
• The OLAP or analytical tool in the company is able to support historical comparison/treading.
• The company is able to perform drill down back to the source Data Base tables.
• The company is able to do ad hoc complex calculations (@ report level and cube level).
Table 8: Company A’s Analytical Perspective
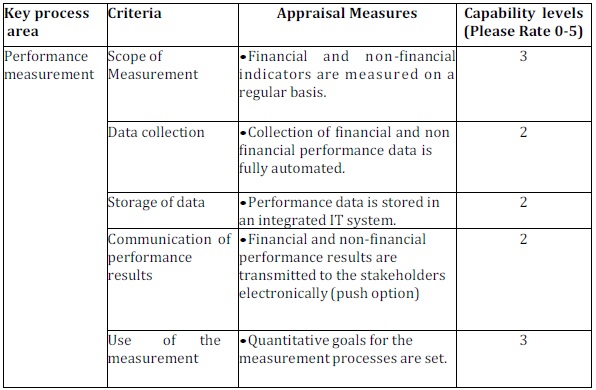
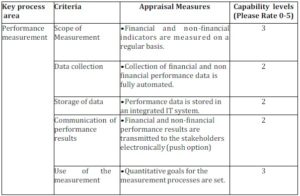
Performance Measurement Perspective
• The financial and non-financial indicators in the company are measured on a regular basic.
• The financial and non-financial performance data in the company is not fully automated.
• The performance data in the company is stored in an integrated IT system.
• The financial and non-financial performance results in the company are transmitted to the stakeholders electronically.
• The company has set the quantitative goals for the measurement process and each business unit has specific business target.
• The storage is managed at enterprise level.
Table 9: Company A’s Performance Measurement Perspective
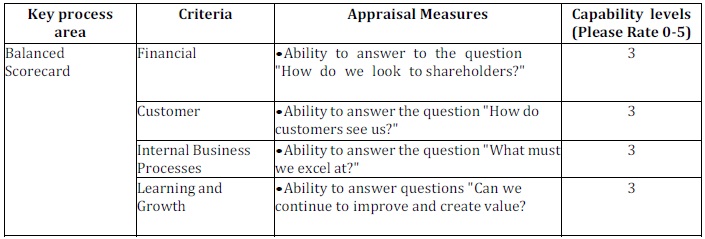
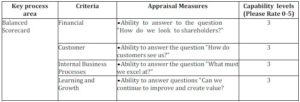
Balanced Scorecard Perspective
• The company’s balanced scorecard is able to answer “How do we look to shareholders?”
• The company’s balanced scorecard can get the feedback for clients.
• The company’s balanced scorecard enables the company to view their performance on monthly and yearly basic.
• The company’s balanced scorecard enables the company to continue improve based on the tread analysis.
Table 10: Company A’s Balanced Scorecard Perspective
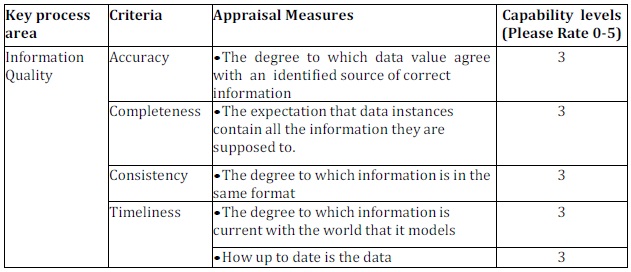
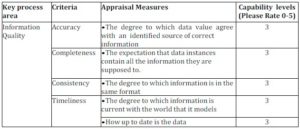
Information Quality (IQ) Perspective
• The company has a strategic value on data quality.
• The issue that affects data quality in the company is the source system is not integrated.
• In the company, respective head of department is responsible to ensure information quality.
• The data value of the company is quite close to the correct information.
• The company expects the data instances contain all the information they are supposed to.
• The company knows the importance the data accuracy across the organization.
• The data in the company is updated daily and near real time.
• Data definitions are standard across enterprise as it is resided in central server.
• There is inconsistency between data source across department or an enterprise.
Table 11: Company A’s Information Quality Perspective
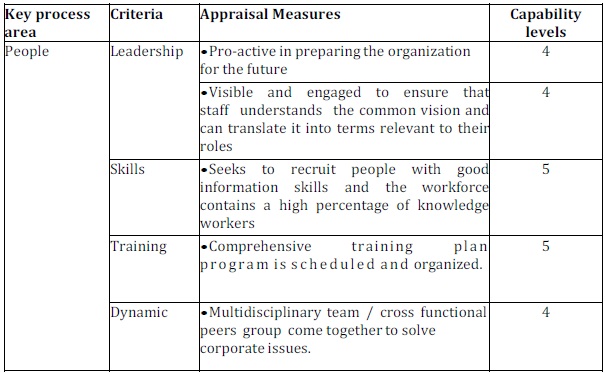
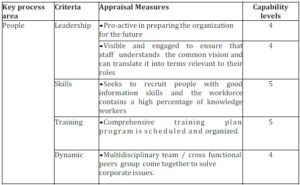
People Perspective
• The company is pro-active in preparing the organization for the future.
• The company is able to ensure that staff understands the common vision and can translate it into terms relevant to their roles.
• The company seeks to recruit people with good information skills and the workforce contains a high percentage of knowledge workers.
• The company has a comprehensive training plan program that is scheduled and organized through whole year.
• The company has multidisciplinary team / cross functional peers group that come together to solve corporate issues.
• The overall level of analytical skill and proficiency in using BI software is advanced level.
• The current skill is set adequate to meet the information needs of the company but can be further improved.
• The company typically hires people with these skills or develops them with training programs.
• The employees in the company gain information skills through formal training.
• The company has information skills training programs through portal and e-mail.
• All level of employee in the company has access to the training.
• The company makes overt efforts to attract and retain people with superior information skills.
• The leadership styles applied across the organization are empowerment, trust and mentor leadership.
• Teamwork is formalized within the organization and it is important to achieve company goal and targets.
Table 12: Company A’s People Perspective
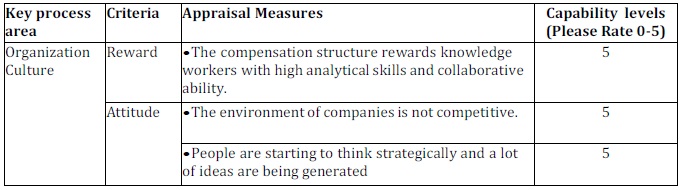
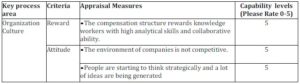
Organization Culture Perspective
• The company has compensation structure that rewards knowledge workers with high analytical skills and collaborative ability based on yearly appraisal key performance indicators (KPI).
• The environment of the company is very competitive.
• The people/staffs in the company start to think strategically and a lot of ideas and campaigns are being generated.
Table 13: Company A’s Organization Culture Perspective
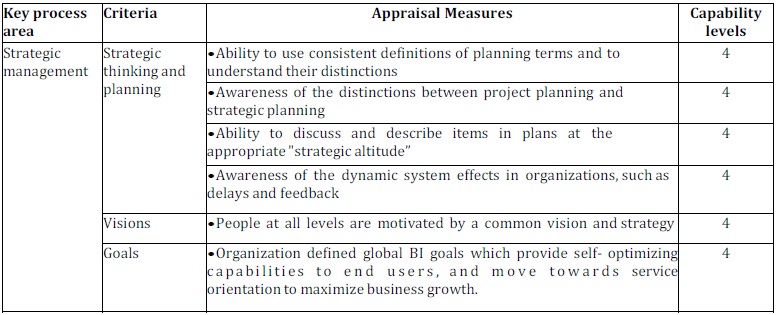
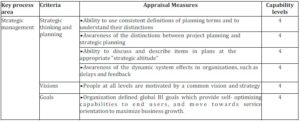
Strategic Management Perspective
• The company is able to use consistent definitions of planning terms and understand their distinctions.
• The company is aware of the distinctions between project planning and strategic planning.
• The staffs of the company at all levels are motivated by a common vision and strategy.
• The company defined any global BI goals which provide self optimizing capabilities to end users and move towards service orientation to maximize business growth.
• The company has individual goal that cascaded to the corporate or group goals.
• The company monitors their employee awareness of corporate goals through posters.
• The company uses dialogue and forum to ensure that people in the company understand strategic direction and the role they play in it.
Table 14: Company A’s Strategic Management Perspective
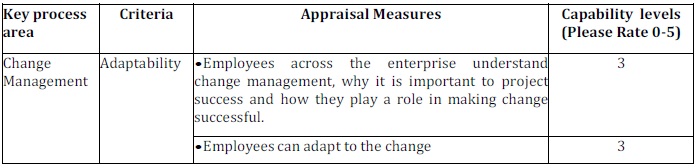
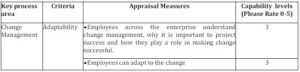
Change Management Perspective
• The company implemented a change management program in recent years but in non formal way.
• The employees across the company understand change management, and how they play a role in making change successful.
• The majority of the employees in the company adapt to the changes.
• People are willing to change their roles and responsibilities.
• People are willing to support a change in company strategy.
Table 15: Company A’s Change Management Perspective
Conclusions and Future Works
This paper proposes an EBI maturity model (EBI2M) to assist the organizations to identify the existing problems of BI implementation and plan a systematic path to evolve to higher levels of maturity. An EBI2M is evaluated through one of the financial companies. The result indicates that the company does not achieve highest maturity in terms of data warehouse, metadata management, knowledge management and performance measurement perspective.
Acknowledgment
The authors acknowledge the time and commitment of all participants in the case study.
(adsbygoogle = window.adsbygoogle || []).push({});
References
Ang, J. & Teo, T. S. H. (2000). “Management Issues in Data Warehousing: Insights from the Housing and Development Board,” Decision Support Systems. 29(1): 11-20.
Publisher – Google Scholar
Carlo, V. (2009). ‘Business Intelligence: Data Mining and Optimization for Decision Making,’ Wiley.
Google Scholar
Cates, J. E., Gill, S. S. & Zeituny, N. (2005). “The Ladder of Business Intelligence (LOBI): A Framework for Enterprise IT Planning and Architecture,” International Journal of Business Information system. 1(1): 220-238.
Publisher – Google Scholar
Chang, E. (2006). ‘Advanced BI Technologies, Trust, Reputation and Recommendation Systems,’ 7th Business Intelligence Conference (Organised by Marcus Evans), Sydney, Australia.
Google Scholar
Computerworld. (2003). ‘The Top 10 Critical Challenges for Business Intelligence Success,’ Computer world.
Google Scholar
Deng, R. (2007). “Business Intelligence Maturity Hierarchy: A New Perspective from Knowledge Management,” Information Management. http://www.information-management.com/ infodirect/20070323/1079089-1.html
Publisher
Eckerson, W. (2004). “Gauge Your Data Warehouse Maturity,” Information Management. viewed on 29. April 2009, <http://www.information-management.com/issues/20041101/1012391-1.html>.
Publisher
Faherty, V. (1979). “Continuing Social Work Education: Results of a Delphi Surved,” Journal of Education for Social Work. 15(1): 12-19.
Publisher – Google Scholar
Gartner Research. (2007). “Gartner EXP Survey of More than 1,400 CIOs Shows CIOs Must Create Leverage to Remain Relevant to the Business,” Retrieved 01/04/2009, from <http://www.gartner.com/it/page.jsp?id=501189>.
Publisher
Gartner Research. (2008). “Gartner EXP Worldwide Survey of 1,500 CIOs Shows 85 Percent of CIOs Expect Significant Change Over Next Three Years,” Retrieved 01/04/2009, from <http://www.gartner.com/it/page.jsp?id=587309>.
Publisher
Gartner Research. (2009). “Gartner EXP Worldwide Survey of More than 1,500 CIOs Shows IT Spending to Be Flat in 2009,” Retrieved 01/04/2009, from <http://www.gartner.com/it/page.jsp?id=855612>.
Publisher
Hagerty, J. (2006). “AMR Research’s Business Intelligence/ Performance Management Maturity Model, Version 2,” Viewed on 21 April 2009, <http://www.cognos.com/pdfs/analystreports/ar_amr_researchs_bi_perf.pdf >.
Publisher – Google Scholar
Hewlett-Packard. (2007). ‘The HP Business Intelligence Maturity Model,’ Viewed on 21 April 2009. <http://h71028.www7.hp.com/ERC/downloads/4AA1-5467ENW.pdf >.
Google Scholar
Hostmann, B. (2007). ‘Business Intelligence Scenario,’ Paper presented at the Gartner Business Intelligence Summit,
Google Scholar
IDC. (2007). ‘Top Ranked Business Intelligence Tools Vendors Maintain Positions,’ Viewed 03 Jul 2007, <http://www.idc.com/getdoc.jsp?containerId=prUS20767807>.
Juran, J. M., Gryna, F. M. J & Bingham, R. S. (1974). ‘Quality Control Handbook,’ 3 edn, McGraw-Hill Book Co, New York, NY.
Google Scholar
Kahn, B. K., Strong, D. M. & Wang, R. Y. (2002). “Information Quality Benchmarks: Product and Service Performance,” Communications of the ACM:184-192.
Publisher – Google Scholar
Kašnik, A. (2008). ‘Odel Optimization Infrastructure,’ Internal Material of ZRSZ, Ljubljana.
Ke, W. & Wei, K. K. (2008). “Organizational Culture and Leadership in ERP Implementation,” Decision support system: 208-218.
Publisher – Google Scholar
Loshin, D. (2003). ‘Business Intelligence: The Savvy Manager’s Guide,’ Morgan Kaufmann Publishers/Elsevier, Boston.
Google Scholar
Lupu, A. R., Bologa, R., Lungu, I. & Bara, A. (2007). “The impact of Organization Changes on Business Intelligence Projects,” Proceedings of the 7th WSEAS International Conference on Simulation, Modeling and Optimization, Beijing, China, September 15-17: 414-418.
Publisher – Google Scholar
Moss, L. & Atre, S. (2003). Business Intelligence Roadmap: The Complete Lifecycle for Decision-Support Applications, Addison-Wesley, Boston, MA.
Publisher – Google Scholar
Moss, L. T. & Hoberman, S. (2004). ‘The Importance of Data Modeling as a Foundation for Business Insight,’Teradata.
Google Scholar
Rajterič, I. H. (2010). ‘Overview of Business Intelligence Maturity Models,’ International Journal of Human Science. 15(1): 47-67.
Raskin, M. S. (1994). “The Delphi Study in Field Instruction Revisited: Expert Consensus on Issues and Research Priorities,” Journal of Social Work Education: 75-89.
Publisher – Google Scholar
Redman, T. C. (1998). “The Impact of Poor Data Quality on the Typical Enterprise,” Communications of the ACM. 41(2): 79-82.
Publisher – Google Scholar
Richardson, J., Schlegel, K., Sallam, R. L. & Hostmann, B. (2008). “Magic Quadrant for Business Intelligence Platforms,” Gartner.
Publisher – Google Scholar
Sacu, C. & Spruit, M. (2010). “BIDM: The Business Intelligence Development Model,” Proceedings of the 12th International Conference on Enterprise Information Systems, Funchal, Madeira-Portugal.
Publisher – Google Scholar
Simon, R. (2002). ‘Performance Measurement and Control Systems for Implementing Strategy,’ Prentice Hall.
Tayi, G. K. & Ballou, D. P. (1998). “Examining Data Quality,” Communications of the ACM. 41(2): 54-57.
Publisher – Google Scholar
Turban, E., Sharda, R., Aronson, J. E., & King, D. (2011). ‘Business Intelligence: A Managerial Approach,’ Prentice Hall.
Google Scholar
Turban, E. & Volonino, L. (2010). ‘Information Technology for Management: Transforming Organization In The Digital Economy,’ Wiley.
Google Scholar
Whitehorn, M. & Whitehorn, M. (1999). Business Intelligence: The IBM Solution Data warehousing and OLAP, Springer-Verlag, NY.
Publisher – Google Scholar
William, S. & William, N. (2007). “The Profit Impact of Business Intelligence,” Morgan Kaufmann Publishers, San Francisco.
Publisher – Google Scholar