Introduction
BI applications have appeared the top spending priority for many Chief Information Officers (CIO) and it remain the most important technologies to be purchased for past five years(Gartner Research 2007; 2008; 2009). Although there has been a growing interest in BI area, success for implementing BI is still a questionable (Ang & Teo 2000; Lupu et.al (1997); Computerworld (2003)). Lupu et.al (1997) reported that about 60%-70% of business intelligence applications fail due to the technology, organizational, cultural and infrastructure issues. Furthermore, EMC Corporation argued that many BI initiatives have failed because tools weren’t accessible through to end users and the result of not meeting the end users’ need effectively. Computerworld (2003) stated that BI projects fail because of failure to recognize BI projects as cross organizational business initiatives, unengaged business sponsors, unavailable or unwilling business representatives, lack of skilled and available staff, no business analysis activities, no appreciation of the impact of dirty data on business profitability and no understanding of the necessity for and the use of meta-data. A maturity model is needed to provide systematic maturity guidelines and readiness assessment for such resourceful initiative. While there are many BI maturity models in the literature but most of them do not consider all factors affecting on BI. Some of BI maturity models focus on the technical aspect and some of the models focus on business point of view.
Therefore, this research seeks to bridge this missing gap between academia and industry, through a thorough formal study of the key dimensions and associated factors pertaining to Enterprise Business Intelligence (EBI). It aims to investigate the dimensions and associated factor for each maturity level. The remainder of this paper has been structured as follows. The next section discusses the components of Business Intelligence (BI), Capability Maturity Model (CMMI) as well as review of BI maturity models. The third section then outlines and discusses the proposed EBIM model, then follows by empirical research.
Literature Review
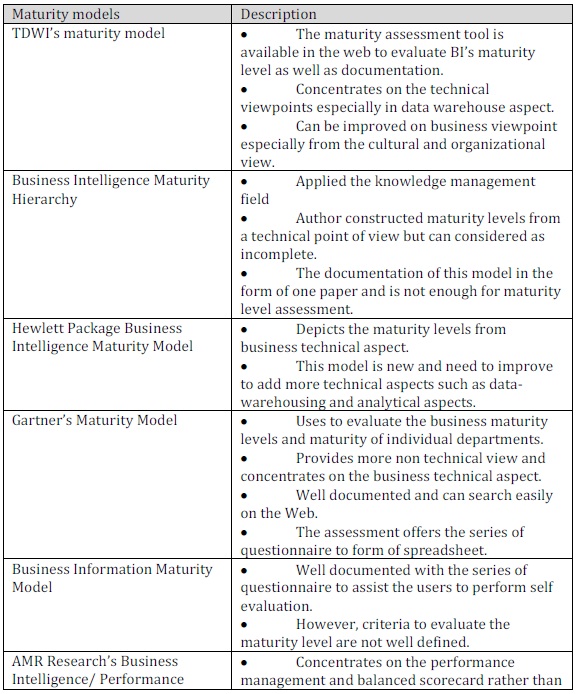
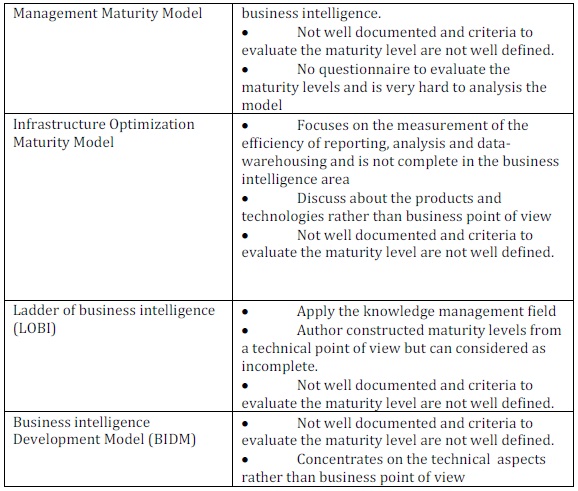
There are many Business Intelligence maturity model developed by different authors such as Business intelligence Development Model (BIDM), TDWI’s maturity model, Business Intelligence Maturity Hierarchy, Hewlett Package Business Intelligence Maturity Model, Gartner’s Maturity Model, Business Information Maturity Model, AMR Research’s Business Intelligence/ Performance Management Maturity Model, Infrastructure Optimization Maturity Model and Ladder of business intelligence (LOBI). This section reviewed several of business intelligence maturity models by different authors.
Table 1: Summary of Various BI Maturity Models
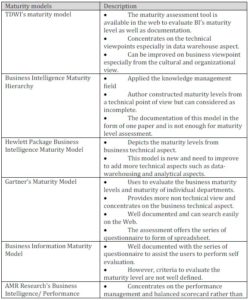
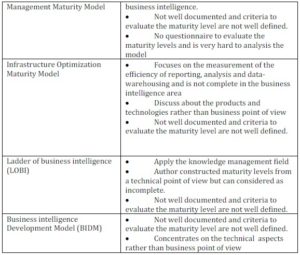
Table 1 above depicts summary of various business intelligence maturity models. As shown in the table 1, the majority of the models do not focus the business intelligence as entire which some of models focus on the technical aspect and some of the models focus on business point of view. For example, TDWI’s model only concentrates on the data warehousing while Business Intelligence Maturity Hierarchy only concentrates on knowledge management. It is not complete to represent business intelligence. We know that business intelligence covers not only data warehousing, but also business performance, balanced scorecard, analytical components. In addition, the documentation of some maturity models above is not well defined and they do not provide any guidelines or questionnaire to evaluate maturity levels.
Proposed Framework
Based on the literature review above, the majority of the models do not focus the business intelligence as entire which some of models focus on the technical aspect and some of the models focus on business point of view. If the organizations want to know exact their business intelligence maturity levels as whole, they have to use multiple models and that it is time consuming. Hence, there is need to have integrated maturity model to combine existing different maturity model and questionnaires and evaluation criteria should be provided. In view of this, an Enterprise Business Intelligence Maturity Model (EBI2M) is proposed.
The proposed EBI2M consists of five levels namely; initial, managed, defined, quantitatively managed and optimizing; all of which are adapted from CMMI maturity levels. There are thirteen key process areas, namely; change management, culture, strategic management, process, people, performance management, balanced scorecard, information quality, data warehousing, master data management, analytical, infrastructure and knowledge management.
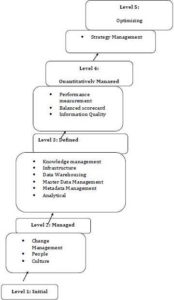
Figure 1: Preliminary Enterprise Business Intelligence Maturity Model (EBI2M)
Developed by Author
Methodology
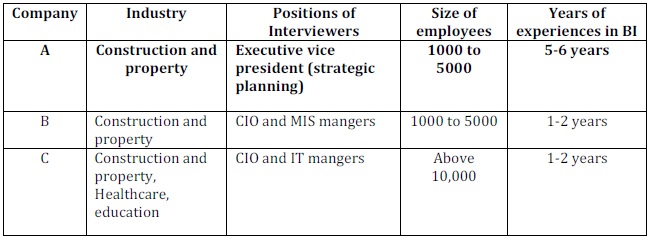
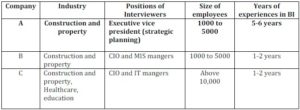
The proposed Enterprise Business Intelligence Maturity model (EBI2M) was applied in the three construction companies in order to evaluate the maturity of BI implementation. This case study was prepared following a series of detailed interviews with staff, the collection of supporting documents and follow up interviews to clarify specific issues arising from the analysis of case study materials.
Table 2: Case Study’s Participate
Results and Discussions
The respondents were instructed to rate their companies’ capabilities of BI implementation from level 0-5.
Below are the results of three companies’ capabilities of BI implementation on thirteen dimensions.
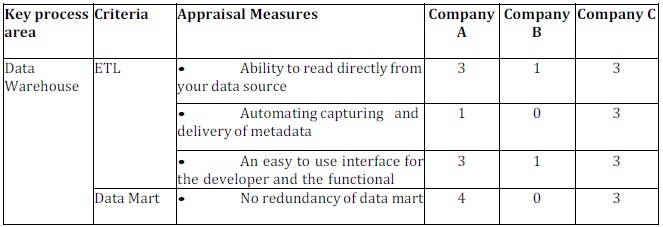
Data Warehouse Perspective
Table 3: Data Warehouse Perspective
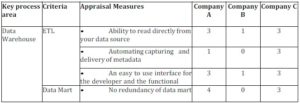
Table 3 depicts the capabilities levels among three companies in data warehouse perspective. As shown in table 3, Company B has lowest capacities in term of ETL and data marts. This is might be due to lack of top management support and lack of experience among IT developers in the company B.
Master Data Management (MDM) Perspective
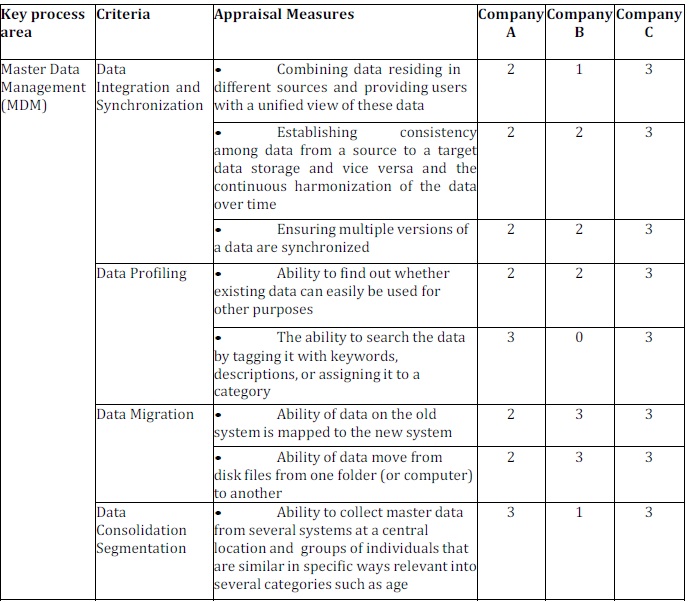
Table 4: Master Data Management (MDM) Perspective
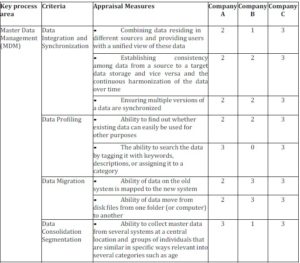
Table 4 depicts the capabilities levels among three companies in master data management perspective. The overall score for company A, B and C is 3.13,1.67 and 3 respectively. Company B is lowest capacities among company A and B.
Metadata Management Perspective
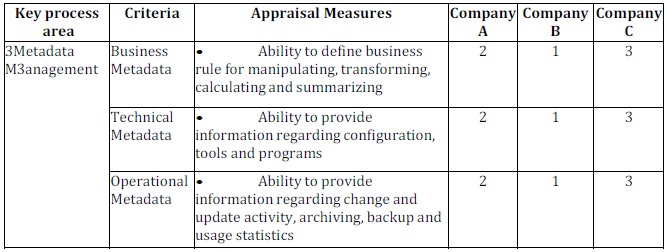
Table 5: Metadata Management Perspective
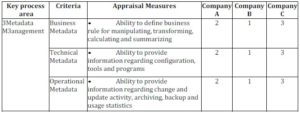
Table 5 depicts the capabilities levels among three companies in metadata management perspective. The overall score for company A, B and C is 2,1 and 3 respectively. Company B is lowest capacities among company A and B.
Knowledge Management Perspective
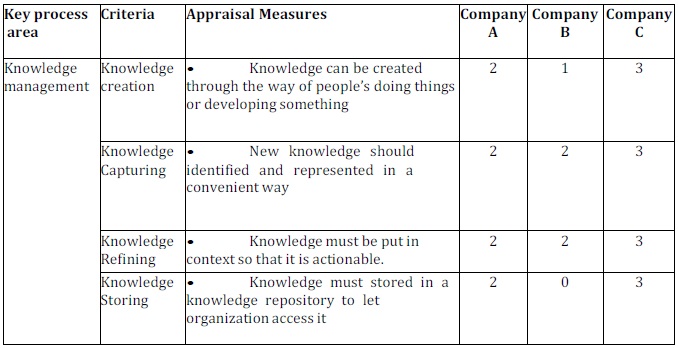
Table 6: Knowledge Management Perspective
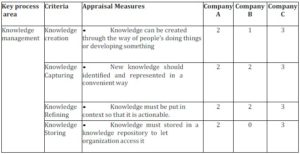
Table 6 depicts the capabilities levels among three companies in knowledge management perspective. The overall score for company A, B and C is 2, 1.25 and 3 respectively. Company B is lowest capacities among company A and B in knowledge management perspective.
Infrastructure Perspective
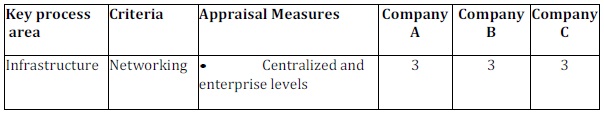
Table 7: Infrastructure Perspective
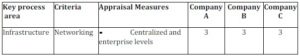
Table 7 depicts the capabilities levels among three companies in infrastructure perspective. Company A, B and C has achieved capacities of score of 3.
Analytical Perspective
Table 8: Analytical Perspective
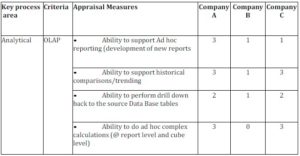
Table 8 depicts the capabilities levels among three companies in analytical perspective. The overall score for company A, B and C is 2.75, 0.75 and 2.25 respectively. Company B is lowest capacities among company A and B in analytical perspective.
Performance Measurement Perspective
Table 9: Performance Measurement Perspective

Table 9 depicts the capabilities levels among three companies in performance measurement perspective. The overall score for company A, B and C is 2.6, 1 and 4 respectively. Company B is lowest capacities among company A and B in performance measurement perspective.
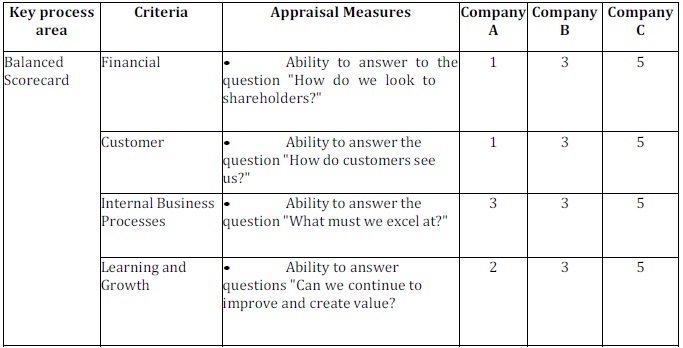
Balanced Scorecard Perspective
Table 10: Balanced Scorecard Perspective
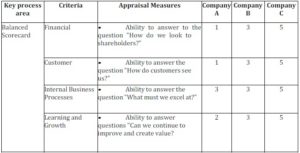
Table 10 depicts the capabilities levels among three companies in balanced scorecard perspective. The overall score for company A, B and C is 1.75, 3 and 5 respectively. Company A is lowest capacities among company B and C in balanced scorecard perspective.
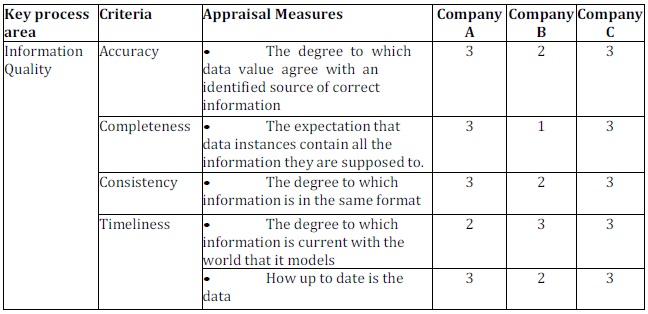
Information Quality (IQ) Perspective
Table 11: Information Quality Perspective
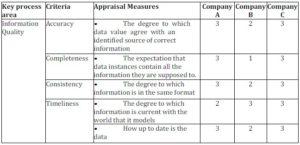
Table 11 depicts the capabilities levels among three companies in information quality perspective. The overall score for company A, B and C is 2.88, 1.88 and 3 respectively. Company B is lowest capacities among company A and C in information quality perspective.
People Perspective
Table 12: People Perspective
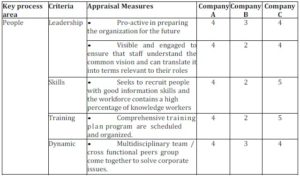
Table 12 depicts the capabilities levels among three companies in people perspective. The overall score for company A, B and C is 4, 4.38 and 4.5 respectively. Company A is lowest capacities among company B and C in people perspective.
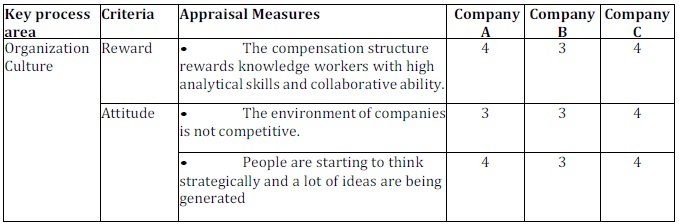
Organization Culture Perspective
Table 13: Organization Culture Perspective
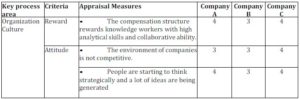
Table 13 depicts the capabilities levels among three companies in organization culture perspective. The overall score for company A, B and C is 3.75, 3 and 4 respectively. Company B is lowest capacities among company A and C in organization culture perspective.
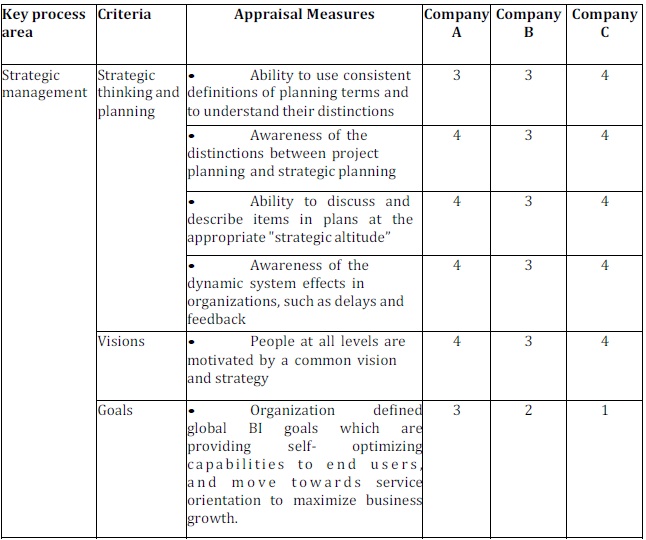
Strategic Management Perspective
Table 14: Company A’s Strategic Management Perspective
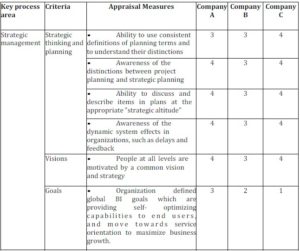
Table 14 depicts the capabilities levels among three companies in organization culture perspective. The overall score for company A, B and C is 3.58, 2.67 and 3 respectively. Company B is lowest capacities among company A and C in organization culture perspective.
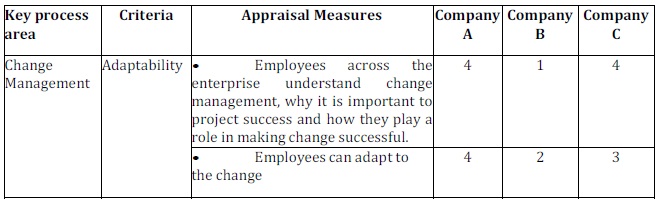
Change Management Perspective
Table 15: Company A’s Change Management Perspective
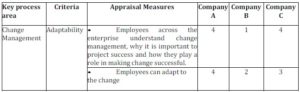
Table 15 depicts the capabilities levels among three companies in change management culture perspective. The overall score for company A, B and C is 4, 1.5 and 3.5 respectively. Company B is lowest capacities among company A and C in change management perspective.
Conclusions
This paper proposes an EBI maturity model (EBI2M) to help the firms to identify the existing problems of BI implementation and plan a systematic path to evolve to higher levels of maturity. An EBI2M is evaluated through three companies in construction area. The result indicates that all three companies do not achieve highest maturity of BI implementation. Therefore, an EBI2M is used to provide symmetric guidelines for these companies to improve the BI implementation in the future.
Acknowledgment
The authors acknowledge the time and commitment of all participants in the case study.
(adsbygoogle = window.adsbygoogle || []).push({});
References
Ang, J .& Teo, T. S. H. (2000). “Management Issues in Data Warehousing: Insights from the Housing and Development Board,” Decision Support Systems. 29(1): 11-20.
Publisher – Google Scholar
Carlo, V. (2009). ‘Business Intelligence: Data Mining and Optimization for Decision Making,’ Wiley.
Google Scholar
Cates, J. E., Gill, S. S. & Zeituny, N. (2005). “The Ladder of Business Intelligence (LOBI): A Framework for Enterprise IT Planning and Architecture,” International Journal of Business Information system. 1(1): 220-238.
Publisher – Google Scholar
Chang, E. (2006). “Advanced BI Technologies, Trust, Reputation and Recommendation Systems,” 7th Business Intelligence Conference (Organised by Marcus Evans), Sydney, Australia.
Publisher
Computerworld (2003). “The Top 10 Critical Challenges for Business Intelligence Success,” Computerworld.
Publisher
Deng, R. (2007). “Business Intelligence Maturity Hierarchy: A New Perspective from Knowledge Management,” Information Management. http://www.information-management.com/ infodirect/20070323/1079089-1.html
Publisher
Eckerson, W. (2004). “Gauge Your Data Warehouse Maturity,” Information management. viewed on 29. April 2009, <http://www.information-management.com/issues/20041101/1012391-1.html>.
Publisher
Faherty, V. (1979). “Continuing Social Work Education: Results of a Delphi Surved,” Journal of Education for Social Work. 15(1): 12-19.
Publisher – Google Scholar
Gartner Research (2007). Gartner EXP Survey of More than 1,400 CIOs Shows CIOs Must Create Leverage to Remain Relevant to the Business, Retrieved 01/04/2009, from <http://www.gartner.com/it/page.jsp?id=501189>.
Publisher
Gartner Research (2008). Gartner EXP Worldwide Survey of 1,500 CIOs Shows 85 Percent of CIOs Expect Significant Change over Next Three Years, Retrieved 01/04/2009, from <http://www.gartner.com/it/page.jsp?id=587309>.
Publisher
Gartner Research (2009). Gartner EXP Worldwide Survey of More than 1,500 CIOs Shows IT Spending to Be Flat in 2009, Retrieved 01/04/2009, from <http://www.gartner.com/it/page.jsp?id=855612>.
Publisher
Hagerty, J. (2006). “AMR Research’s Business Intelligence/ Performance Management Maturity Model, Version 2,” Viewed on 21 April 2009, <http://www.cognos.com/pdfs/analystreports/ar_amr_researchs_bi_perf.pdf >.
Publisher – Google Scholar
Hewlett-Packard (2007). ‘The HP Business Intelligence Maturity Model,’ Viewed on 21 April 2009. <http://h71028.www7.hp.com/ERC/downloads/4AA1-5467ENW.pdf >.
Hostmann, B. (2007). ‘Business Intelligence Scenario,’ Paper presented at the Gartner Business Intelligence Summit, London.
Google Scholar
IDC (2007). “Top Ranked Business Intelligence Tools Vendors Maintain Positions as Acquisition Activity and SMB Vendors Impact the Market, IDC Reveals,” Viewed 03 Jul 2007, <http://www.idc.com/getdoc.jsp?containerId=prUS20767807>.
Publisher
Juran, J. M., Gryna, F. M. & Bingham, R. S. (1974). Quality Control Handbook, 3 edn, McGraw-Hill Book Co, New York, NY.
Publisher – Google Scholar
Kahn, B. K., Strong, D. M. & Wang, R. Y. (2002). “Information Quality Benchmarks: Product and Service Performance,” Communications of the ACM :184-192.
Publisher – Google Scholar – British Library Direct
Kašnik, A. (2008). “Odel Optimization Infrastructure,” Internal material of ZRSZ, Ljubljana.
Ke, W. & Kwok, K. W. (2008). “Organizational Culture and Leadership in ERP Implementation,” Decision support system : 208-218.
Publisher – Google Scholar
Loshin, D. (2003). Business Intelligence: The Savvy Manager’s Guide, Morgan Kaufmann Publishers/Elsevier, Boston.
Publisher – Google Scholar
Lupu, A. R., Bologa, R., Lungu, I. & Bra, A. (2007). “The Impact of Organization Changes on Business Intelligence Projects,” Proceedings of the 7th WSEAS International Conference on Simulation, Modeling and Optimization, Beijing, China, September 15-17: 414-418.
Publisher – Google Scholar
Moss, L. & Hoberman, S. (2004). ‘The Importance of Data Modeling as a Foundation for Business Insight,’ Teradata.
Google Scholar
Moss, L. T. & Atre, S. (2003). Business Intelligence Roadmap: The Complete Lifecycle for Decision-Support Applications, Addison-Wesley, Boston, MA.
Publisher – Google Scholar
Rajterič, I. H. (2010). “Overview of Business Intelligence Maturity Models,” International Journal of Human Science. 15(1): 47-67.
Publisher – Google Scholar
Raskin, M. S. (1994). “The Delphi Study in Field Instruction Revisited: Expert Consensus on Issues and Research Priorities,” Journal of Social Work Education : 75-89.
Publisher – Google Scholar – British Library Direct
Redman, T. C. (1998). “The Impact of Poor Data Quality on the Typical Enterprise,” Communications of the ACM 41(2): 79-82.
Publisher – Google Scholar – British Library Direct
Richardson, J., Schlegel, K.,Hostmann, B. & McMurchy, N. (2008). “Magic Quadrant for Business Intelligence Platforms,” Gartner.
Publisher – Google Scholar
Sacu, C. & Spruit, M. (2010). “BIDM: The Business Intelligence Development Model,” Proceedings of the 12th International Conference on Enterprise Information Systems, Funchal, Madeira-Portugal.
Publisher – Google Scholar
Simon, R. (2002). Performance Measurement and Control Systems for Implementing Strategy,’ Prentice Hall.
Tayi, G. K. & Ballou, D. P. (1998). “Examining Data Quality,” Communications of the ACM. 41(2): 54-57.
Publisher – Google Scholar
Turban, E., Sharda, R., Aronson, J. E., & King, D. (2011). ‘Business Intelligence: A Managerial Approach,’ Prentice Hall.
Turban, E., Volonino, L. & Pollard, C. (2010). Information Technology for Management: Transforming Organization in The Digital Economy, Wiley.
Publisher – Google Scholar
Whitehorn, M. & Whitehorn, M. (1999). Business Intelligence: The IBM Solution Data warehousing and OLAP, Springer-Verlag, NY.
Publisher – Google Scholar
William, S. & William, N. (2007). The Profit Impact of Business Intelligence, Morgan Kaufmann Publishers, San Francisco.
Publisher – Google Scholar