Introduction
Reverse logistics expanded from the knowledge of supply chain management specifically in closed loop supply chain (Guide and van Wassenhove, 2003) and green supply chain management (Hervani, Helms and Sarkis, 2005). Of late, one of the environmental issues that are gaining centre stage is waste management. This cost-related operation has become more complex due to rapid growth of electronic waste or e-waste that is composed of hazardous substances which presents negative risk to environmental health when they are disposed via landfill and incinerators. The work of Basel Action Network (BAN) and international regulations, including trade barriers, are motivating manufacturers to mitigate undesired product impacts through take back programs. Returning products are not limited to used or worn-out goods but is inclusive of manufacturing returns, distribution returns and customer returns (Rogers and Tibben-Lembke, 1999), such as recall, unsold, defectives and surplus products. Since value of products is influenced by technological obsolescence and life cycle stages, product disposition in reverse logistics is an initiative that benefits organization’s environmental reputation apart from realizing business gains through repeat sales, secondary market and reduced inventory purchasing cost (Tibben-Lembke, 2002; Skinner, Bryant and Richey, 2008).
In the face of urbanization, both rapid saturation of landfill or incineration capacity (Ayres, Ferrer and Van Leynseele, 1997) and evolving environmental regulative standards are urging original equipment manufacturers (OEMs) to recognize their responsibility towards wastes, which is a composition of processed natural resources. A joint effort between Department of Environment, Malaysia and EX Corporation, Japan (2005), was conducted to analyze the generation of electronic waste, and it is estimated that households and business institutions discard approximately 38.7 million units of waste, equivalent to 0.7 million metric tonnes in the year 2010. Furthermore, e-waste can only be recycled in secured engineered landfill site to avoid groundwater contamination of surrounding area. According to Theng (2006), from an estimate of 6 million tonnes of waste collected in 2005, the value of recyclable materials is about RM 476.1 million. Based on Greenpeace (2010), Malaysia is not excluded from e-waste trading and smuggling activities as the country is situated in the centre of e-waste movement route. As such, manufactures of end-of-use or end-of-life electronics should undertake ‘planned obsolescence’ strategy to recover products before they are inappropriately retired in landfills.
Multiple cycle of product reuse through diverse forms and conditions, also known as product recoverability, is defined by Mathieux et al. (2008) as the ability of the products inclusive of modules or components to be reused and their remains be recovered through material and energy recycling. Reverse logistics is a promising business as it expands beyond internal environmental management and simultaneously, this program aims to recover value in sold goods. Rogers and Tibben-Lembke (1999) described it as “…the process of planning, implementing, and controlling the efficient, cost-effective flow of raw materials, in-process inventory, finished goods, and related information from the point of consumption to the point of origin for the purpose of recapturing value or proper disposal.” From the perspective of green supply chain management, Hervani et al. (2005) described reverse logistics as the last of four components that operationalized through reuse, remanufacturing, or recycling prior to re-entering the supply chain. Van Hoek (1999)supported the above concept by stating that reactive, proactive and value-seeking management approaches in greening the supply chain are various sources to gain competitive advantage. In regards to pollution prevention and source reduction strategies that define a firm’s environmental commitment, Talbot et al. (2007), Skinner et al. (2008) and Tibben-Lembke (2002) share similar observations on the positive influence of product disposition towards better performance outcome in reverse logistics.
Literature Review
Reverse Logistics
According to Trebilcock (2001), reverse logistics is a series of five processes that begin from authorization of returns, transportation, auditing, product disposition and creating information system to track returns. Other authors have categorized reverse logistics as the second of a series of reverse supply chain processes, which are: product acquisition, reverse logistics, inspection and disposition, recondition and remarketing (Prahinski and Kocabasoglu, 2006; Blackburn et al., 2004; Guide and van Wassenhove, 2003). In a Malaysian study, reverse logistics is described as responsible product disposition on used product and packaging which are collected from customers and/or reversed back to supplier (Eltayeb and Zailani, 2009). Zhu and Sarkis (2007) conducted a study within Chinese environment whereby reverse logistics is described as investment recovery where sales of used and excess material or equipment are useful to liquidate assets but such interpretation inadequately describes the advantage of green and sustainable activity. Despite consistent progress towards industrialization, the market for recycled material has yet to develop as industrial actors have not fully embraced the cradle-to-cradle concept.
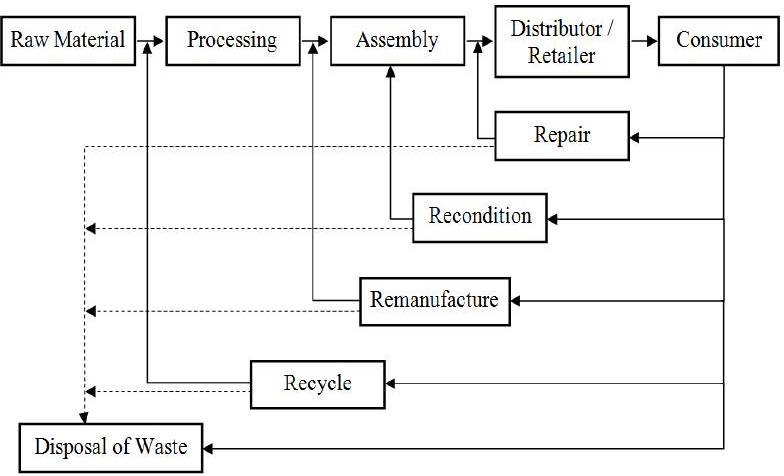
Based on green supply chain and reverse supply chain literatures, the current research on reverse logistics processes focus on product disposition options illustrated in Figure 1. Also known as product recovery options, Skinner et al. (2008) describe that right management of product disposition is a strategic move that paves the way towards superior performance. In analysing reverse logistics among automobile, electronics and appliances manufacturers, Kumar and Putnam (2008) supported the existence of potential profit within recycled and remanufactured product through reuse services. Reuse services include equipment leasing where rents are generated from services rendered by a typical product.
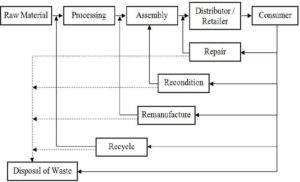
Figure 1: Product Disposition Options in Closed Loop Supply Chain Processes
The European Union Directive 2002/96/EC on Waste of Electrical and Electronic Equipment have defined 10 categories of consumer electronic products that are subject to recovery activities. By average weight per appliance, the target rate of recovery is within the range of 70-80%, whereas the target rate for component, material and substance reuse and recycling is 50-75% (2003). More often, manufacturers engage with third party waste recyclers; but recoverable value in higher level dispositions options are more compared to mere recycling. In the case of Malaysia, reverse logistics is more familiar with packaging recycling and only few electronics companies declare product return programs (Eltayeb and Zailani, 2010). This situation is accentuated by minimal regulative pressure exerted by Solid Waste and Public Cleansing Management Bill 2007, which provides legal mandate for take back and product recycling system. Among the households of Shah Alam in Selangor, storage, sale as second-hand equipment and throw away tops the list of disposal practices, with 48%, 37% and 29% respectively (Junaidah, 2010). The recycling statistics of an urbanized city indicate that recycling practices in Malaysia are below average where only 16 companies out of 138 recovery facilities conduct full product recovery such as electrolysis and wet chemical process whereas others conduct partial recovery that includes disassembly, sorting, shredding and grinding.
For company that accept return as a strategy to gain customer loyalty through repeat buyers, reverse logistics is a fundamental process to recover reusables for gaining additional revenue which inherently reduces cost of goods (Mollenkopf and Weathersby, 2003). Other than completing the supply chain loop so that products are handled at the benefit of environment, it is also important that products are recovered to cater to demand of after sales services so that cost of purchasing parts can be minimized. According to Lau and Wang (2009), the cost, knowledge and inconsistent inputs are factors that inhibit the development of reverse logistics among consumer electronics manufacturers inenvironmental and operational performance, such as environmental regulatory compliance, improved customer relations, assets recovery, cost containment, improved profitability and reduced inventory investment (Daugherty, Autry and Ellinger, 2001; Autry, Daugherty and Richey, 2001; Skinner et al., 2008). Reverse logistics requires integration of various business functions especially product design department to maximize the value of recoverables. Based on Chan & Fang (2007), there are four ascending levels for measuring a firm’s environmental management and ecosystem friendly, at the highest level is measured by reverse logistics practices such as recovery of materials and products for a prolonged lifecycle. Their study revealed that proactivity in protecting the environment contributes economic benefits.
Research Framework and Hypotheses Development
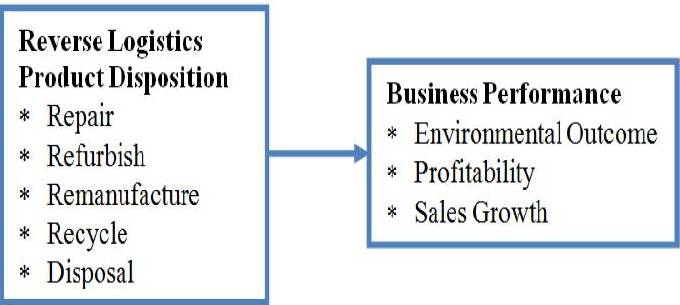
Figure 2 outlines a framework to understand the product disposition and their effects on business performance. Reverse logistics product disposition consists of five asset recovery activities for reprocessing various types of returns. In regards to reverse logistics performance, it is important for manufacturers or reprocessing centres to inspect, rectify the quality of products and redistribute as quickly as possible because the cost of inventory holding and obsolescence is not desirable. Other than maximizing the profit from returns, product disposition is an advantage for becoming environmentally responsible through sound waste management practise. Based on the work of Zhu et al. (2007), King and Lenox (2001), Rogers and Tibben-Lembke (1999) and Daugherty et al. (2001), three types of business performance are taken into considerations, namely environmental outcome, profitability and sales growth.
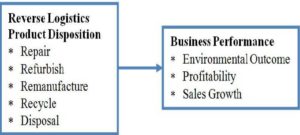
Figure 2: Research Framework
Reverse Logistics Product Disposition
Careful considerations are required when selecting product disposition options for reprocessing returns received from downstream supply chains. Also known as product recovery options, Thierry et al. (1995) revealed that repair, refurbishing, remanufacturing, cannibalization and recycling are various operations to reduce the amount of waste that are landfilled or incinerated. Some manufacturers have taken the initiative to recover products by engaging third party remanufacturers to recover products or align with collectors, dismantlers and recyclers to manage end-of-life waste in an efficient manner. Among the factors that are taken into consideration when evaluating the destiny of products bound to be reprocessed is the depth of disassembly (Thierry et al., 1995), impact to the environment (Gehin, Zwolinski and Brissaud, 2008), age and condition of the returned product (Guide et al., 2000), quality of recovered product compared to original specification (Ijomah et al., 2007), destination of used products in secondary market (Rogers, Rogers and Lembke, 2010) and cost and profit structure of this green initiative.
Unlike the study on automotive industry that was conducted by Skinner et al. (2008), this study will analyze product disposition within electrical and electronic industry because shorter technology clockspeed have accelerated electronic waste pile up. In Malaysia, take back programs organized by Nokia and HP are supporting recyclability of material and energy within end-of-life products (Eltayeb and Zailani, 2010). Another company such as Motorola has developed firm-based standards so that identical management of hazardous waste and waste recycling are implemented across subsidiary companies (Rock and Angel, 2007). The type of product disposition depends on several key decisions such as cost and value of recovery, level of product sophistication and market value of products (Fernández et al., 2008). For higher value products, independent secondary remanufacturers are restoring product’s functional qualities to gain benefits from various avenues, including secondary markets and lease businesses. Based on a review of reverse logistics and environment related literatures, adopted product disposition options are outlined in Table 1.
Table 1: Product Recovery or Disposition Options Described in Literatures
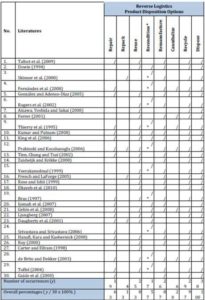
* Represents that the term ‘refurbish’ is used instead of ‘recondition’ in the literatures. These terms are interchangeable and the extensiveness of testing in returned products may vary because standard operating procedure for each disposition option is subjected to manufacturers’ or distributors’ interests.
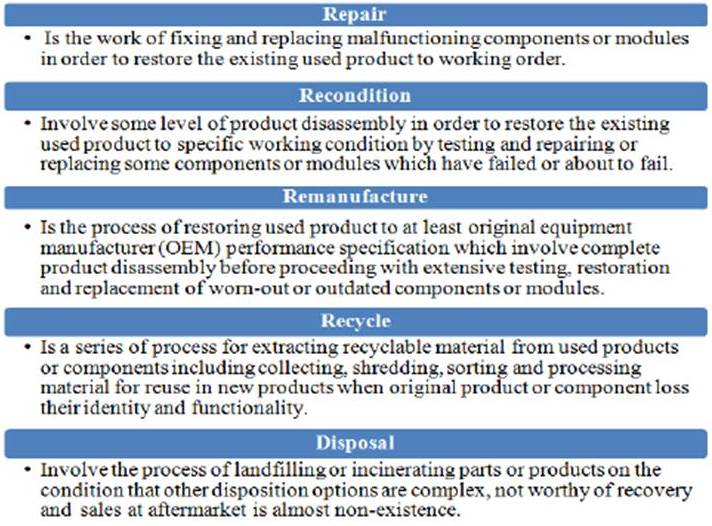
As the product value plummets across repair, recondition and remanufacture due to technological and life cycle issues, Thierry et al. (1995) suggest that the degree of upgrade applied to the product increases across repair, recondition and remanufacture to obtain higher margin of recoverable value. Service or warranty return usually calls for repair, whereas reconditioned or remanufactured products are put up for sale again. Upgrade is not applicable to recycling as only valuable materials can be recovered to process into new material or other useful material for use as input raw material. As sales growth is not applicable to disposal, only environmental outcome and profitability as performance indicators are measured, because disposal is a cost-oriented activity that reflects firms’ environmental responsibility. Reuse is excluded from this study as it is generally straightforward and commonly known as “resold as is” or “repackaged and sold as new” and may not require rework if no damages are found on the returned product. Based on Table 1, five disposition options analyzed in this study are defined in Figure 3.
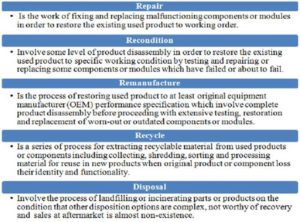
Figure 3: Proposed Definitions of Product Disposition Options
Business Performance
Organizational performance is a multifaceted measure for analyzing the outcome of firms’ business strategy. Since accountants, operation managers, business strategists and environmental personnel have different business interests, performance measures are different across disciplines. Environmental management and reverse supply chain is the foundation for studying environmentally conscious product disposition. Both fields of knowledge are diverse but share the same interest in sustainable resource consumption. As such, different measures are used to represent business performance to distinguish the outcome of disposition options from the environmental and financial perspectives (Klassen and McLaughlin, 1996; Sroufe, 2003; Zhu et al., 2007; Yang, Hong and Modi, 2011). As such, managing new and used returns allows an organization to influence environmental well-being but at the same time, provides an opportunity for the organization to recover some cost of inventories. Heese et al. (2005) suggest that manufacturers not only create demand for cleaner products in existing and secondary market but also develop long term consumer relationship that sets barriers for competitors. Moreover, some companies are utilizing online business portal, such as eBay and Amazon to build the market for remanufactured products across the globe.
Profitability of recoverable assets is an enabler for disposition strategies to attain economic performance (Skinner et al., 2008). Their study pointed out that improved economic performance for auto parts industry is seen only for product recycling and disposal. However, Zhu et al. (2007) studied the influence of green supply chain practices, such as ecodesign and investment recovery on performance where the latter practice has proved a significant but negative relationship with negative economic performance. Furthermore, Zhu, Sarkis and Lai (2008) have paved the direction for this study to empirically collect evidence on the outcome of product disposition options, because the implementation of green supply chain management practices is slightly higher for electrical and electronic industry when compared to automobile industry. Based on the study conducted by Yang, Hong and Modi (2011) and González-Benito and González-Benito (2005), at least three types of performance ought to be measured from the perspective of environmental, market and financial performances. In this study, firm’s business performance is measured based on respondent’s knowledge on the effects of product recovery towards environmental outcome, profitability and sales growth. Since environmentally conscious business practices lead companies to stand out among competitive peers (Toffel, 2004), accepting returns for sustainable product disposition ought to disseminate positive effects on performance.
H. Reverse logistics product dispositions options in terms of;
(1) Repair
(2) Recondition
(3) Remanufacture
(4) Recycle
(5) Disposal
Are positively related to business performance.
Research Methodoogy and Survey Results
Research Methodology
Survey Instrument
Apart from the general information questions, there are 36 items that measure product disposition activities and 23 items were used to measure the performance outcome attributed to the adoption of reverse logistics activities. All items were adapted from a series of literatures enlisted in Table 1, and all questions use 5-point Likert type scale. Compared with other studies within the Malaysian context, this study looks into the work that defines product recovery which had a vital role in operationalizing reverse logistics and therefore, the questions were measured based on the extent of existence scale (1: very low extent, 2: low extent, 3: moderate extent, 4: high extent, and 5: very high extent of existence) to gauge the presence of such activities in E&E organizations. The items that measure the business performance require the respondents to review the scale of business benefits that was apparent to their organizations for the past three years (1: not at all, 2: a little bit, 3: to some degree, 4: relatively significant, and 5: significant). The items used to represent the variable are enlisted in Appendix A.
Sampling Characteristics and Data Collection
To test the proposed hypothesis, this study focuses on gathering data from electric and electronic (E&E) organizations as electronic waste scores higher in both environmental threat and recoverable value. Federations of Malaysian Manufacturers (FMM), in corporation with the Malaysia External Trade Development Corporation (MATRADE), have published the Industry Directory for Electrical and Electronics 2007/2008. To date, this Directory is the most recent publication of E&E organizations in Malaysia and the authors administered this survey to 177 companies which are ISO14001 certified, because this sample is deemed to have higher awareness of the environmental impact exerted by their products and processes. As such, the survey is targeted to person-in-charge of environmental management department in the organizations and if the department exists as a cross-functional team, environmental management representatives who are well-versed of firms’ environmental proactivity are identified. The survey package was administered in the form of conventional mail to the population but only a total of 98 responses were collected as some companies were reserved about revealing information deemed sensitive to their customer base. Throughout the data collection period, electronic mails not only serve as a reminder, they were also a two way communication channel for respondents to seek clarity about the questionnaire and for researchers to understand reverse logistics operations.
Survey Results
Descriptive Statistics & Chi Square Test
The ISO14001 certification on firms’ environmental management system does not necessarily imply that firms are managing waste in the interest of value recovery. As such, two questions are included at the general information section of the survey to determine the level of reverse logistics implementation on products and packaging. The results reveal that a total of 20 and 16 companies do not consider the implementation of this business practice for their products and packaging respectively. Further analysis guided this study to exclude 9 responses not considering reverse logistics in both products and packaging because the firm’s lack of interest in reverse logistics raises uncertainties about the reliability of other data provided by the respondents.
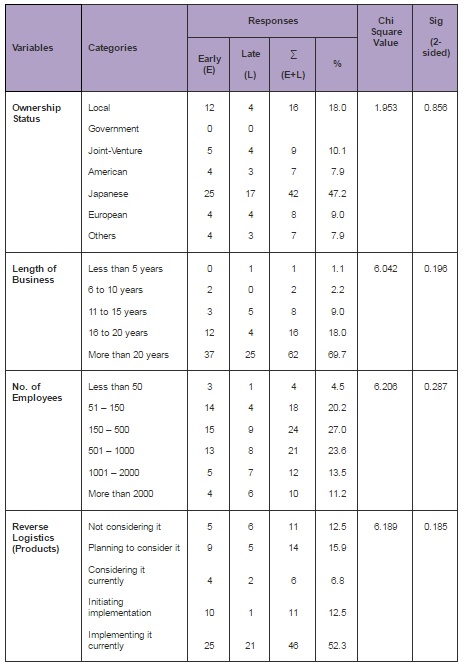
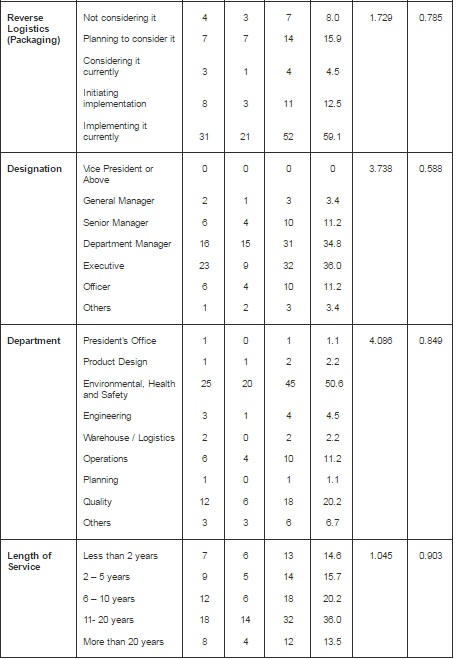
The sample size of this study was reduced to 89. Based on Table 2, the summary of organizations’ profile reveals that Japanese-owned companies account for 47.2%, companies that have operated over 20 years account for 69.7%, and companies which implement reverse logistics in their products and packaging currently account for 52.3% and 59.1% of total respondents. Respondents who held the position of department managers and above account for 49.4%, 50.6% of respondents held positions in environmental, health and safety departments and 69.7% of respondents worked in their organizations for more than 5 years. Table 2 also presents the results of chi-square test which indicated no significant differences between early and late responses.
Table 2: Profile of Sample Respondents and Chi-Square Test to Compare of Early and Late Responses
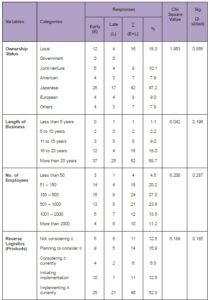
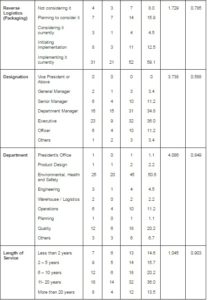
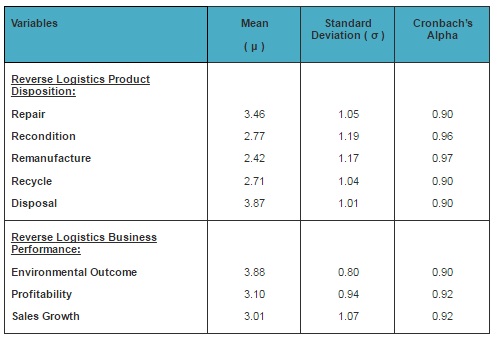
Table 3 provides the mean and standard deviation of reverse logistics dispositions options and business performance. On the scale of 1 to 5, the midpoint score of 3 represents: (1) moderate existence of reverse logistics practices, and (2) business benefits are derived to some degree. Among five disposition options, the existence of repair (μ = 3.46, σ = 1.05) and disposal (μ = 3.87, σ = 1.01) activities are substantially higher. Based on previous studies, Malaysian firms report lower level of reverse logistics (Eltayeb and Zailani, 2009) and similar results are seen in this study where recondition, remanufacture and recycling activities are conducted but only at lower scale. Even though reverse logistics activities are relatively trivial when compared to firms’ main operations, this environmentally conscious business practise is a significant contributor to firms’ environmental impact and carries some degree of profitability and sales growth when recovered goods re-enter market as new or used products. This outcome of the study is consistent with firms’ business interest because product recovery is inversely related to product quality, an important aspect that serves the customers’ expectations when a product is purchased. As such, maximizing profitability in product recovery is a strategy that is comparable to meeting the projected profit from invested capital that was present in the form of in-process inventories or waste.
Table 3: Descriptive Statistics

Factor Analysis
This study conducted exploratory factor analysis on the survey data to group items within reverse logistics product disposition and business performance. Principal component analysis was used as the extraction method followed by Varimax rotation. The value of Kaizer-Meyer-Olkin measure of sampling adequacy (MSA) reverse logistics was 0.827 and this value exceeded the recommended value of 0.6 (Kaiser, 1970). On the other hand, the significance in Bartlett’s test of sphericity assured that items in the correlation matrix are factorable. Five factors had initial eigenvalues that exceeded 1and they explained 76.31% of the inherent variation. These components, otherwise known as the disposition options that extends the useful life of reusable items are labelled as repair, recondition, remanufacture, recycle and disposal. A check on the reliability of each component showed that Cronbach’s alpha values were acceptable at 0.90, 0.96, 0.97, 0.90 and 0.90 respectively. An analysis on the reverse logistics performance measurement revealed that Kaiser’s MSA value was 0.793, Barlett’s test was significant and the components are labelled as environmental outcome, profitability and sales growth. Business performance measurements contribute 64.98% of inherent variance and based on Table 4, Cronbach’s alpha values for all three factors were above the minimum value of 0.70 (Nunnally, 1978) and they are 0.90, 0.92 and 0.92 respectively.
Analysis and Results
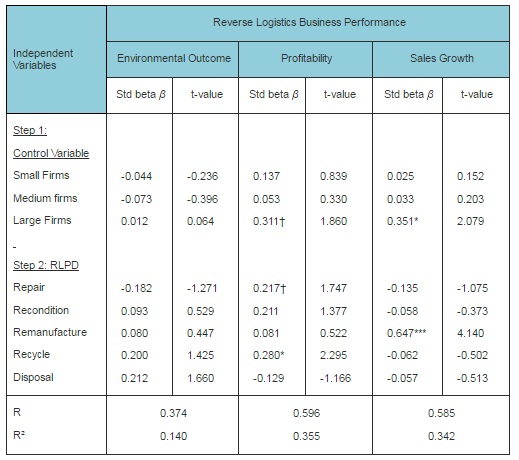
A two step hierarchical regression analysis was carried out to where the first prediction equation is comprised of control variable and the second prediction equation analyzes the data with the inclusion of independent variables. Firm size is statistically controlled to analyze the true nature of relationships understudy (Eltayeb et al., 2010; Zhu and Sarkis, 2007). The results of regression analysis used to test the hypotheses are presented in Table 4. Independent variables, R and R² values are enlisted in the first column whereas the columns to the right are standardized beta coefficients and t-value results of the direct relationships with business performance. Hypothesis 1 is partially supported because repair is positively associated with profitability (β = 0.217, t = 0.839, p < 0.10) but it does not bring significant benefit to firms’ environmental outcome and sales growth. This might be relevant because repair, as the lowest level of product recovery activity, is reworks that improve products to working order so that they enter the distribution market as new and high quality goods. Inherently, repair diminishes products’ threat to the environment and enables the company to meet production target.
Unlike repair, remanufacture is positively associated to sales growth (β = 0.647, t = 4.140, p < 0.01) because as-new goods are restored upon intensive testing and sold with additional marketing strategy. Based on the result, remanufacture is not associated to environmental and monetary benefits but this is a good strategy to expand firms’ market share to specific groups of customers, with or without brand recognition. For Hypothesis 4, the relationship between recycling and business performance is partially supported. Recycling contributes to profitability (β = 0.280, t = 2.295, p < 0.05) and this is attributed to the presence of valuable content which can be disassembled and recycled in-house or sent to contract recyclers. According to some respondents to this study, contract recyclers will breakdown recyclables to extract materials and subsequently, a material composition assessment determines the amount to be reimbursed back to manufacturers. Since many companies outsource waste management activities, manufacturers’ recycling practice only contributes to the environment indirectly.
Since the mass of recyclables and disposables are not merchandized, it is sensible to conclude that disposition activities such as recycling and disposal do not have significant relationship with sales growth. Hypothesis 5 is not supported, where disposal is not associated with positive environmental impact even though management of disposal throughout firm’s operations are fundamental activities of ISO14000 certified companies. Finally, Hypothesis 2 is also not supported where implementations of recondition activity have no significant impact to firms’ environmental outcome, profitability and sales growth.
Table 4: Examination of Direct Effects
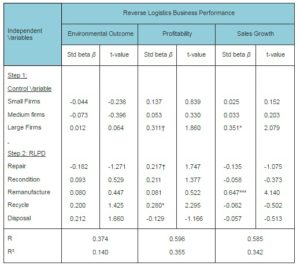 Significant levels: ***p < 0.001; **p < 0.01; *p < 0.05; †p < 0.10
Conclusion and Limitations
Firms which are ISO14000 certified monitor their environmental waste and recycling practices as they are expected to comply with some level of qualification standards (Sroufe, 2003). Only recently did Ministry of Energy, Green Technology and Water (KeTTHA) begin to support green products for sustainable resource consumption. This study is important to outline product disposition as part of environmentally proactive approach for reducing the mass of disposables, which are often perceived as a cost-bearing activity with limited benefits. With increasing landfill and environmental control cost, the current situation is not favourable for electronics manufacturers unless products and their constituents are reusable in multiple recovery loops (King et al., 2006). In the case of Malaysia, manufacturers are not proactive in taking advantage of product take back and reprocessing activities as they are considered as cost-oriented services. Most companies that provide reverse logistics programs are subsidiary companies of multinational corporations and a majority of local establishments in Malaysia have not obtained certification for environmental management systems. Although about two thirds of local companies mentioned that they are recovering products, the small amount of data collected was not adequate to generalize the inclination of local companies’ towards returns.
Unlike previous studies, this study focuses on the disposition options in reverse logistics operation instead of management of returns, such as product acquisition and transportation mode. The researchers conclude that product disposition activities, particularly repair and recycling, improve firms’ profitability through whole unit recovery and material extraction respectively. For example, both disposition options can be tailored to serve specific marketing strategies such as warranty protection programs; where customers are encouraged to return products that can be repaired within a certain time period and at the same time, customers can be introduced to trade-in programs that successively translate to sales. Intrinsically, returns are resources for recovery of usable subassemblies or recyclables but from a wider perspective, returns not only have the potential to elevate firm’s environmental image but opens up opportunities in retaining customers from primary market. Similar opportunities are also seen when a company remanufactures products to serve the demands from a secondary market.
Due to the scope of this study, information provided by respondents is industry-specific and the reduced sample size could be a limitation to this study. Furthermore, respondents do not want to risk their customers upon revealing confidential information associated with products origins. As such, a case study analysis would be useful to understand the value chain in reverse logistics. Future studies should analyze the influence of internal and external factors that drives the implementation of asset recovery.
(adsbygoogle = window.adsbygoogle || []).push({});
References
(2003). “Directive 2002/96/EC of the European Parliament and of the Council of 27 January (2003) on Waste Electrical and Electronic Equipment (WEEE),” Official Journal of the European Union, L37/24.
Publisher
Aizawa, H., Yoshida, H. & Sakai, S.- I. (2008). “Current Results and Future Perspectives for Japanese Recycling of Home Electrical Appliances,” Resources, Conservation and Recycling, 52, 1399-1410.
Publisher – Google Scholar
Autry, C. W., Daugherty, P. J. & Richey, R. G. (2001). “The Challenge of Reverse Logistics in Catalog Retailing,” International Journal of Physical Distribution & Logistics Management, 31 (1), 26-37.
Publisher – Google Scholar – British Library Direct
Ayres, R., Ferrer, G. & Van Leynseele, T. (1997). “Eco-Efficiency, Asset Recovery and Remanufacturing,” European Management Journal, 15 (5), 557-574.
Publisher – Google Scholar – British Library Direct
Blackburn, J. D., Guide, V. D. R., Souza, G. C. & Van Wassenhove, L. N. (2004). “Reverse Supply Chains for Commercial Returns,” California Management Review, 46 (2), 6-22.
Publisher – Google Scholar – British Library Direct
Bras, B. (1997). “Special Issue on Product Design and the Environment, United Nations Environment Programme Industry and Environment (UNEP/IE),” Industry and Environment, 20 (1-2).
Publisher
Carter, C. R. & Ellram, L. M. (1998). “Reverse Logistics: A Review of the Literature and Framework for Future Investigation,” Journal of Business Logistics, 19 (1), 85-102.
Publisher – Google Scholar – British Library Direct
Chan, S.- C. & Fang, W. (2007). ‘Antecedents and Performance Outcomes of Environmental Management Levels,’ Paper presented at: International Conference on Business and Information, Tokyo, Japan, 10-13th July.
Google Scholar
Daugherty, P. J., Autry, C. W. & Ellinger, A. E. (2001). “Reverse Logistics: The Relationship between Resource Commitment and Program Performance,” Journal of Business Logistics, 22 (1), 107-123.
Publisher – Google Scholar – British Library Direct
De Brito, M. P. & Dekker, R. (2003). “A Framework for Reverse Logistics,” ERIM Report Series Reference No ERS-2003-045-LIS, 29.
Publisher – Google Scholar
Dowie, T. (1994). “Green Design,” World Class Design for Manufacture, 1 (4), 32-38.
Publisher – Google Scholar
Eltayeb, T. K. & Zailani, S. (2009). “Going Green through Green Supply Chain Initiatives towards Environmental Sustainability,” Operations and Supply Chain Management, 2 (2), 93-110.
Publisher – Google Scholar
Eltayeb, T. K. & Zailani, S. (2010). “Green Business among Certified Companies in Malaysia towards Environmental Sustainability: Benchmarking on the Drivers, Initiatives and Outcomes,” International Journal of Environmental Technology and Management, 12 (1), 95-125.
Publisher – Google Scholar
Eltayeb, T. K., Zailani, S. & Ramayah, T. (2010). “Green Supply Chain Initiatives among Certified Companies in Malaysia and Environmental Sustainability: Investigating the Outcomes,” Resources, Conservation and Recycling, 55 (5), 495-506.
Publisher – Google Scholar
Fernández, I., Puente, J., García, N. & Gómez, A. (2008). “A Decision-Making Support System on a Products Recovery Management Framework: A Fuzzy Approach,” Concurrent Engineering: Research and Applications, 16, 129-138.
Publisher – Google Scholar – British Library Direct
Ferrer, G. (2001). “On the Widget Remanufacturing Operation,” European Journal of Operational Research, 135, 373-393.
Publisher – Google Scholar
French, M. L. & LaForge, R. L. (2005). “Closed-loop Supply Chains in Process Industries: An Empirical Study of Producer Re-use Issues,” Journal of Operations Management, 24, 271-286.
Publisher – Google Scholar
Gehin, A., Zwolinski, P. & Brissaud, D. (2008). “A Tool to Implement Sustainable End-of-Life Strategies in the Product Development Phase,” Journal of Cleaner Production, 16, 566-576.
Publisher – Google Scholar
González, B. & Adenso-Díaz, B. (2005). “A Bill of Materials-Based Approach for End-of-Life Decision Making in the Design for the Environment,” International Journal of Production Research, 43 (10), 2071-2099.
Publisher – Google Scholar
González-Benito, J. & González-Benito, O. (2005). “Environmental Proactivity and Business Performance: An Empirical Analysis,” The International Journal of Management Science, 1-15.
Publisher – Google Scholar
Greenpeace. Where does E-Waste End Up? [Online]. [31st October, 2010],http://www.greenpeace.org/international/en/campaigns/toxics/electronics/the-e-waste-problem/where-does-e-waste-end-up/
Publisher
Guide, V. D. R., Jayaraman, V., Srivastava, R. & Benton, W. C. (2000). “Supply Chain Management for Recoverable Manufacturing System,” Interfaces, 30 (3), 125-142.
Publisher – Google Scholar – British Library Direct
Guide, V. D. R. J. & Van Wassenhove, L. N. (2003). Business Aspects of Closed Loop Supply Chains, Carnegie Mellon University Press, Pittsburgh, Pennsylvania.
Publisher – Google Scholar
Hanafi, J., Kara, S. & Kaebernick, H. (2008). “Reverse Logistics Strategies for End-of-Life Products,” The International Journal of Logistics Management, 19 (3), 367-388.
Publisher – Google Scholar
Heese, H. S., Cattani, K., Ferrer, G., Gilland, W. & Roth, A. V. (2005). “Competitive Advantage through Take-Back of Used Products,” European Journal of Operational Research, 164, 143-157.
Publisher – Google Scholar
Hervani, A. A., Helms, M. M. & Sarkis, J. (2005). “Performance Measurement for Green Supply Chain Management,” Benchmarking: An International Journal, 12 (4), 330-353.
Publisher – Google Scholar – British Library Direct
Ijomah, W. L., McMahon, C. A., Hammond, G. P. & Newman, S. T. (2007). “Development of Design for Remanufacturing Guidelines to Support Sustainable Manufacturing,” Robotics and Computer-Integrated Manufacturing, 23, 712-719.
Publisher – Google Scholar
Kaiser, H. F. (1970). “A Second Generation Little Jiffy,” Psychometrika, 35, 401-415.
Publisher – Google Scholar
Kalana, J. A. (2010). “Electrical and Electronic Waste Management Practice by Households in Shah Alam, Selangor, Malaysia,” International Journal of Environmental Sciences, 1 (2), 132-144.
Publisher – Google Scholar
King, A. A. & Lenox, M. (2001). “Does it Really Pay to be Green? An Empirical Study of Firm Environmental and Financial Performance,” Journal of Industrial Ecology, 5 (1), 105-116.
Publisher – Google Scholar – British Library Direct
King, A. M., Burgess, S. C., Ijomah, W. & McMahon, C. A. (2006). “Reducing Waste: Repair, Recondition, Remanufacture or Recycle,” Sustainable Development, 14, 257-267.
Publisher – Google Scholar – British Library Direct
Klassen, R. D. & McLaughlin, C. P. (1996). “The Impact of Environmental Management on Firm Performance,” Management Science, 42 (8), 1199-1214.
Publisher – Google Scholar – British Library Direct
Kumar, S. & Putnam, V. (2008). “Cradle to Cradle: Reverse Logistics Strategies and Opportunities across Three Industry Sectors,” International Journal of Production Economics, 115, 305-315.
Publisher – Google Scholar
Lau, K. H. & Wang, Y. (2009). “Reverse Logistics in the Electronic Industry of China: A Case Study,” Supply Chain Management: An International Journal, 14 (6), 447-465.
Publisher – Google Scholar
Mathieux, F., Froelich, D. & Moszkowicz, P. (2008). “ReSICLED: A New Recovery-Conscious Design Method for Complex Products Based on a Multicriteria Assessment of the Recoverability,” Journal of Cleaner Production, 16, 277-298.
Publisher – Google Scholar
Mollenkopf, D. & Weathersby, H. (2003). ‘Creating Value through Reverse Logistics,’ LogisticsQuarterly.com, 9, 3/4, pp. 20-24.
Google Scholar
Nunnally, J. C. (1978). Psychometric Theory, McGraw-Hill, New York.
Publisher – Google Scholar
Prahinski, C. & Kocabasoglu, C. (2006). “Empirical Research Opportunities in Reverse Supply Chains,” The International Journal of Management Science, 34, 519-532.
Publisher – Google Scholar
Rock, M. T. & Angel, D. P. (2007). “Grow First, Clean Up Later? Industrial Transformation in East Asia,” Environment, 49 (4), 8-19.
Publisher – Google Scholar – British Library Direct
Rogers, D. S., Lambert, D. M., Croxton, K. L. & García-Dastugue, S. J. (2002). “The Returns Management Process,” The International Journal of Logistics Management, 13 (2), 1-18.
Publisher – Google Scholar – British Library Direct
Rogers, D. S., Rogers, Z. S. & Lembke, R. (2010). “Creating Value through Product Stewardship and Take-Back,” Sustainability Accounting, Management and Policy Journal, 1 (2), 133-160.
Publisher – Google Scholar
Rogers, D. S. & Tibben-Lembke, R. S. (1999). ‘Going Backwards: Reverse Logistics Trends and Practices,’ Pittsburh, PA: RLEC Press.
Google Scholar
Rose, C. M. & Ishii, K. (1999). ‘Product End-of-Life Strategy Characterization Design Tool,’ Journal of Electronics Manufacturing, 20.
Roy, R. (2000). “Sustainable Product-Service System,” Futures, 32, 289-299.
Publisher – Google Scholar – British Library Direct
Skinner, L. R., Bryant, P. T. & Richey, R. G. (2008). “Examining the Impact of Reverse Logistics Disposition Strategies,” International Journal of Physical Distribution & Logistics Management, 38 (7), 518-539.
Publisher – Google Scholar
Srivastava, S. K. & Srivastava, R. K. (2006). “Managing Product Returns for Reverse Logistics,” International Journal of Physical Distribution & Logistics Management, 36 (7), 524-546.
Publisher – Google Scholar
Sroufe, R. (2003). “Effects of Environmental Management Systems on Environmental Management Practices and Operations,” Production and Operation Management, 12 (3), 416-431.
Publisher – Google Scholar – British Library Direct
Talbot, S. (2009). ‘Malaysian Industrial Development Authority (MIDA),’ pp. 22-30.
Talbot, S., Lefebvre, E. & Lefebvre, L.- A. (2007). “Closed-loop Supply Chain Activities and Derived Benefits in Manufacturing SMEs,” Journal of Manufacturing Technology Management, 18 (6), 627-658.
Publisher – Google Scholar – British Library Direct
The E-Waste Inventory Project in Malaysia. [Online]. Department of Environment, Malaysia & EX Corporation, Japan.[10th October, 2009], www.basel.int/techmatters/e_wastes/projReport30-07-09.pdf
Publisher
Theng, L. C. (2006). ‘Waste to Wealth: How it Works in Malaysia. Impak: Quarterly DOE Update on Environment,’ Development and Sustainability, 2, pp. 10-12.
Thierry, M., Salomon, M., Van Nunen, J. & Van Wassenhove, L. (1995). “Strategic Issues in Product Recovery Management,” California Management Review, 37, 114-135.
Publisher – Google Scholar – British Library Direct
Tibben-Lembke, R. S. (2002). “Life After Death: Reverse Logistics and the Product Life Cycle,” International Journal of Physical Distribution & Logistics Management, 32 (3), 223-244.
Publisher – Google Scholar – British Library Direct
Tien, S.- W., Chung, Y.- C. & Tsai, C.- H. (2002). “Environmental Design Implementation in Taiwan’s Industries,” Environmental Impact Assessment Review, 22, 685-702.
Publisher – Google Scholar
Toffel, M. W. (2004). “Strategic Management of Product Recovery,” California Management Review, 46 (2).
Publisher – Google Scholar – British Library Direct
Trebilcock, B. (2001). “Why Are Returns So Tough?,” Modern Materials Handling, 56 (11), 45-51.
Publisher – Google Scholar
Van Hoek, R. I. (1999). “From Reversed Logistics to Green Supply Chains,” Supply Chain Management, 4 (3), 129-134.
Publisher – Google Scholar – British Library Direct
Yang, M. G. M., Hong, P. & Modi, S. B. (2011). “Impact of Lean Manufacturing and Environmental Management on Business Performance: An Empirical Study on Manufacturing Firms,” International Journal of Production Economics, 129, 251-261.
Publisher – Google Scholar
Zhu, Q. & Sarkis, J. (2007). “The Moderating Effects of Institutional Pressures on Emergent Green Supply Chain Practices and Performance,” International Journal of Production Research, 45 (18-19), 4333-4355.
Publisher – Google Scholar – British Library Direct
Zhu, Q., Sarkis, J. & Lai, K.- H. (2007). “Green Supply Chain Management: Pressures, Practices and Performance within the Chinese Automobile Industry,” Journal of Cleaner Production, 15, 1041-1052.
Publisher – Google Scholar
Zhu, Q., Sarkis, J. & Lai, K.- H. (2008). “Green Supply Chain Management Implications for “Closing the Loop”,” Transportation Research Part E, 44.
Publisher – Google Scholar
Zuidwijk, R. & Krikke, H. (2008). “Strategic Response to EEE Returns: Product Eco-design or New Recovery Processes?,” European Journal of Operational Research, 191, 1206-1222.
Publisher – Google Scholar
Appendix A: Questionnaire Items
Reverse Logistics Product Disposition
□ Repair
- Repair is the correction of faults in a product.
- Repair restore product to working order.
- Repair prolongs the product’s lifecycle.
- Repair replaces broken parts that have failed.
- Repair involves disassembly at product level.
□ Recondition
- This strategy involves collecting used product from customers for reconditioning.
- Recondition is the work for returning used product to a satisfactory working condition.
- Recondition inspects critical modules in the product.
- Recondition extends functional use of the product.
- Recondition replaces all major components that have failed or that are on the point of failure.
- Recondition involves disassembly up to module level.
- Recondition involves product upgrade within specified quality level.
- Warranty for reconditioned product is less when compared to remanufactured product.
□ Remanufacture
- This strategy involves collecting used product from customers for remanufacturing. K
- Remanufacture is the work for returning product to at least OEM original performance specification.
- Remanufacture inspects all modules and parts in the product.
- Remanufacture involves disassembly up to part level.
- Remanufacture involves product upgrade up to as-new quality level.
- Warranty for remanufactured product is highest compared to other disposition options.
- Remanufacture is the work of building a new product on the base of a used product.
- Suppliers are required to collect back remanufacturable product.
□ Recycle
- This strategy involves collecting used products from customers for recycling.
- This strategy involves collecting used packaging from customers for recycling.
- Procedures for recycling have been established.
- Procedures for handling hazardous materials for end-of-life products have been established.
- Recycling procedures reduce the amount of energy required for extracting virgin material.
- Material recycling is the re-melt of materials to make new products.
- Energy recycling is the extraction of heat from burning materials.
- Recycle involves disassembly up to material level.
- Recycle involves reusing materials from used products and components.
- Suppliers are required to collect back recyclable product.
- Suppliers are required to collect back recyclable packaging.
□ Disposal
- The amount of waste for disposal is minimized.
- Disposal involves appropriate storage of waste.
- Disposal involves appropriate dumping of waste.
- Disposal involves appropriate treatment of waste.
Business Performance
□ Environmental Outcome
- Significant reduction of air emission.
- Significant reduction of waste water pollution.
- Significant reduction of solid waste generation.
- Significant reduction of hazardous waste consumption.
- Minimal occurrence in environmental accidents i.e. spills.
- Minimal occurrence in fines or penalties pertaining improper waste disposal.
- Recognition or reward for superior environmental performance.
- Significant improvement in commitment towards environmental management standards or practices.
□ Profitability
- Significant improvement in revenue from after sale services.
- Significant improvement in reclaiming reusable products.
- Significant reduction in inventory investment.
- Significant reduction in cost of goods sold for recovered products.
- Significant reduction in the cost for purchasing raw materials, components or subassemblies.
- Significant reduction in the cost of packaging.
- Significant reduction in cost for waste treatment.
- Significant reduction in cost for waste disposal.
□ Sales Growth
- Significant improvement in sales of used product at secondary market.
- Significant improvement in sales of new products through price discounts.
- Significant improvement in sales of new technologies by means of trade-in programs.
- Significant improvement in market share.
- Significant improvement in relationship with customer to encourage repeat buyers.
- Significant improvement in corporate environmental reputation among environmentally conscious customers.
- Significant improvement in sales growth.