Based on this analysis, the research team identified several potential opportunities for process improvement. These opportunities are illustrative of the types of practical implications, driven by the conceptual model of value streams described earlier that can be identified by applying VSM to a human capital supply chain. The recommendations clustered around three major themes: recruiters and the recruiting position; process management; and education and training. We are not able to implement and evaluate the recommendations at this time; however, they provide an analytical basis for developing the simulation parameters described later.
Recruiters and the Recruiting Position
Insofar as recruiting is responsible for filling the supply chain with sailors, it is a necessary and important supply chain process that potentially adds value to a variety of customers (e.g., the fleet, the specific area where the sailor might be deployed, the U.S. taxpayer, and the sailor). As such, VSM analysis would dictate that recruiting be retained in the ideal state. That said, this particular process is not a purely mechanistic supply chain process, because the effectiveness of the process depends on the motivation and engagement of key actors, particularly recruiters. However, in development of the VSM, researchers found wide levels of variability in the performance of this “link” in the supply chain. Variability suggests that while some performance may be acceptable or even exceptional, some unacceptable performance may be due to inappropriate processing (waste type #4) or may suffer from defects (waste type #7). In examining reasons for this variability the research team found that the position of recruiter is not particularly career enhancing; individuals are assigned to recruitment with little consideration of the fit between the position requirements and the skill sets or job-related interests of the individuals (adverse selection); recruiter goals are not particularly challenging; recruiter training and preparation exists, but may not be particularly effective; and recruiters primarily focus on one source of recruits: high schools.
It may be the case that changing the nature of the recruiter position and structure could lead to more effective recruiters, both in terms of the quantity and quality of recruits. Improving the quantity goal of recruits per recruiter could enable the Navy to streamline the recruiting function and redeploy resources. Improving the quality of recruits is consistent with the movement toward more flexible and adaptable multi-skilled sailors, and may also lead to efficiencies as fewer recruits attrite before shipping out to the fleet.
As a result of these insights, the research team recommended that the Navy consider selecting recruiters based on competencies or motivations that are more likely to lead to high performance. For example, recruitment research suggests that recruiters who are viewed as competent, informative, and interpersonally warm, as well as those with experience in the functional area of the position engender more positive reactions from applicants (Barber, 1998). Research also suggests that recruiters are more effective to the extent they are trained on how to conduct a recruitment interview and deliver a recruitment message, as well as the extent to which recruiter goals and motivations are aligned with organizational goals (Barber, 1998). Research may determine that these or other skills and attributes are associated with successful Navy recruiters and enable the selection of recruiters more likely to perform at a high level. Similarly, it may be that there are alternative populations of recruiters that are inherently more motivated or more adequately prepared (outside of current recruiter training). One example might be Navy retirees who desire to remain active and involved, as many organizations are considering innovative ways to incorporate the growing numbers of retirees into the workforce in a productive manner. Another might be to consider outsourcing the recruiting function to professional recruiters, an approach currently being pilot tested by the Army.
The research team also suggested adjusting the incentive structure for recruiters. It was believed that recruiting goals tended to be easy to meet. A large body of research shows that individuals are more motivated by challenging rather than easy-to-reach goals (Locke & Latham, 1990). At the same time, it appeared that the incentive structure did not motivate recruiters to exceed their goal. As such, the Navy might consider developing an incentive system that would reward recruiters who are able to reach more challenging goals, and also who are able to recruit particularly valuable or hard to recruit populations (e.g., high ability recruits, high demand communities, etc.). Overall, an incentive system that ties some portion of the rewards to longer term outcomes that are valued by the Navy would tend to align the interests and motivations of recruiters more closely with Navy needs.
In addition to the potential problem of adverse selection of recruiters, the research team recommended that the Navy consider improving the training and preparation of recruiters by conducting a needs analysis to evaluate the content and effectiveness of current recruiter training as ineffective training could result in inappropriate and defect-laden recruiting activities.
Finally, the team suggested that the Navy consider diversifying the primary recruiting sources. The heavy reliance on targeting soon-to-be graduating high school seniors leads to “bottlenecks” related to the large number of recruits entering the system at the same time. There may be other populations of qualified recruits not tied to that graduation cycle, e.g., vocational school and community college students or individuals already in the workforce looking for career opportunities that could help smooth the high school graduation cycle bottleneck. The Navy already has processes and personnel in place to make these recruiting visits; however, these outlets tend to receive less emphasis based on historical preference for focusing on high school students.
Process Management
Although the BU community recruitment process has been studied extensively, the research team did identify several areas where it may have been possible to increase effectiveness. The team identified three specific issues: the structure and the use of Delayed Entry Program (DEP) monthly meetings; the integration of recruiting, classifying, and detailing functions; and the potential use of broader measures of recruit values, interests, and personality for selection, classification, and placement.
Many potential recruits commit to joining the Navy, and then enter at a later date. For example, a senior in high school may commit several months before graduating. This is known as the Delayed Entry Program (DEP). While this helps to insure an adequate supply of recruits, DEP inherently possesses waste type #2 – waiting – and potentially represents non-value-added time to the recruit. Consequently, during the interim time period, recruiters hold monthly meetings designed to keep the would-be recruits energized and interested in fulfilling their commitment. The research team recommended revising the content of DEP monthly meetings to increase their value based on the following insights: 1) some percentage of recruits attrite from the program during DEP (the downside of waiting); 2) the monthly DEP meetings are not standardized and may vary widely in content and value (waste #4 – inappropriate processing, waste #6 – unnecessary motion, and/or waste #7 – defects); and 3) recruiters are given little guidance in preparing and managing DEP monthly meetings (again, predisposing the process to variability and defects).
In addition, it was suggested that some elements of later training be moved into the DEP time period to reduce future waiting and incorporate more value for the recruit and the Navy. For example, there might be elements of Basic Military Training (“basic” or BMT) that could be incorporated (e.g., hygiene, communication, personal fitness) into DEP meetings. Furthermore, it may be that there are elements of generalized or community specific training that could be provided via computer-based training (CBT). Incorporating specific and valuable training into the DEP might accomplish two goals. First, it would tend to make recruits feel more invested, more integrated, and better prepared, which could lead to greater DEP retention and BMT success; and second, it might reduce the time and resources required in subsequent BMT and other training.
The process improvement literature has shown the benefits of adopting a “case management” approach to service work (Hammer, 1990; Hammer and Champy, 1993). In line with this, the research team recommended that the Navy consider a case management approach to handling each recruit. The process map revealed that the recruitment, classification, and detailing activities (detailing is matching a recruit’s job preferences with an actual assignment) happen serially, and that there is little integration across the three activities. There may be advantages to be gained in terms of effectiveness of handling and placing recruits where both the recruit’s and the Navy’s needs are best met by developing recruiter-classifier-detailer teams that work together consistently over time to make these important decisions. It was also thought that this approach might help to smooth the flow of recruits into training schools and fleet openings (billets), and lead to greater long-term performance and retention of sailors.
The research team suggested a more extensive use of both cognitive and non-cognitive measures for selection, classification, and placement. For example, in addition to using cognitive ability (e.g., Armed Services Vocational Aptitude Battery (ASVAB) scores), more comprehensive non-cognitive measures of values, interests, and personality (e.g., Navy Computer Adapted Personality Scales (NCAPS) scores) might lead to more successful sailors in terms of both performance and retention.
Education and Training
The A-schools (community specific training that occurs after basic training, but before deployment to the fleet) were significantly affected by fluctuations in both supply and demand. In general, fluctuations in supply and demand give rise to all seven types of waste mentioned earlier: 1) overproduction (sending too many recruits to a specific type of training); 2) waiting (if the training class is full, the recruit may have to wait for a future class, or conversely if a class is not full, the Navy may have to wait for certain number of qualified recruits); 3) transportation (moving recruits from one training location to another because of supply and demand problems); 4) inappropriate processing (identifying training that is inappropriate for the recruit or the Navy); 5) unnecessary inventory (having a surplus of recruits with a specific type of training); 6) unnecessary motion (the need for a recruit to be retrained in a different area due to demand needs); and 7) defects (not conducting the training properly, or selecting recruits that do not have the aptitude for a specific type of training).
Given the potential for this range of problems, the key objective is to attempt to smooth the fluctuations in both the supply and demand, and thus minimize the chances for a variety of waste. For example, there may be ways to smooth supply and demand and lessen resource constraints by outsourcing some portion of training, changing class sizes, offering multiple modes of training, e.g., CBT, and/or moving some of the training activities earlier in the process.
Industry has begun to realize the potential benefits of outsourcing those activities that are not directly tied to an organization’s distinctive competence in the marketplace. Similarly, the research team felt that the Navy might benefit by expanding the outsourcing of some of its A-school training, since it is not uncommon for recruits who have successfully completed BMT to have to wait for A-school seats to become available, and that during these waits there may be little of value for them to do. On the other hand, there are times when A-schools are underutilized, depending on the ebb and flow of demand. Therefore, having a pool of qualified educators (e.g., retirees, reservists, professional educators) available but not employed full-time as A-school trainers by the Navy would provide greater flexibility in response to demands. Smaller A-school training staffs could be on hand, with contingent trainers available to meet surges in demand.
As mentioned earlier, it might be beneficial to the Navy if portions of A-school training could be moved earlier in the recruiting and training process. To the extent that recruit communities are identified early in the process and/or that broad competencies required of large numbers of recruits can be identified, portions of A-school training might be moved earlier in the process, perhaps via CBT. This might help level the demand for A-school seats, lessen resource constraints in A-schools, provide meaningful activity for recruits waiting for seats to open, and perhaps create greater investment on the part of recruits in their respective communities.
Value Stream Mapping Conclusion
Value stream and process mapping while basic in approach, are highly effective in gaining an understanding of supply chain activities, and in evaluating the activities and processes along the two dimensions of waste and added value. The concepts on which they were founded – efficiency and quality – have been studied academically and applied in the field for over 100 years, and these specific methods have been used for years in the examination of product supply chains. They were extremely useful in this research in capturing the complex and interrelated nature of the Navy’s BU Community supply chain for sailors. Many organizations could potentially benefit from using these tools to map their human capital flows. While developing detailed process maps requires time and effort, the associated benefits are well worth the effort as opportunities for improvement can be readily identified from these maps. However, a limitation of the process mapping approach is that the identified improvement opportunities require investments of time and resources to make changes to supply chain activities often without a clear understanding of the supply chain-wide implications of these changes. Simulation modeling, using the process map developed as input, is a low cost approach for organizations to experiment with the effects of making changes to the human capital supply chain prior to actually making these changes.
Simulating HR Processes
Simulation has a long history of use for analyzing a variety of problems and processes, as well as for theory building (Davis, Eisenhardt, & Bingham, 2007; Harrison, Lin, Carroll, & Carley, 2007). However, the application of simulation tools to human resources issues over a long time horizon has received relatively little attention. This is likely due to the uniqueness of the individuals moving through the system, as compared to typical production systems in which flows are, in many cases, homogeneous, inanimate objects. Nevertheless, some interesting work has been done, on both short-term and long-term problems.
Two papers by Dawson simulate employee activities on short-term problems. The first seeks to use a simulation model to aid in pricing employee contributions, modeling the employees as resources influencing the value of a good (Dawson, 1988). The second considers a “stock control” paradigm, modeling employees as items on demand (Dawson, 1989). Hansford, Grove and Sweeney (1992) use simulation to investigate how organizational structures affect costs, risks and timing. Their goal was to determine how employee structure could influence ability to respond to unforeseen circumstances, while maintaining a cost-effective workforce. Geerlings and van Veen (2001) create a model that simulates career paths for employees, based on a set of inputs. This paper evaluates the manner in which changes in corporate policy and employee practices play out over a long-term period. In a large-scale, nation-wide assessment, Magdaleno (2003) reveals how state examinations for medical specialists in Spain cause the supply and demand of these specialists to be imbalanced. Such an insight could have a significant impact in other areas in which similar systems are employed to serve a community. In another national study, Whalley and Zhang (2006) use simulation to determine how migration restrictions influence wage inequality in China. Their paper showed how current practices hinder equity, and reveals the speed with which equity could be achieved if such limits were eliminated. In a very interesting multi-criteria military application, the work by Levy (2007) is employed to determine the tradeoffs involved in modifying the enlistment age in a country. The goal is to determine the costs and benefits of a particular enlistment age, relative to both military values and civilian productivity.
The above simulation efforts primarily focus on the workforce as an entity, rather than modeling each individual, and are published in operations and supply chain focused outlets. The emphasis in this study is on illustrating the use of simulation modeling as a tool to aid organizations in assessing how HR practices and decisions impact the entire human capital supply chain. This research analysis on Navy operations covers a time range of almost three years (with subsequent research extending the period of concern to eight years). Additionally, the Navy study is integrative in nature, considering multiple objectives and multiple players. The goal here was to explicitly capture Navy Personnel’s theme of “Right Person-Right Place-Right Time,” and with the help of this simulation effort, the Navy will include in that goal, “Right Cost.” These tools may aid organizations in moving toward what Cappelli (2008) calls “talent on demand capability.”
Simulation Model Development and Validation
The value stream map developed for the Builder Community’s street-to-fleet process provided a number of productive discussions with the Navy Personnel Command around which the aforementioned potential areas of improvements were identified. Effective assessment and impact-analysis of the suggested improvements or other opportunities on the street-to-fleet process may be pursued by two methods. First, the organization may actually implement the strategies identified for improvements and then conduct follow up studies to assess their impact on the process. However, there are serious limitations associated with this approach. The introduction of the potential improvement strategies into the process could be (a) disruptive to day-to-day operation of the process under study; (b) time-consuming; (c) costly; (d) might be ineffective; and (e) might have unforeseen effects on other parts of the human capital supply chain. Rather than experimenting with the actual process to assess improvement opportunities, the second strategy focuses on creation of, and experimentation with the virtual representations of the process under study. These virtual representations are known as digital simulation models. They provide an effective virtual laboratory to assess a variety of alternative improvement ideas and conduct a host of “what-if” analysis efficiently, prior to actual implementation.
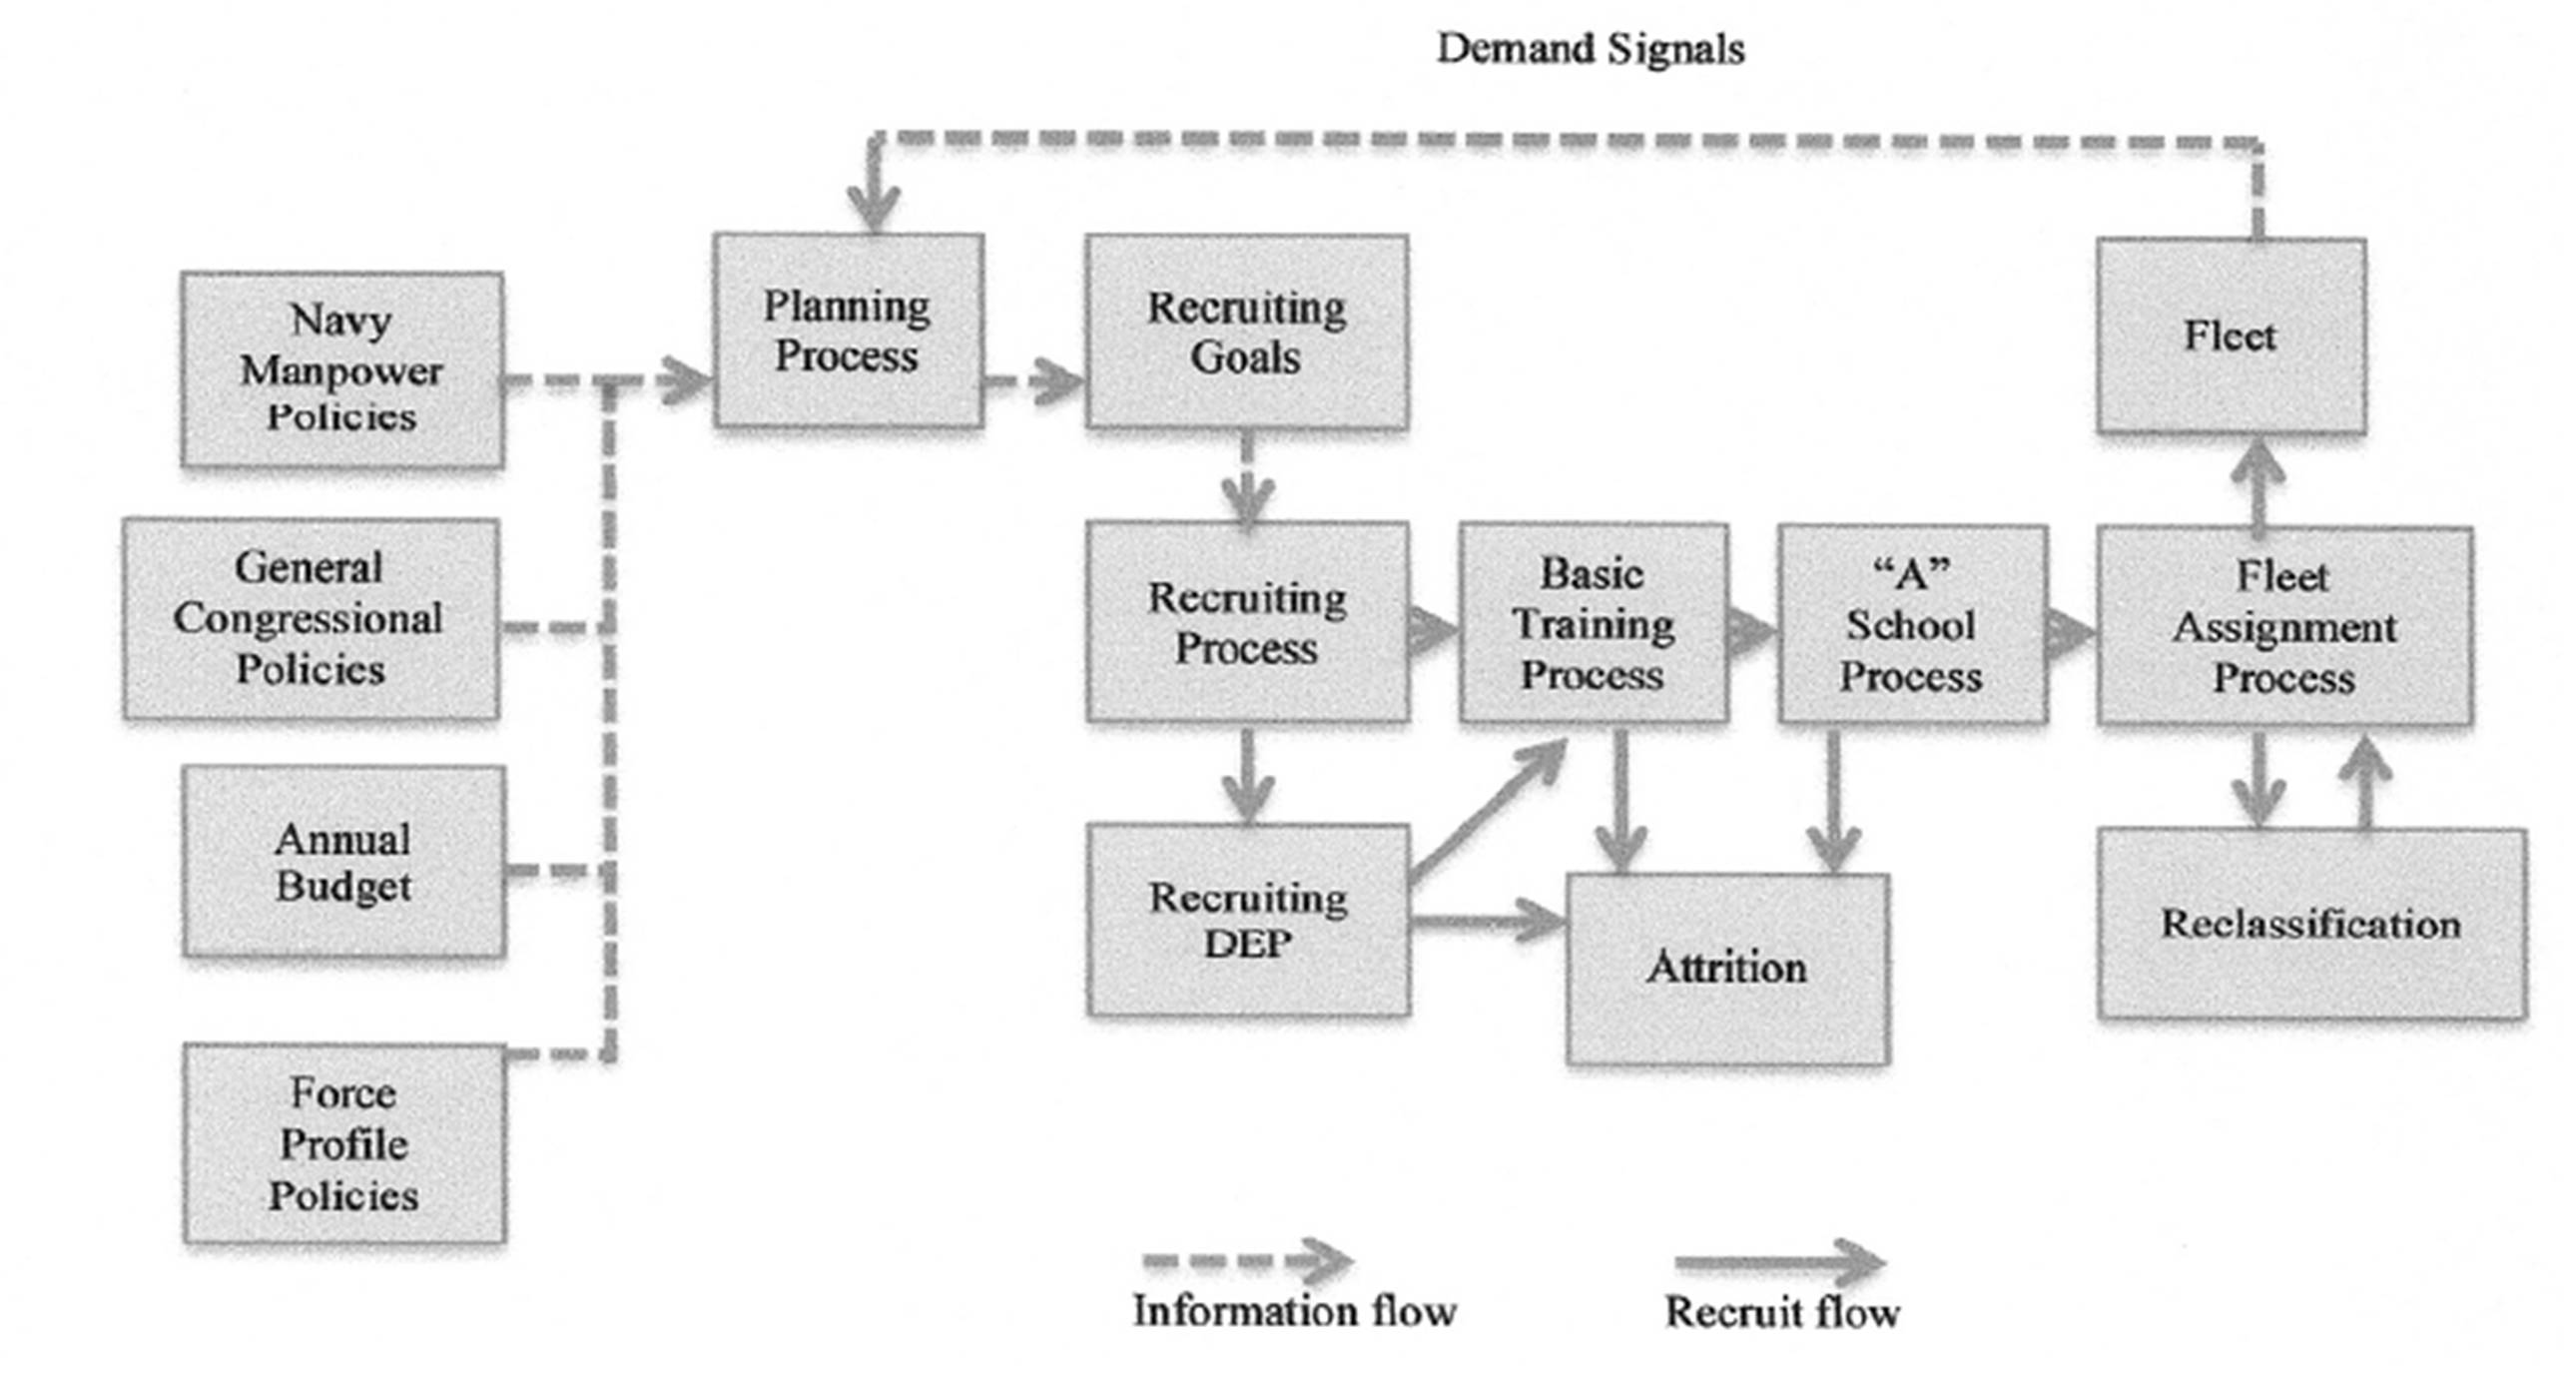
To develop a simulation model representing the current street-to-fleet supply chain, the research team, in working with the Navy, decided to include four of the five key processes in the model, including recruiting, basic training (BMT), A-School, and fleet-assignment processes. In order to keep this pilot research project within its expected scope, timeframe and cost, the research team decided to exclude the planning process from the model. Further justification for this exclusion was due to the fact that the planning process is not part of the BU Community Manager’s responsibilities. Planning goals and objectives for the BU Community are given; however, the other four processes are the responsibility of the BU Community Manager.
The preliminary simulation modeling activities included parallel efforts to (a) determine a data matrix with which to populate the simulation model; (b) collect the relevant data from different data sources; and (c) develop a simulation model to represent the process under study as-is. Using Arena© software, the first simulation model developed for the process represents the BU Community street-to-fleet supply chain as-is, henceforth referred to as the Base Simulation Model (BSM). The main parameters and assumptions for the BSM are as follows: simulation time period is set to 36 months with a warm-up period of 12 months; the model targets 325 fleet-qualified recruits; A-School batch size is set to 40; and A-School duration is set to 113 days. The base simulation model was designed to collect statistical information for a number of important process variables to be used for performance assessment purposes. These variables include statistics concerning attrition/reassignment counts and times, the number of fleet-qualified recruits, recruit time-in-process, and total time in the street-to-fleet supply chain. Attrition is defined as a departure of a recruit from the Navy. Reassignment is defined as a movement from one Navy community to another.
The Navy’s personnel management process is an extremely decentralized activity, with most components in the process having their own data systems. As the VSM was being developed, all data sources were identified – from the recruiters’ information on potential recruits (age, gender, qualifications, interests, etc.) to the requests for personnel by each command component within the Navy. Using the value stream map, we developed a simulation model, depicting supply chain processes, interactions, and decisions. While developing the value stream map, a data matrix was developed, indicating data requirements for the base simulation model. Soon, we realized that the data are scattered throughout databases managed by the different organizational units responsible for the street-to-fleet supply chain processes. In order to collect one year’s data required access to 14 different databases for the street-to-fleet supply chain operation. The collected data were verified, processed and utilized to populate the base street-to-fleet simulation model.
One of the more challenging components of the model was the training section. Training provides educational courses to the various communities. These course offerings vary throughout the year, based on the rate of incoming recruits. As such, the availability of courses was explicitly varied with demand, rather than assuming constant course offerings through the study period. To further address the issue, a sensitivity analysis focused on the course parameters of start times and class sizes, to ensure that the policy implications were robust.
Another challenging aspect of the model was the arrival rate data. This was separated into two key steps – the “arrival” of the potential recruit to the recruiting office (RO), and the “arrival” of an accepted recruit into the Navy intake system. The arrivals to the RO are fairly balanced throughout the year, and the exponential distribution was the appropriate model. On the other hand, accepted recruits in the Builder Community tend to arrive more heavily in the summer, with the climb beginning in May, peaking in September and then declining. This sinusoidal behavior was captured in the DEP process.
In addition to developing a base simulation model to represent the street-to-fleet supply chain as-is, the research team and Navy representatives decided on three typical what-if scenarios and for each scenario an Arena© simulation model was developed. To keep the illustration manageable, we focused on two key issues suggested by the VSM analysis: recruiting goals and A-school class sizes. Given the base simulation model’s features, we characterize these scenarios as follows:
Scenario 1: Studying the Impact of Inaccurate Recruiting Goals
Given the base simulation model, we increased the recruiting rate (RECR+10%) from 10% to 20%. The primary rationale for investigating this possibility is that it is something that is often done. In addition, since changes in the recruiting rate are felt at the very start of the system, it is to be expected that the effects will propagate through the system. In practice, the reason for altering the recruiting rate for a particular community is simple: demand for members of that community has either increased or decreased.
Scenario 2: Studying the Impact of Modifications in A-School Structure
We developed two sub-scenarios for this case:
Sub-Scenario 2-A: Decreasing the A-School class size from 40 to 30 (CLASS-10). In early discussions with Navy personnel, it became apparent that there might be advantages to modifications to the structure of A-School. Class size was cited as one parameter of interest. The size of the class is a potentially sensitive element, and can have a considerable effect on the timing of a recruit’s arrival to the fleet. Smaller classes can reduce the time between completion of basic and the start of A-School for recruits. On the other hand, large classes might lead to a longer wait for some, but also produces a larger pulsing of the sailors through the process.
Sub-Scenario 2-B: Increasing the A-School class size from 40 to 50 (CLASS+10). Since the relationship between class size and the sailor’s time-to-fleet is not expected to be linear, we decided that one scenario should address a possible increase in class size.
Scenario 3: Studying the Impact of Responses to Demand Signals
Given the base scenario, we increased the recruiting rate to 20% for the first six months of simulation and reset it back to the base case of 10% (RECRUIT-VARIABLE). The assumption of the base case is that the recruit rate is constant throughout the simulated period. In practice, this is not the case. In this scenario, we investigate the impact of periodic alterations of the recruit rate. In this scenario, the recruiting rate is initially 10% higher than the base rate, and then dropped to 10% below the base rate late in the simulated period. The goal is to determine how modifications to the recruit rate propagate through the system; in particular, the lead time between a decision and its fleet impact.
Our analysis of systemic impacts focused on two attributes: central trends such as minima, maxima, and averages, as well as issues in variability. The rationale for looking at minimum and maximum values is straightforward; these are the “best case” and “worst case” outcomes for each parameter. The average suggests the anticipated outcome of long-term, repetitive, behavior. In addition to these standards we also investigate how volatile the system might be; that is, whether there are any changes that cause dramatic fluctuations to occur in the various system performance measures. One challenge to validation of the Navy personnel system is the tendency to constantly “tweak” the parameters. Modifications are constantly being made throughout the system. As a result, a true policy is non-existent; capturing these ‘tweaks” is not feasible – nor warranted – in the simulation. Rather, an average static policy is assumed. As such, while the average difference between any output measures, say attrition, is small, the standard deviation is not.
In the simulation modeling context, validation refers to the task of ensuring that the model behaves the same as the real system. In our study, the validation process assesses whether performance of the base simulation model depicts the performance of the actual street-to-fleet supply chain. Validation of the model was therefore addressed via two approaches. The base case results were directly compared to actual outcomes. In particular, we compared simulated and historical results of the following key items: attrition at the various points; over- and under-supplies of recruits; course demand levels; and DEP levels throughout the year. All were within 5% of actual values. The other validation element focused on the more difficult “what if…?” cases. Since there is no historical value to compare against, our attention was instead on the direction and magnitude of the effect. Class size variation is a simple example of such an expectation. When class size is reduced, more classes are offered, and class fills approach 100%. These results were confirmed with Navy personnel experts. Availability of limited historical data did not allow the study to have a dataset for model building and another subset for validation. Hence, our model validation process followed recommendation offered by Kelton et al., (2004) when historical data is lacking or very limited. Thus, process-by-process, the results were validated by the Navy subject matter experts.
Simulation Modeling Results
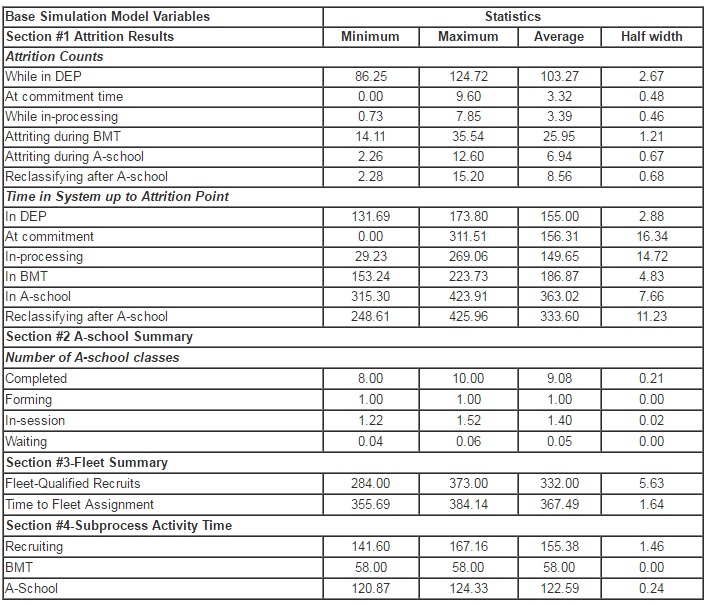
The base and scenario models were produced based on three years of data, collected from various sources within the Navy. In producing the final simulation results, we determined that the system arrives at its steady-state in 400 days. To avoid statistical biases, system performance statistics were collected after the system reached its steady-state. Also, the simulation results and conclusions presented are based on 50 replications of simulation runs for the base and the four scenario analyses. The results of the base model and scenario simulations are presented in Tables 1-5. Each table shows the key performance measurements for the street-to-fleet supply chain, followed by four statistics: min, max, average and half-width. These statistics indicate the minimum, maximum, average, and standard deviation associated with each performance measurement, observed in the simulation run. For example, consider Attrition Counts in Table 1, Base Simulation Model Results. The simulation replication results indicate that the observed minimum, maximum, average, and standard deviation of Attrition Counts While in DEP are 86.25, 124.72, 103.27, and 2.67, respectively. If we consider the results shown in Tables 1 and 2, we see that the standard deviation is fairly small, suggesting that 50 replications are adequate. The coefficient of variation (standard deviation divided by the mean) for all of the outputs in the tables is below 10% (except for in-processing attrition, and BMT attrition, which are fairly small factors). All results are significant, in that the differences due to parametric changes are much larger than those related to the standard error.
Table 1: Base Simulation Model Results
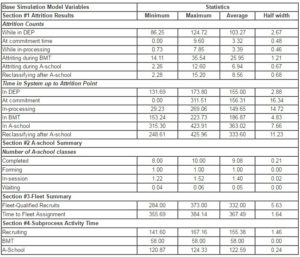
Table 2: Scenario 1 Simulation Model Results
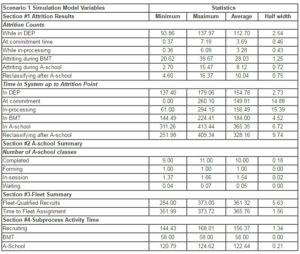
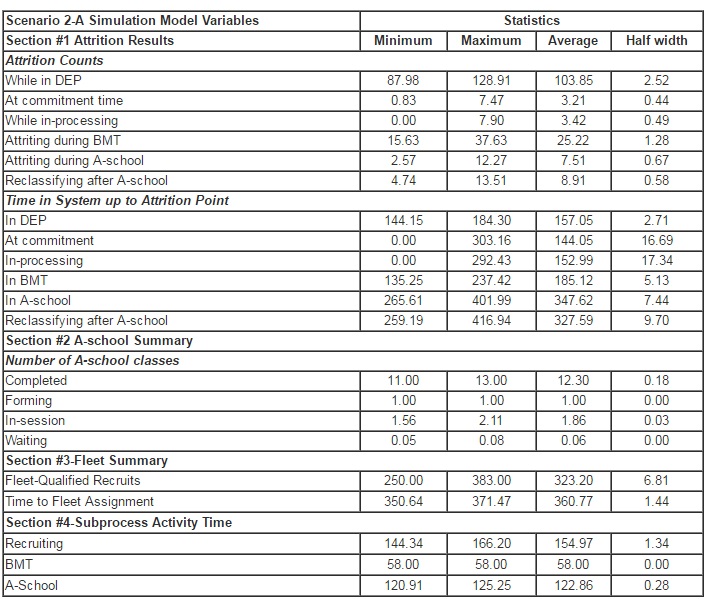
Table 3: Scenario 2-A Simulation Model Results
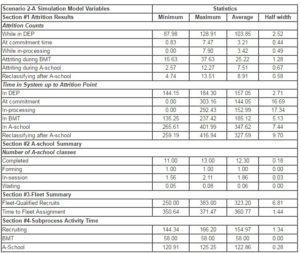
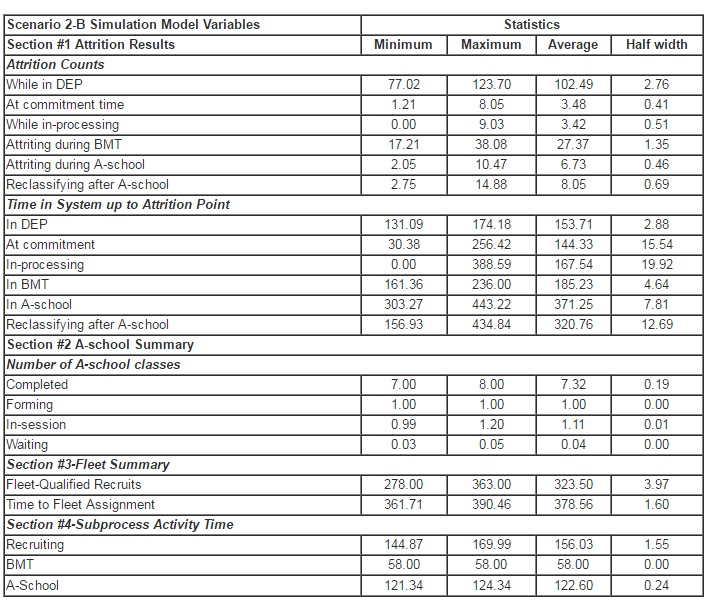
Table 4: Scenario 2-B Simulation Model Results
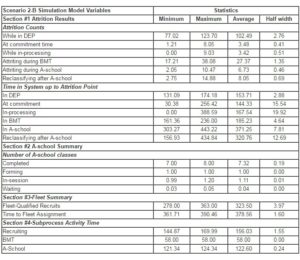
Table 5: Scenario 3 Simulation Model Results
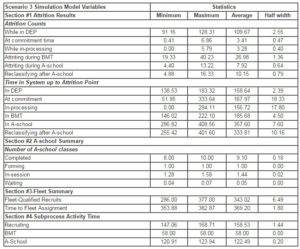
Statistics shown in these tables were collected in the following categories: attrition counts from each of the six exit points; times in the system for sailors that attrite from each of the exit points; A-School; number of fleet-qualified sailors and time in system; and time in each of the three sub-processes (DEP-to-BMT, BMT-to-A-School, A-School-to-Fleet).
The six possible attrition points are: while in the Delayed Entry Program (DEP); after DEP, but prior to commitment; at in-processing; during Basic Military Training (BMT); from A-School; and reclassifying to another Navy community, which is attrition from the BU community but not the Navy.
Attrition counts in all categories showed an increase commensurate with the increase in the recruiting rate, which is to be expected. The changes were negligible with respect to changes in class sizes. In terms of attrition times, average times are fairly consistent for attritions from DEP and from BMT, the two most common attrition points (Figure 3). There is a noticeable difference between average times from other points; however there are only a few recruits leaving at these points. There appears to be a significant impact on attrition time from attrition points later in the system as class size changes; this highlights the necessity of carefully evaluating and planning changes in A-School structure (Figure 4).
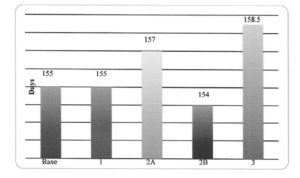
Figure 3: DEP Attrition Times Scenario Comparison
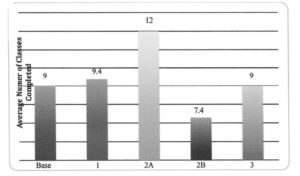
Figure 4: A-School Attrition Time Scenario Comparison
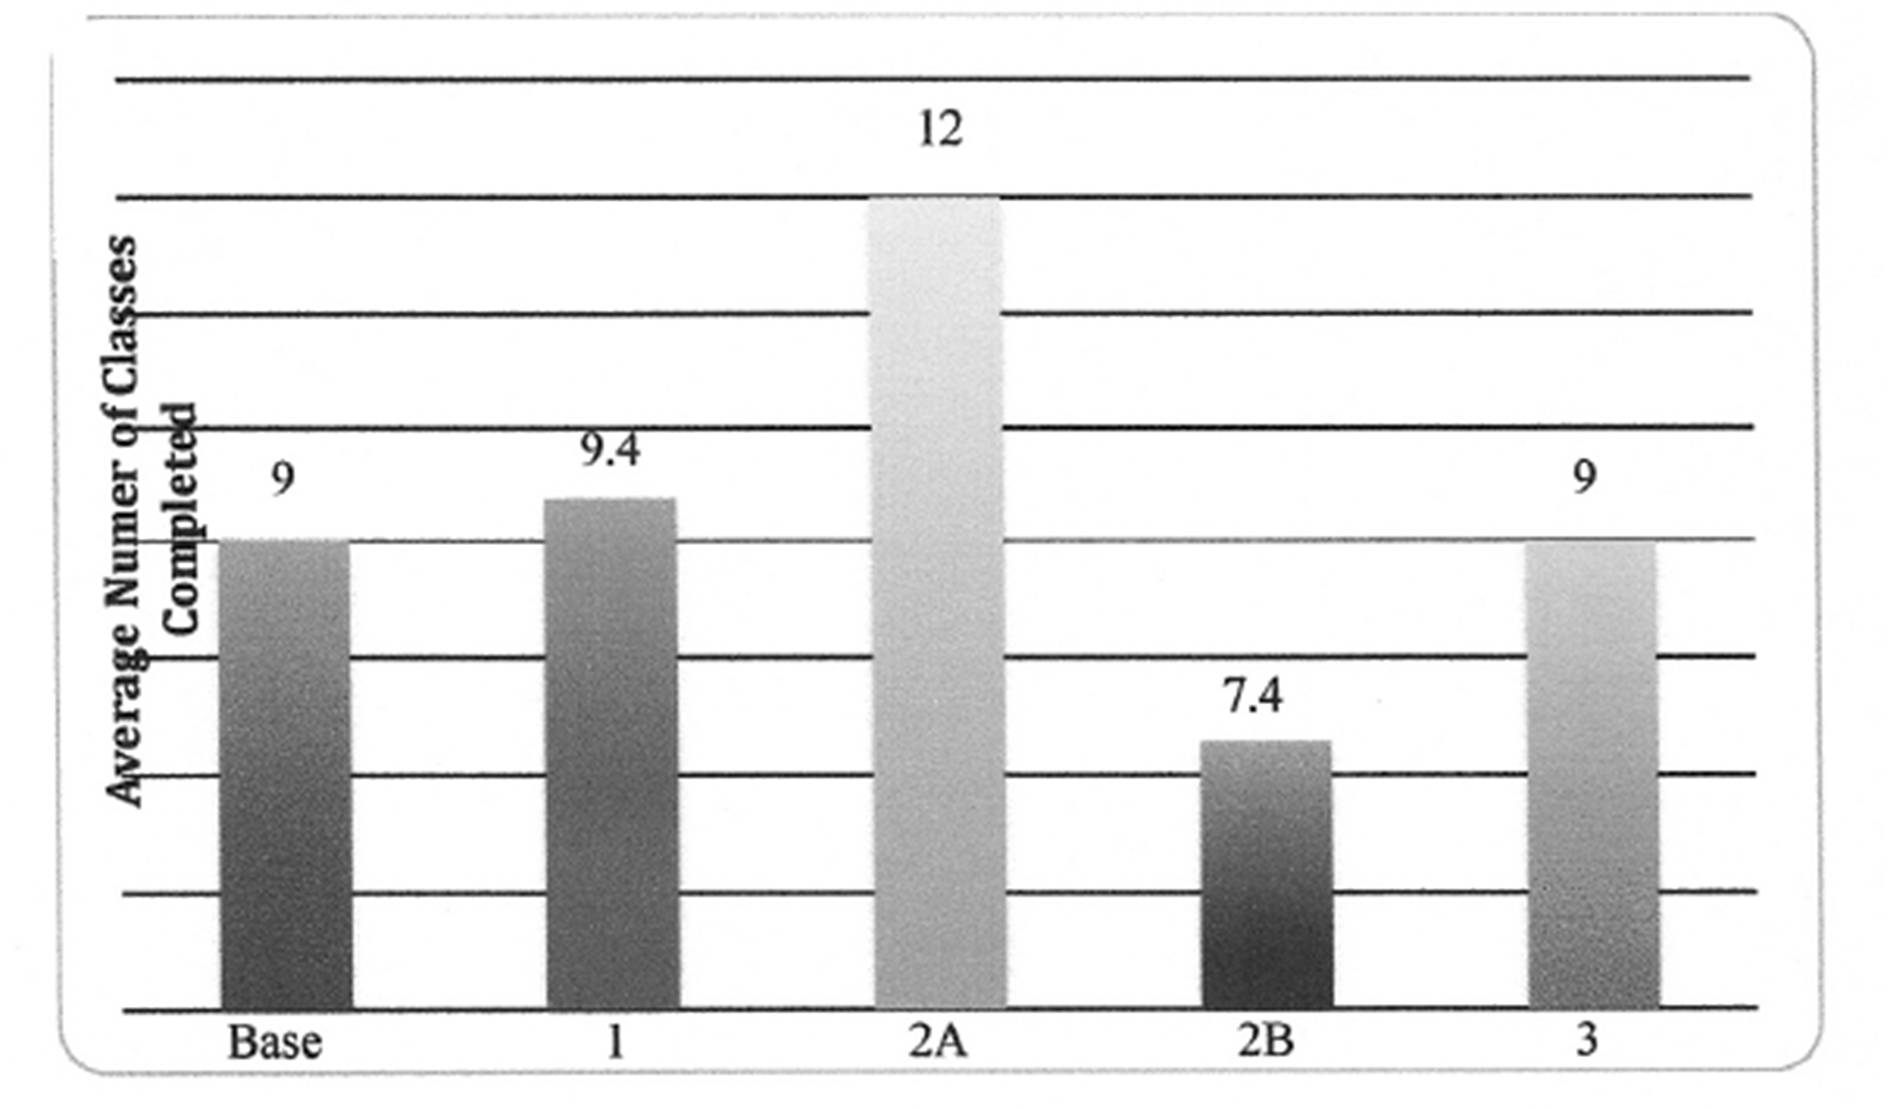
In terms of classes (Figure 5), when recruit rates were varied, the number of completed classes changed slightly; major changes in recruiting would likewise lead to larger increases in the number of classes. In particular, we should note that either increasing or decreasing classes by ten sailors impacts the number of classes completed (an average of 12.3 classes were required when there are 30 sailors in a class, and only 7.3 when the class size is increased to 50 sailors).

Figure 5: A-School Class Completion Scenario Comparison
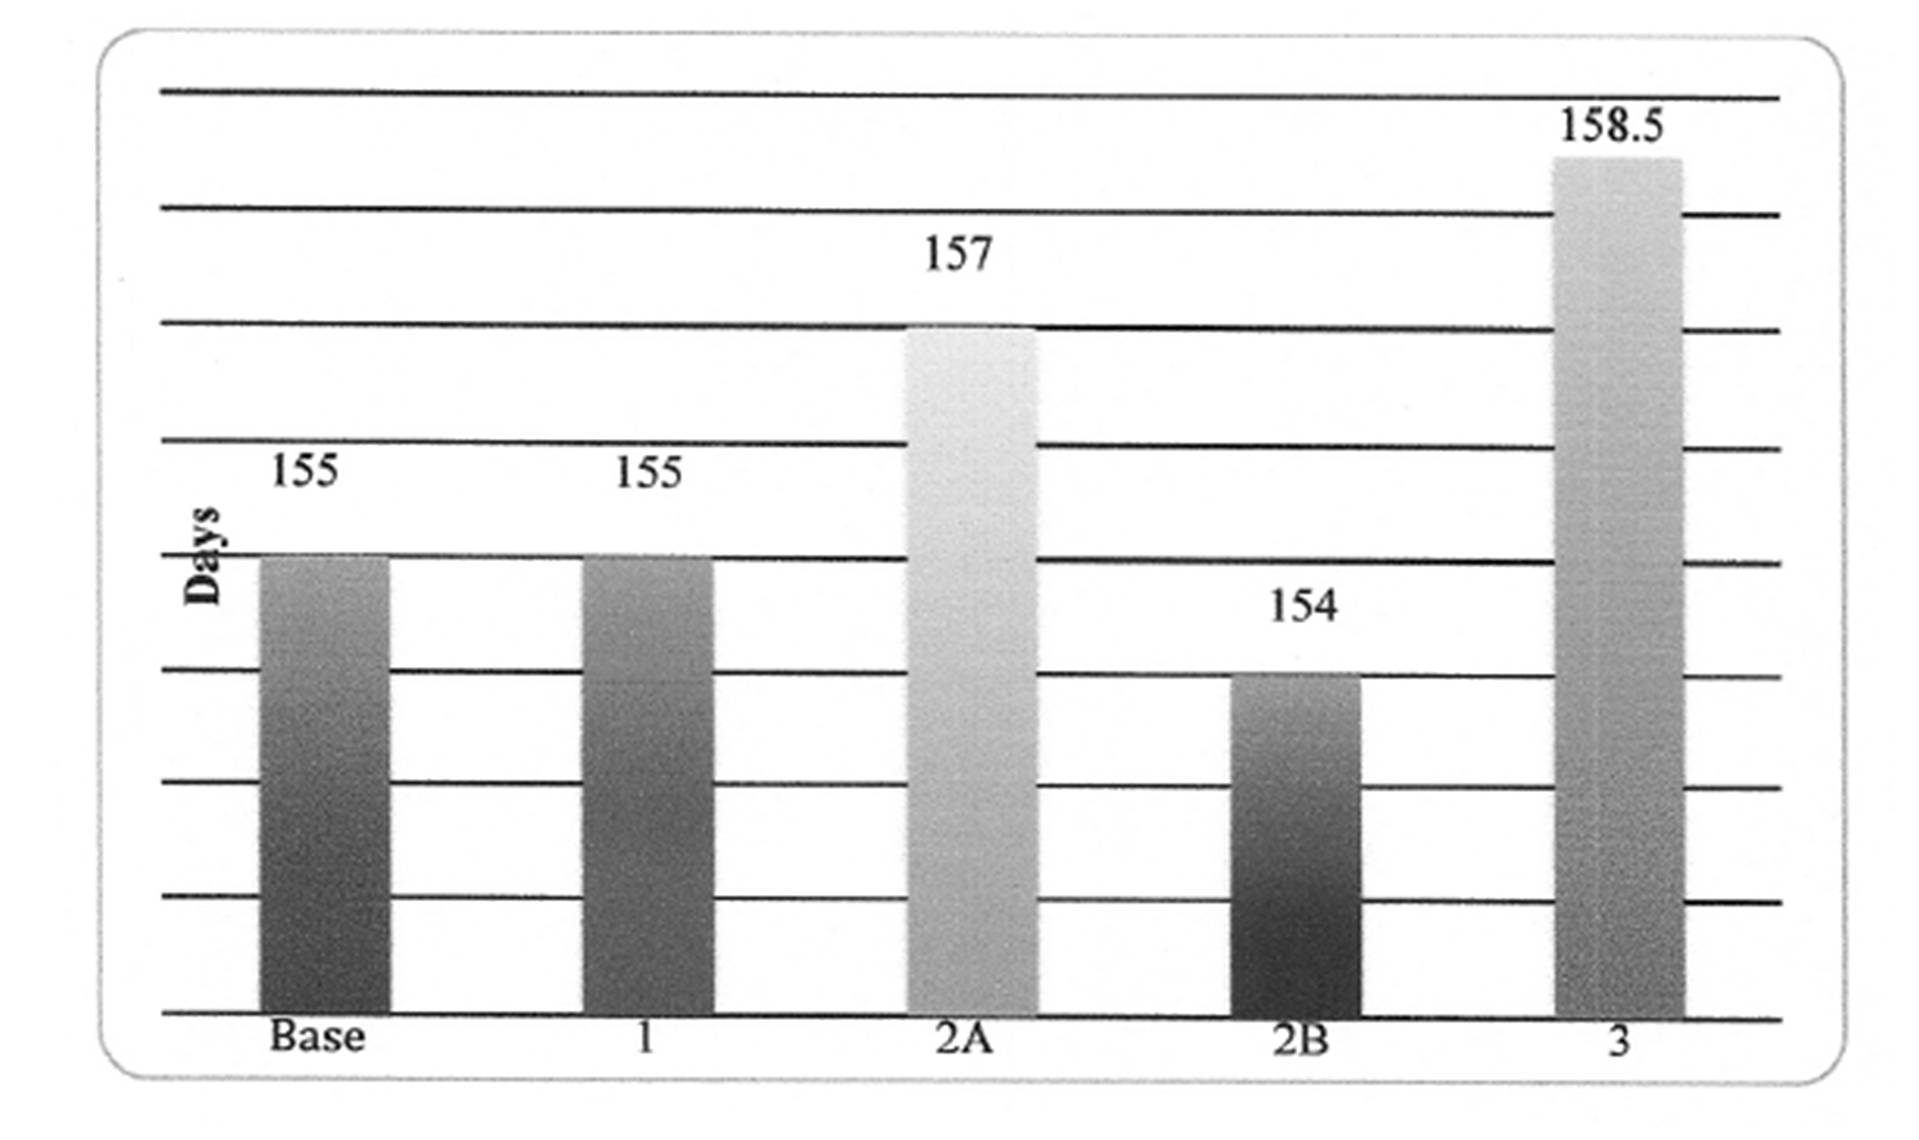
In terms of fleet statistics (Figures 6 and 7), as expected, an increased recruiting rate resulted in a higher number of fleet-ready sailors. Scenario Three, in which the recruiting rate was altered during the year, suggests that there needs to be some control on the lag associated with a change; in this case, where ultimate demand was 325, the total number of fleet-ready sailors was 5% over the number demanded; indicating that the drop in the recruiting rate should have begun earlier. Class sizes did not have a significant impact on the number of fleet-ready sailors, and, in fact, also met the goal. Average reporting time to the fleet was not impacted by changes in the recruiting rate. Reporting time was influenced by class size; in fact, the result is a non-linear one, suggesting that having classes too small, or too large, can have a negative impact on readiness targets. In terms of sub-process times, for the scenarios under consideration, the average time in each of the three sub-processes was not impacted.
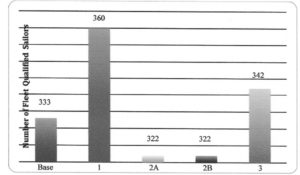
Figure 6: Fleet Qualified Sailors Scenario Comparison
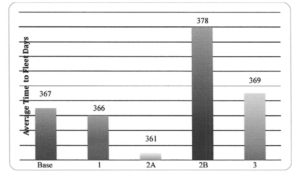
Figure 7: Average Time-to-Fleet Scenario Comparison
Discussion
It is evident from the analysis that the Navy Personnel Supply Chain is a highly complex system, with numerous competing objectives, and a host of stakeholders with significant power to implement changes that can ripple through the system. While the Navy’s Personnel Command was encouraged by the value stream map and the results of the simulations, the “what if” scenarios
conducted in this research represent only a fraction of the studies of interest to the Navy Personnel Command. One particular area of concern is the volatility of the entire system – how small changes in policy can result in significant changes in personnel delivery downstream, an issue that will certainly be exacerbated when a longer timeframe is addressed. The Navy’s goal of simultaneously addressing operational effectiveness and employee concerns is an admirable one, and one which should be fruitful. Interestingly, not all objectives of sailors are at odds with those involved in
management. In particular, it is apparent that activities aimed at retention tend to smooth the system, resulting in less volatility and better control throughout the process.
Conclusion
We believe this study makes several important contributions. One, we develop the idea that supply chain principles can be applied to the flow of human capital through organizations. Talent management is a growing concern for many organizations, and there are many tools being used to manage the recruitment, selection, placement, internal mobility, and attrition of human capital such as Web-based recruitment systems, demand forecasting models, and sophisticated development strategies. However, SCM provides an overarching framework for thinking about the flow of human capital that has been successfully applied to other organizational processes. We feel that applying SCM principles to the flow of people is promising for future research and practice.
Two, we begin to identify the similarities and differences between human capital and more traditional supply chains. For example, we discuss the application of the ideas of upstream suppliers, internal functions, and downstream customers in the context of the flow of people. At the same time, we recognize that there are differences, and future research that continues to flesh out these similarities and differences would be valuable. For example, there are several other core ideas relevant to SCM (e.g. global versus local optimization; supplier quality assurance; supplier development) that may also be relevant to human supply chains. Also, the ‘product’ in a human supply chain has independent motivations and goals as well, such as the type of job that would represent a good fit for the individual’s needs and skills. For example, the Navy and other organizations offer financial incentives to motivate certain behaviors; responses to incentives could be introduced into simulation models based on historical data on these responses. Going an additional step, the development of agent based modeling methods may enable incorporation of more complex human motivations and behaviors. Agent based modeling simulates the actions and interactions of autonomous individuals to assess effects on a system as a whole; as additional information on individual preferences becomes available, agent based modeling tools may provide additional insight into simulating the human element.
Three, we illustrate the practical use of two key SCM tools, VSM and simulation modeling, to understanding human capital flows. Understanding the timing, decision making, and costs associated with the entry points, flows, and exit points of people in organizations, particularly large complex organizations, may be challenging for many managers. VSM is a practical tool that provides an intuitive visual representation of these processes. Research and experience show that a well-developed VSM not only provides a clear ‘as-is’ picture of a process, but also aids in the identification of potential points of leverage for improving process performance in terms of time, costs, inefficiencies, and effectiveness. Additionally, after identifying potential process improvements, simulation modeling is a valuable tool widely used in SCM, but less widely used by HR decision makers to assess the likely impacts of system changes without disrupting the current system. Simulation is a comprehensive and robust tool in that it: allows virtually limitless assessment of various ‘what-if’ analyses; is user-structured, allowing the user to determine appropriate scenarios; allows for the assessment of trade-offs in model parameters over various time frames; and is particularly appropriate for complex, multi-objective processes with multiple decision makers.
From a practical perspective, these tools could be used to study the impact of other parameters on recruitment and staffing flows, other human capital related process flows, and the impact on organizational effectiveness. For example, our analysis focused on one job type and began solely with entry-level recruits. In other organizational contexts, job and recruit characteristics such as task complexity, task interdependence, job level, or years of experience could be incorporated as explanatory parameters, while individual or unit-level performance could be incorporated as outcome variables. Similarly, our analysis focused on attrition from initial training, but other organizational context may call for incorporating levels and patterns of voluntary employee turnover. As an example, Kohn (2009) suggests simulating the impact of varying patterns of employee turnover on workforce performance capability. By varying parameters such as attrition patterns, workforce characteristics, and task interdependence, such a simulation could shed light on the turnover-performance relationship that is difficult to study in controlled conditions in the field.
There are of course limitations to this study. One is that our examples relied on the Navy, a very large and complex organization that may differ in important ways from the private sector. Future research that assesses the generalizability of these ideas and applications to different types of organizations would be valuable. Similarly, within the Navy we focused on one job family; future research that assesses the generalizability of these ideas and applications to a variety of job types would also be valuable. Further, we only examined a limited number of scenarios in the simulation. These were chosen by the organization as of interest to them and by the VSM analysis, and it would not be possible to consider all possible variations. Nevertheless, there are likely many other parameters and scenarios that would be of interest to HR managers and scholars, and future research into these are also warranted. For example, our process map and simulation do not take into account individual job performance. The Navy considers a qualified and successfully trained fleet-ready sailor as the ultimate indicator of a successful street-to-fleet process; however, the Navy and other types of organizations are likely also interested in the actual job performance of those who are recruited, trained, and placed. There is no reason job performance cannot be incorporated into value stream maps and simulations in future research with organizations that desire to include that information. Finally, our model verification process relied in part on validation by Navy experts. Future research able to validate simulation results against empirical data would be valuable.
In sum, we believe there is great value to be had by considering the flow of human capital into, through, and out of organizations through the lens of supply chain management. We hope our description and illustration of the application of SCM principles and tools to key HR processes will stimulate managers and scholars to pursue these ideas further.
(adsbygoogle = window.adsbygoogle || []).push({});
References
Amini, M., Racer, M., Cashbaugh, D., Blackstone, T., Jones, T., and Myers, R. (2008), “Simulation Modeling and Analysis of the Street-to-First-Contract-Renewal Supply Chain,” INFORMS Annual Meeting, Washington DC, October 12-15.
Bicheno, J. (1994), The Quality 50, Buckingham, PICSIE, Books.
Boyer, K. and Verma, R. (2010), Operations and Supply Chain Management for the 21st. Century, South-Western Cengage Learning, Mason, Ohio.
Cappelli, P. (2008), ‘Talent management for the twenty-first century,’ Harvard Business Review, 86, 74-81.
Chopra, S. and Meindl, P. (2004), Supply Chain Management, 2nd. Edition, Prentice-Hall, Upper Saddle River, NJ.
Davis, J., Eisenhardt, K. and Bingham, C. (2007), ‘Developing theory through simulation methods,’ Academy of Management Review, 32, 480-499.
Publisher – Google Scholar
Dawson, C. (1988), ‘The accounting approach to employee resourcing.’ Management Decision, 26, 31-36.
Publisher – Google Scholar
Dawson, C. (1989), ‘The application of stock control principles to employee resourcing,’ International Journal of Manpower, 10, 28-31.
Publisher – Google Scholar
Geerlings, W.S.J. and van Veen, K. (2001) ‘Simulating patterns of organization careers,’Computational & Mathematical Organization Theory, 7, 287-310.
Publisher – Google Scholar
Giehll, T. and Moss, S. (2009) Human Capital Supply Chains, Langdon Street Press, Inc., Minneapolis, MN.
Hammer, M. (1990), ‘Reengineering work: Don’t automate, obliterate,’ Harvard Business Review, 68, 104-112.
Hammer, M. and Champy, J. (1993), Reengineering the Corporation: A Manifesto for Business Revolution, HarperCollins, New York.
Handfield, R. B. and Nichols, E. L. (1999), Introduction to Supply Chain Management, Prentice-Hall, Upper Saddle River, NJ.
Handfield, R.B. and Nichols, E. L. (2002), Supply Chain Redesign: Transforming Supply Chains into Integrated Value Systems, Prentice-Hall, Upper Saddle River, NJ.
Hansford, L.C., Grove, J.R. and Sweeney, P.J. (1992), ‘Using simulation technology in organizational development,’ Journal of Systems Management, 43, 28-32.
Harrison, J., Lin, Z., Carroll, G. and Carley, K. (2007), ‘Simulation modeling in organizational and management research,’ Academy of Management Review, 32, 1229-1245.
Publisher – Google Scholar
Hines, P., Laming, R., Jones, D., Cousins, P., and Rich, N. (2000), Value Stream Management: Strategy and Excellence in the Supply Chain, Financial Times Prentice Hall, London, England.
Japan Management Association (1985), Kanban: Just-in-Time at Toyota, Productivity Press, Cambridge, MA.
Kanigel, R. (1997), The One Best Way: Fredrick Winslow Taylor and the Enigma of Efficiency, Viking, New York.
Kelton, D.W., Sadowski, R. P. and Sturrock, D. T. (2004), Simulation with Arena, 3rd. Edition, McGraw-Hill, New York.
Kohn, H.D. (2009), ‘The employee turnover-workforce performance relationship: An analysis using computational simulation,’ Academy of Management Annual Conference.
Kumar, S. (2003), ‘Managing human capital supply chain in the Internet era,’ Industrial Management & Data Systems, 103, 227-237.
Publisher – Google Scholar
Lee, H. L. and Billington, C. (1992), ‘Managing supply chain inventory: Pitfalls and Opportunities,’ Sloan Management Review, Spring, 65-72.
Levy, A. (2007), ‘Optimal enlistment age: An analysis and some simulations,’ European Journal of Operational Research,180, 418–425.
Publisher – Google Scholar
Liker, J.K. (2004), The Toyota Way, McGraw-Hill, New York.
Locke, E. and Latham, G. (1990), A Theory of Goal Setting and Task Performance, Prentice-Hall, Englewood Cliffs, NJ.
Magdaleno, M.I.A. (2003), ‘Dynamic analysis of medical specialist training policies in Spain’ International Journal of Healthcare Technology & Management, 5, 381-393.
Publisher – Google Scholar
Monden, Y. (1993), Toyota Production System: An Integrated Approach to Just-in-Time, 2nd. Edition, Industrial Engineering and Management Press, Norcross, GA.
Publisher
Shingo, S. (1989), A Study of Toyota Production System from an Industrial Engineering Viewpoint, Productivity Press, Cambridge, MA.
Towell, D.R. (1996), ‘Industrial dynamics modeling of supply chains,’ Logistics Information Management, 9, 43-56.
Publisher – Google Scholar
Whalley, J. and Zhang, S. (2007), ‘A numerical simulation analysis of (Hukou) labour mobility restrictions in China,’ Journal of Development Economics, 83, 392-410.
Publisher – Google Scholar