Introduction
The fate determination of native strains of Salmonella spp.in Argentina, through the use of barriers, temperature (T), pH, water activity (aw), and by combining them (i.e., by hurdle technology) could be considered a microbiological control point, useful in the processing of safe food.This bacterium is the etiological agent of human salmonellosis and animal infections. Poultry and eggs have been identified as main foods that could produce human salmonellosis after consumption.
The microbiological safety of foods depends on the intrinsic properties of foods, such as aw, pH, and chemical composition as well as the characteristics of the microorganism. A proper combination of these factors may aid in pathogen control. Toughness or resistance to extreme conditions of the pathogen that can contaminate food has to be taken into account as well (McCann et al., 2009; Alali et al., 2012).
In Argentina, the Instituto Nacional de Enfermeda des Infecciosas, A.N.L.I.S. “Dr Carlos Malbran” has reported salmonellosis outbreak data over the years. In the 19 outbreaks that occurred from 2004 to 2007, 16 were caused by Salmonella Enteritidis; 2 by S. Typhimurium; and 1 by S. Heidelberg (Caffer et al., 2007).
According to the Argentinean data, S. Enteritidis, S. Infantis, and S. Agona were among the first10 serotypes most frequently isolated from humans in this country, while S. Typhimurium, S. Newport and S. Agonawere also isolated from patients involved in food outbreaks (INEI 2006; Caffer et al., 2007 and 2010).
Antibiotic-resistant Salmonella in ground meat and poultry is a hazard, and the Center for Science in the Public Interest required USDA-FSIS to move to a more preventive system of controlling the risks at the plant and on the farm. The four Salmonella strains covered by the petition, S. Heidelberg, S. Newport, S. Hadar, and S. Typhimurium, have all been linked to outbreaks (CSPI 2011).An increase in numbers of this pathogen can occur through growth or recontamination. The potential of growth should be minimized, so that food safety can be assured (ICMSF 2011). The parameters that limit the growth of Salmonella spp., such astemperature (T <7ºC and ≥ 48°C), pH (8), and water activity (aw< 0.94), are reported in the international scientific literature (ICMSF 1996). These values have no proven relationship to native strains of Salmonella from Argentina. These factors affect prevalence and spread of microorganisms over time, on microbiological medium and in food; so as the initial cell concentration. Therefore, it would be useful to identify these values to provide the most effective strategies for its control (Oscar 2004 and 2009; Juneja et al., 2007; FAO/WHO 2009; Codex Alimentarius Commission 2011).
Prediction models are useful tools for assessing the growth, survival, inactivation, or metabolic activity of both pathogenic and spoilage bacteria in food, expanding data obtained in the laboratory (Black and Davidson 2009). Through the combination of different values of the factors (e.g., T, aw, and pH), it is possible to determine the fate of the pathogen under varied conditions.
The aim of this study was to explore the following points:
Fate of native strains of Salmonella isolated from chicken and avian environment, cultured under extreme values of the factors T, pH, and aw.
Effect of initial cell concentration on Salmonella development under different values of the factors studied.
Growth response of a native strain of Salmonella Newport due to simultaneous variation of factors using RSM.
Materials and Methods
Salmonella isolation from chicken skin and avian environment
Conventionally reared chickens were slaughtered according to the regulations of Servicio Nacional de Sanidad y Calidad Agroalimentaria (SENASA) from Argentina. Chicken carcasses were removed from the processing line immediately after chilling, transported under refrigeration to the laboratory, and sampled for the presence of Salmonella following the method for the detection of Salmonella spp. (USDA-FSIS 2008). Salmonella was also isolated from chicken feed and processed bone-free chicken following the same USDA-FSIS method.
A 0.5-ml original chicken rinse made with Buffered Peptone Water (BPW, BIOKAR, Buenos Aires, Argentina) was added to 10 ml Tetrathionate Broth Base (TTB, OXOID, Buenos Aires, Argentina). Another 0.1-ml rinse was added to 10 ml Rappaport Vassiliadis Soya Peptone Broth (RVS, BIOKAR, Buenos Aires, Argentina). Both rinses were incubated at 42ºC for 24 h. These selective enrichment cultures were streaked onto Xylose Lysine TergitolTM 4 Agar (XLT4, BIOKAR, Buenos Aires, Argentina) and Brilliant Green Sulfa Agar (BGS, BIOKAR, Buenos Aires, Argentina) plates, and incubated at 35ºC for 24 h. Seven suspect colonies appearing on each selective agar plate were inoculated onto Triple Sugar Iron, Lysine Iron Agar (TSI and LIA, DIFCOTM, Buenos Aires, Argentina) and Urea Agar (BBLTM UA, Buenos Aires, Argentina) slants and incubated at 35ºC for 24 h. All of the typical Salmonella-like colonies were tested for further biochemical characterization, and identities were confirmed by using poly-O antisera. Confirmed Salmonellas trains were submitted to the Instituto Nacional de Enfermedades Infecciosas, A.N.L.I.S. “DrCarlosMalbran” for further identification where Dr. M.I. Caffer and Dr M. Pichel characterized those strains at the serotype level.
Serotypes of Salmonella used in this investigation
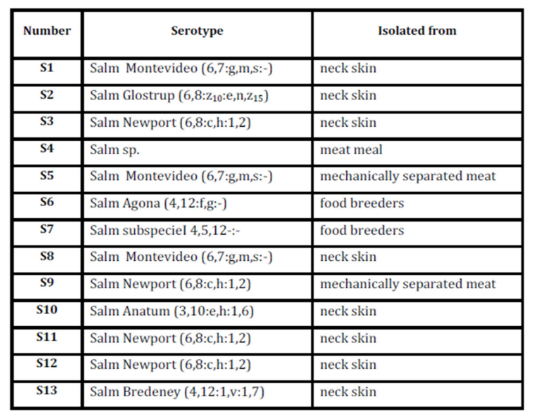
Salmonella serotypes already characterized as it was described previously are presented in Table 1.
Table 1: Determination of Salmonella serotypes
From those serotypes, all of the following serotypes were used: S. Montevideo (S1), S. Anatum (S10), S. Newport (S12), isolated from neck skin, and S. Agona (S6), obtained from food of breeders. In addition, a strain of Salmonella enterica subs enterica serotype Hadar from the collection of the Food Microbiology Laboratory, Food Technology Institute, FIQ, UNL was used.
Strains were stored at -80°C, activated in Tryptone Soya Broth (TSB, BIOKAR, Argentina), and incubated for 24 h at 35°C before each test. Then, Tryptone Soya Agar (TSA, BIOKAR, Argentina) plates were washed with the broth to obtain isolated colonies for testing.
Growing conditions (T, pH, and aw) for native Salmonella strains
To study the fate of the selected serotypes under extreme conditions, one factor was modified while the remaining parameters were set at the conditions generally recognised as optimal for the development of the pathogen.
The incubation temperature (T) was fixed at 5.5 and 6.5ºC.To study this effect, each refrigerator was set at the temperatures to be studied, and the inoculated tubes were incubated for 7 days. The control of the temperatures tested was performed using a calibrated data-logger (DuaLogR® Thermocouple Thermometer Model 600-1050, Barnant Co., USA).
The pH and water activity (aw) of the medium (Nutrient Broth, NB, BIOKAR, Argentina), was varied as it follows: an appropriate volume of 1mol l-1HCl was added to the medium to reach pH 3.7, 3.8, 3.9 and 4, and measured with digital a pHmeter (Ludwig pH -016, CHINA). For aw modification, NaCl was used to reach 0.94, 0.95, 0.96, 0.97 and 0.98, respectively, and measured by AquaLab equipment (USA).
The medium was poured into tubes after each variation of factors. The growth of the strain was evidenced by development of turbidity measured by optical density (OD) at 625 nm through METROLAB, Argentina Spectrophotometer (330 to 1000 nm), and compared with McFarland Scale.
Size of the inocula
To observe the effect of the initial cell concentration on the growth of each serotype, three successive tenfold dilutions in NB (BIOKAR, Argentina) were done, from log 6 to log 3 cfuml-1.
With pH modification of the medium, at 3.7, 3.8 and 3.9, assays were done at each initial cell concentration to be studied. Control assays (pH 7, aw 0.99, and at every different initial inoculum size) were also done. Tubes were incubated at 35°C and checked at 24 hours. Cultures were tested for 7 days and checked daily by turbidity at 625 nm OD.
Similar assays with varied initial cell concentrations were incubated at two temperatures, 5.5°C and 6.5°C (pH 7 and aw 0.99). Tubes were incubated at each T assayed and checked every 24 hours. Cultures were tested for 7 days and checked daily by turbidity at 625 nm O.D.
Fate of a Salmonella Newport strain by simultaneous combination of factors: Experimental design
S. Newport (S12) was used to study the combined effect of parameters due to the results obtained during study of single parameters. This native strain was selected because of its great resistance to factors in extreme conditions as well as the lack of effect of initial cell concentration on growth, even when the medium pH was changed. Salmonella Newport counts were performed in duplicate. The strain was activated in Tryptone Soya Broth (TSB, BIOKAR, Argentina) and incubated for 24 h at 35°C. Tenfold dilutions with 0.1% Peptone Water (BPW, Biokar, Argentina) were done. Aliquots (0.1 ml) were transferred onto the surface of Xylose Lysine Deoxycholate Agar (XLD, Biokar, Argentina) and incubated at 35°C for 24 hours for counting. The numbers of viable cells were expressed as log cfu ml-1.
Response Surface Methodology (RSM) was used to study the effect of temperature, pH, and aw, varied simultaneously, using the Box-Behnken design (3 factors in 3 levels) (Table 2). RSM was developed for the behaviour assessment (maximum speed of growth or inactivation ïmax, and lag phase time ï¬) of the selected serotype of Salmonella, when the temperature, pH, and aw were changed simultaneously (T varied from 7 to 20ºC, pH varied from 3.9 to 4.5, and aw varied from 0.97 to 0.99). Regarding which temperatures to study, 7°C is a typical temperature in home refrigerators; 13.5°C would be a slight abuse temperature; and 20°C would be a more significant abuse temperature that could be reached by uncontrolled food storage (Oscar 2009). In the case of pH and aw, typical values of these parameters for different types of foods (fresh, cooked, packed, and more) were chosen.
Table 2: Box-Behnken experimental design, coded and uncoded variables and levels
The theoretical foundations and applications of this design have been discussed in many papers (Box and Behnken 1960; Giovani 1983; Floros and Chinnan 1988).
For each run (i.e., test), the fate of Salmonella versus time was evaluated with the model of Baranyi and Roberts (1994) using DMfit software. This model describes a sigmoid bacterial curve and has four main parameters (initial value, lag/shoulder, maximum rate, final value) and two curvature parameters: mCurv and nCurv. The latter parameters describe the curvature of the sigmoid curve at the beginning and at the end of the growth phase, respectively. The mCurv and nCurv values depend on the model selected by the user. When selecting model no lag, the curvature parameter mCurv is set to zero. In this case, the model describes only the growth/death and the stationary phase. When selecting model no asymptote, the parameter nCurv is set to zero. Consequently, the model describes only the lag/shoulder phase and the growth/death phase. When complete model is selected, mCurv and nCurv default values are set at 10 and 1, respectively.
The experimental curves were fitted using models as complete, no asymptotic, and no lag, depending on the characteristics of each run. The units of the estimates correspond to the units of the data. As the bacterial counts were expressed as log cfuml-1, and time in hours, maximum growth or death is expressed in log cfuml-1h-1, the lag or shoulder time in hours, and the estimates for the initial and final value in log cfuml-1.
The responses maximum growth or death (μ max) and lag or shoulder time (λ) of each run were fitted as a function of temperature, aw, and pH by RSM. The STATGRAPHICS Centurion XV 15.2.06 (Statpoint Technologies, Inc., Warrenton, Virginia, USA) was used to perform ANOVA analysis, to fit the second order polynomial equations to the experimental data and to obtain the coefficients of the equations. The significance of each term of the model was evaluated referred to the pure error. The pure error was calculated from runs done in triplicate at the central point of the design. The elimination of non-significant terms of the model was done by means of the linear stepwise regression procedure. Previously, tests to verify that the residuals satisfied the assumptions of normality, independence and randomness were also done. For verification of the model adequacy, the lack of fit and the coefficient of determination (R2 ) was calculated.
Results
Growth responses of native Salmonella strains under extreme conditions at different aw, pH and T (Table 3) are as follows:
Table 3: Growth responses of native Salmonella strains under extreme conditions at different aw, pH and T.
* pH 7 and T 35ºC; ** aw 0.99 andT 35ºC; *** aw 0.99 and pH 7
Assays on aw(0.94, 0.95, 0.96, 0.97 and 0.98) have shown that up to 7 days of incubation, no growth was observed on any serotype studied at aw 0.94, while 80% grew at 0.95; and S. Hadar grew only at aw ≥0.96 (pH 7 and T 35ºC).
When standard conditions (pH 7, aw 0.99, and T 35ºC) were established, all serotypes developed well. On assays of decreased pH (3.7, 3.8, 3.9 and 4), different behaviour between serotypes was observed; S. Hadar, S10, and S12 were able to develop from pH 3.7.From pH 3.8 all serotypes grew. At 5.5°C, only S10 showed growth, whereas at 6.5°C, all but S1 of the tested serotypes grew.
In the case of growth responses of native Salmonella strains accounting for the initial inoculum size under extreme conditions of pH and T, it was observed that at 6.5°C and at the higher inoculum concentrations log 6 cfu ml-1, 80% of serotypes was positive for growth, with the exception ofS1; while at log 5 cfuml-1, only S12 was able to develop. At 5.5°C, there was no development in most serotypes, except S10, which developed at the highest cell concentration. At log 4 cfuml-1 and below, no development was shown in any sample, possibly because cells were more exposed to extreme conditions and therefore, had increased susceptibility.
For cultures with log 6 cfuml-1initial cell concentrations and pH ≥ 3.7, S. Hadar, S10, and S12 were able to develop. However, it is interesting to note that S10 and S12 not only developed at the highest inoculum, they also grew up to log4 cfuml-1.S. Hadar developed at all pH studied, but only at ≥ log 6 cfu ml-1. The strainS6, followed by S1, was very influenced by pHon cultures with low initial cell concentration. Both strains were able to grow at pH 3.8 with log 6 cfuml-1 initial inoculum size; however, S1 also grew at this pH with log 5 cfuml-1, whereas S6 did not. Neither S1 nor S6 developed at pH < 3.8.
Comparing the growing curves with combined factors
Interesting results were observed when different barriers (factors) were applied simultaneously in order to evaluate the fate of S. Newport. As previously stated, the experimental design of factor combinations is shown in Table 2.
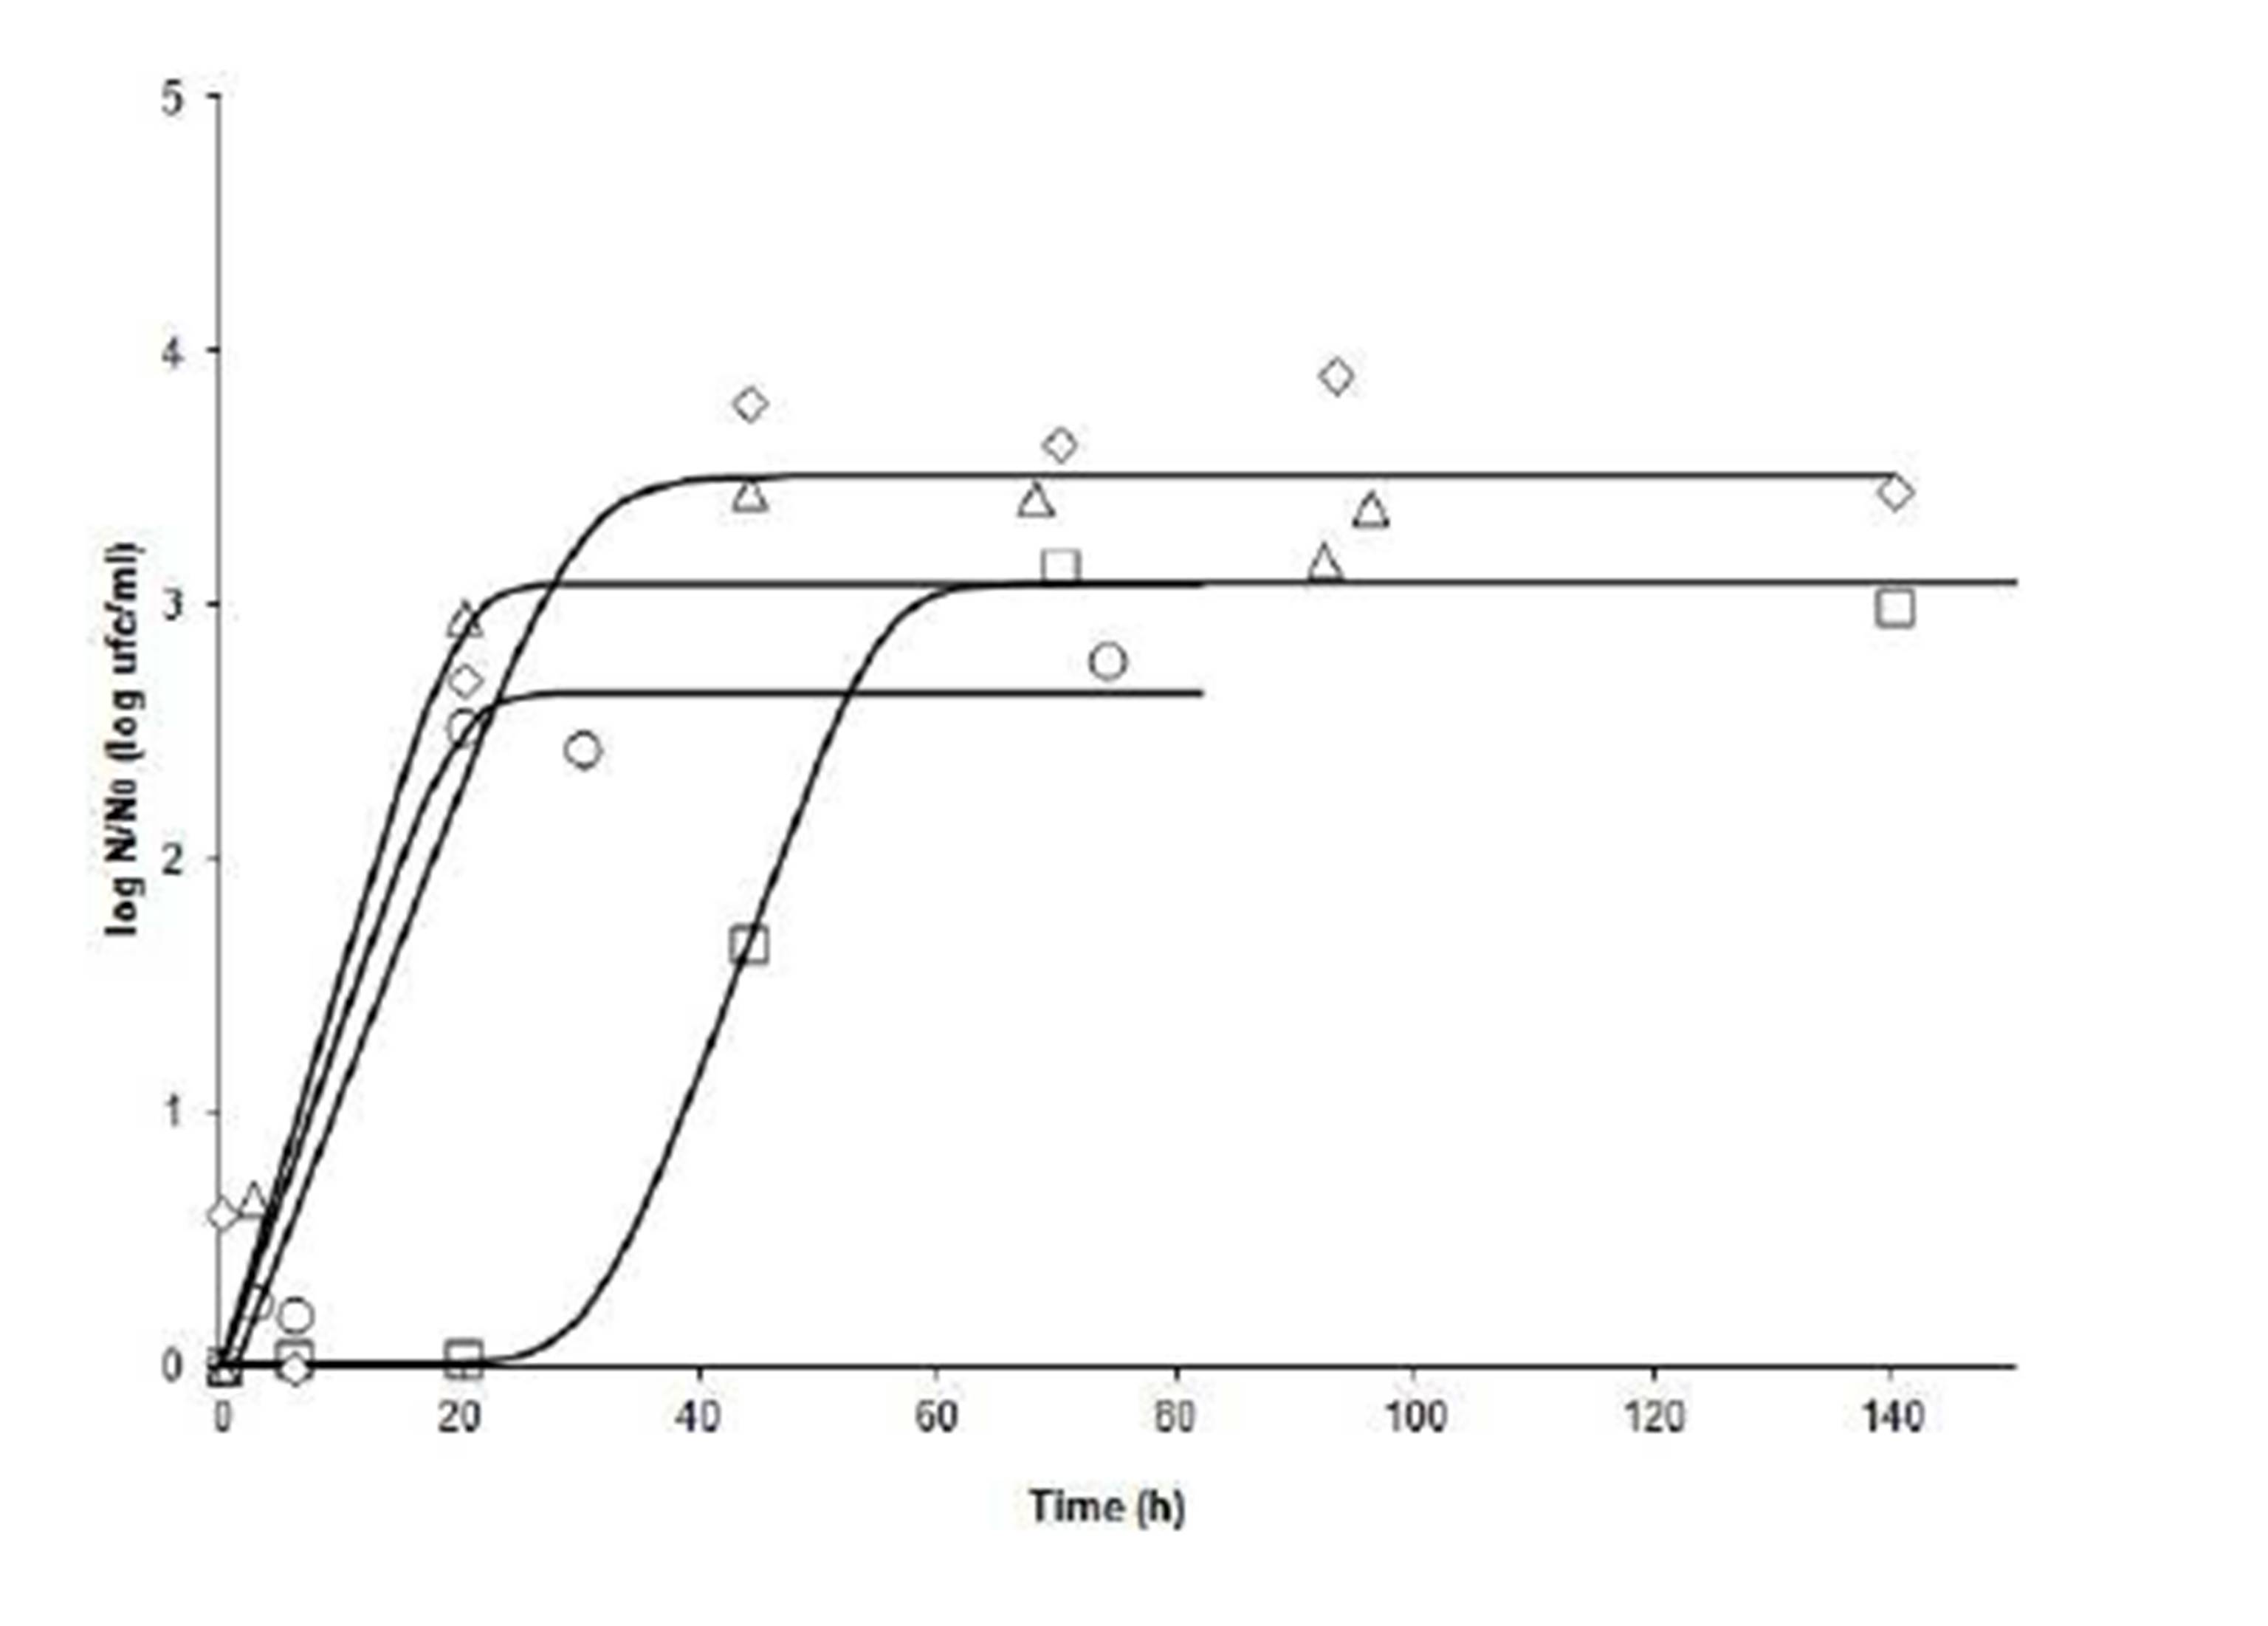
In the comparison of runs (tests), at 20° C,it can be seen in Fig. 1 that Run 5(pH 3.9 -aw 0.98) showed a lag phase longer than 20 hours, while in Runs 10 (pH 4.2 – aw 0.97), 12 (pH 4.5 – aw 0.98), and 14 (pH 4.2 – aw 0.99), growth was immediate. This may indicate that the factor with the greatest impact on growth is the pH at this T. However, the slopes of the curves indicate that ïmax are quite similar (range: 0.1213 — 0.1540 log cfu ml-1h-1). The final value of microorganisms in Run 14 (pH 4.2 – aw 0.99) had a lower final count than Run 10 (4.2 – 0.97), however this difference does not reach 1 log cfuml-1;Runs 5 (3.9 – 0.98) and 12 (4.5 – 0.98) had almost the same final count.
Figure 1: Fate of Salmonella Newport at 20°C under different combinations of pH and aw. N: bacterial count at time t; No: bacterial count at initial time. (ï‚) Run 5 (3.9, 0.98); (ïƒ ) Run 10 (4.2, 0.97); (ï„) Run 12 (4.5, 0.98), and (ï‚™) Run 14 (4.2, 0.99)
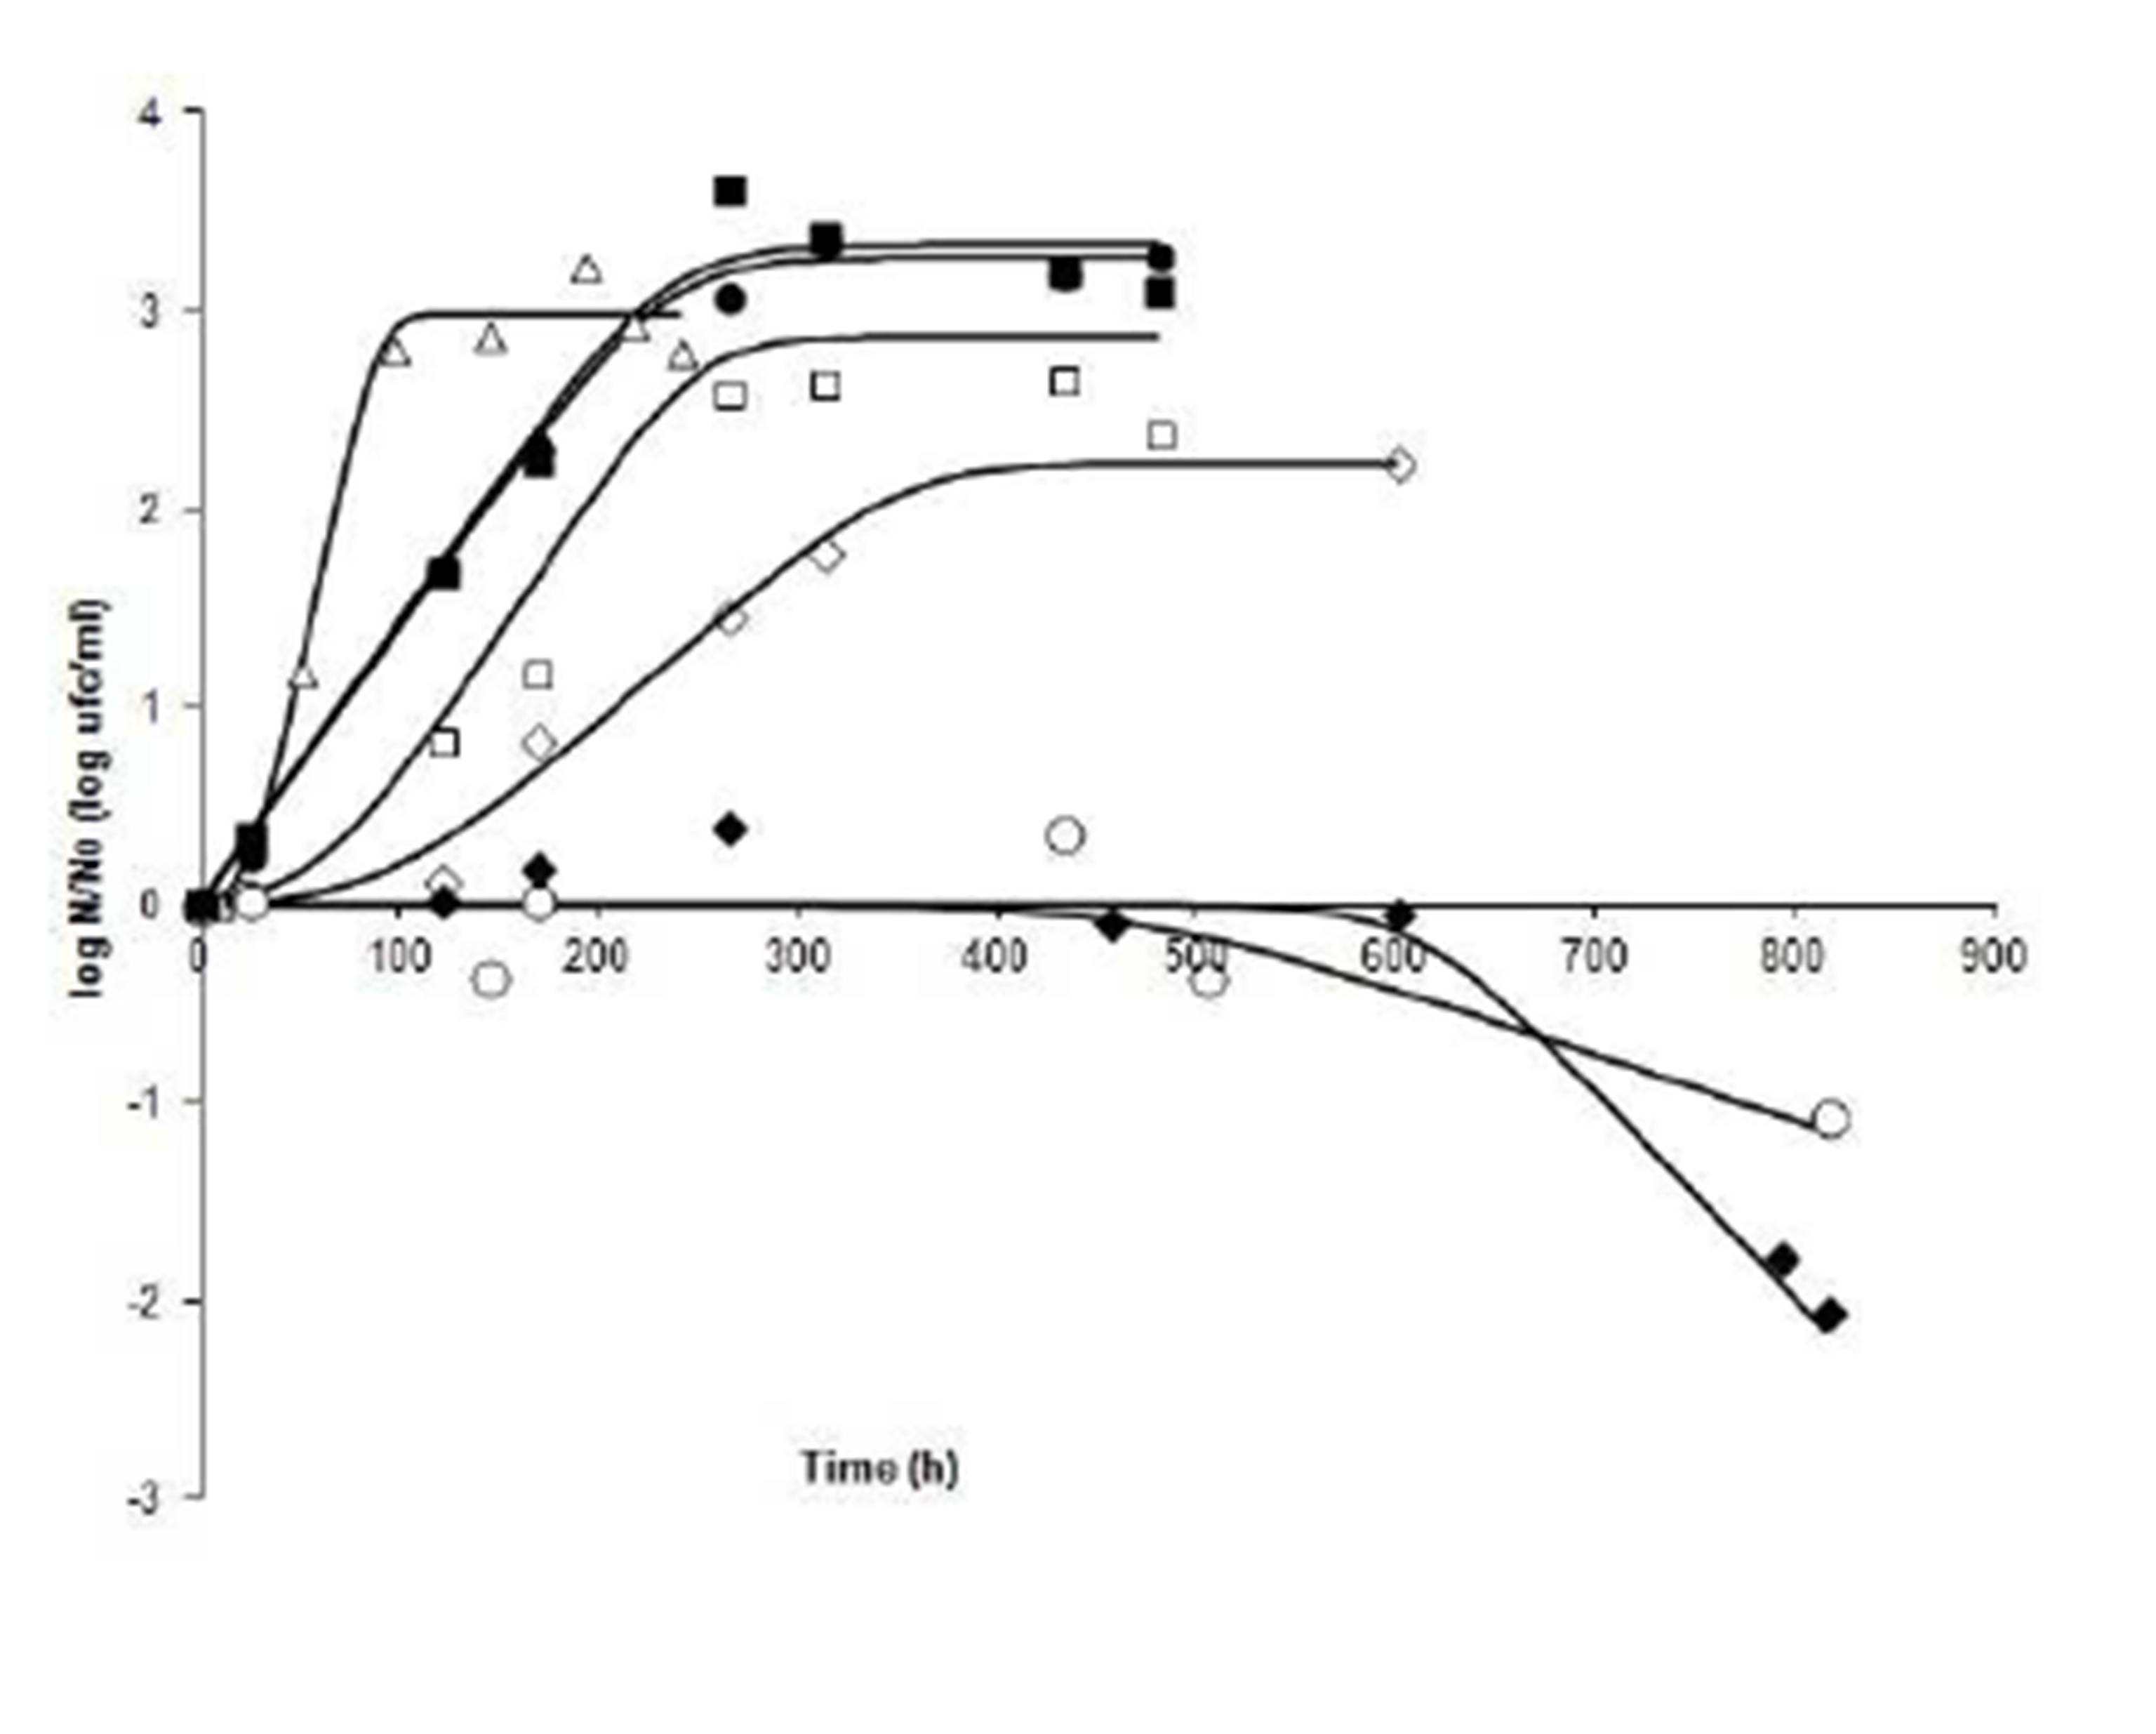
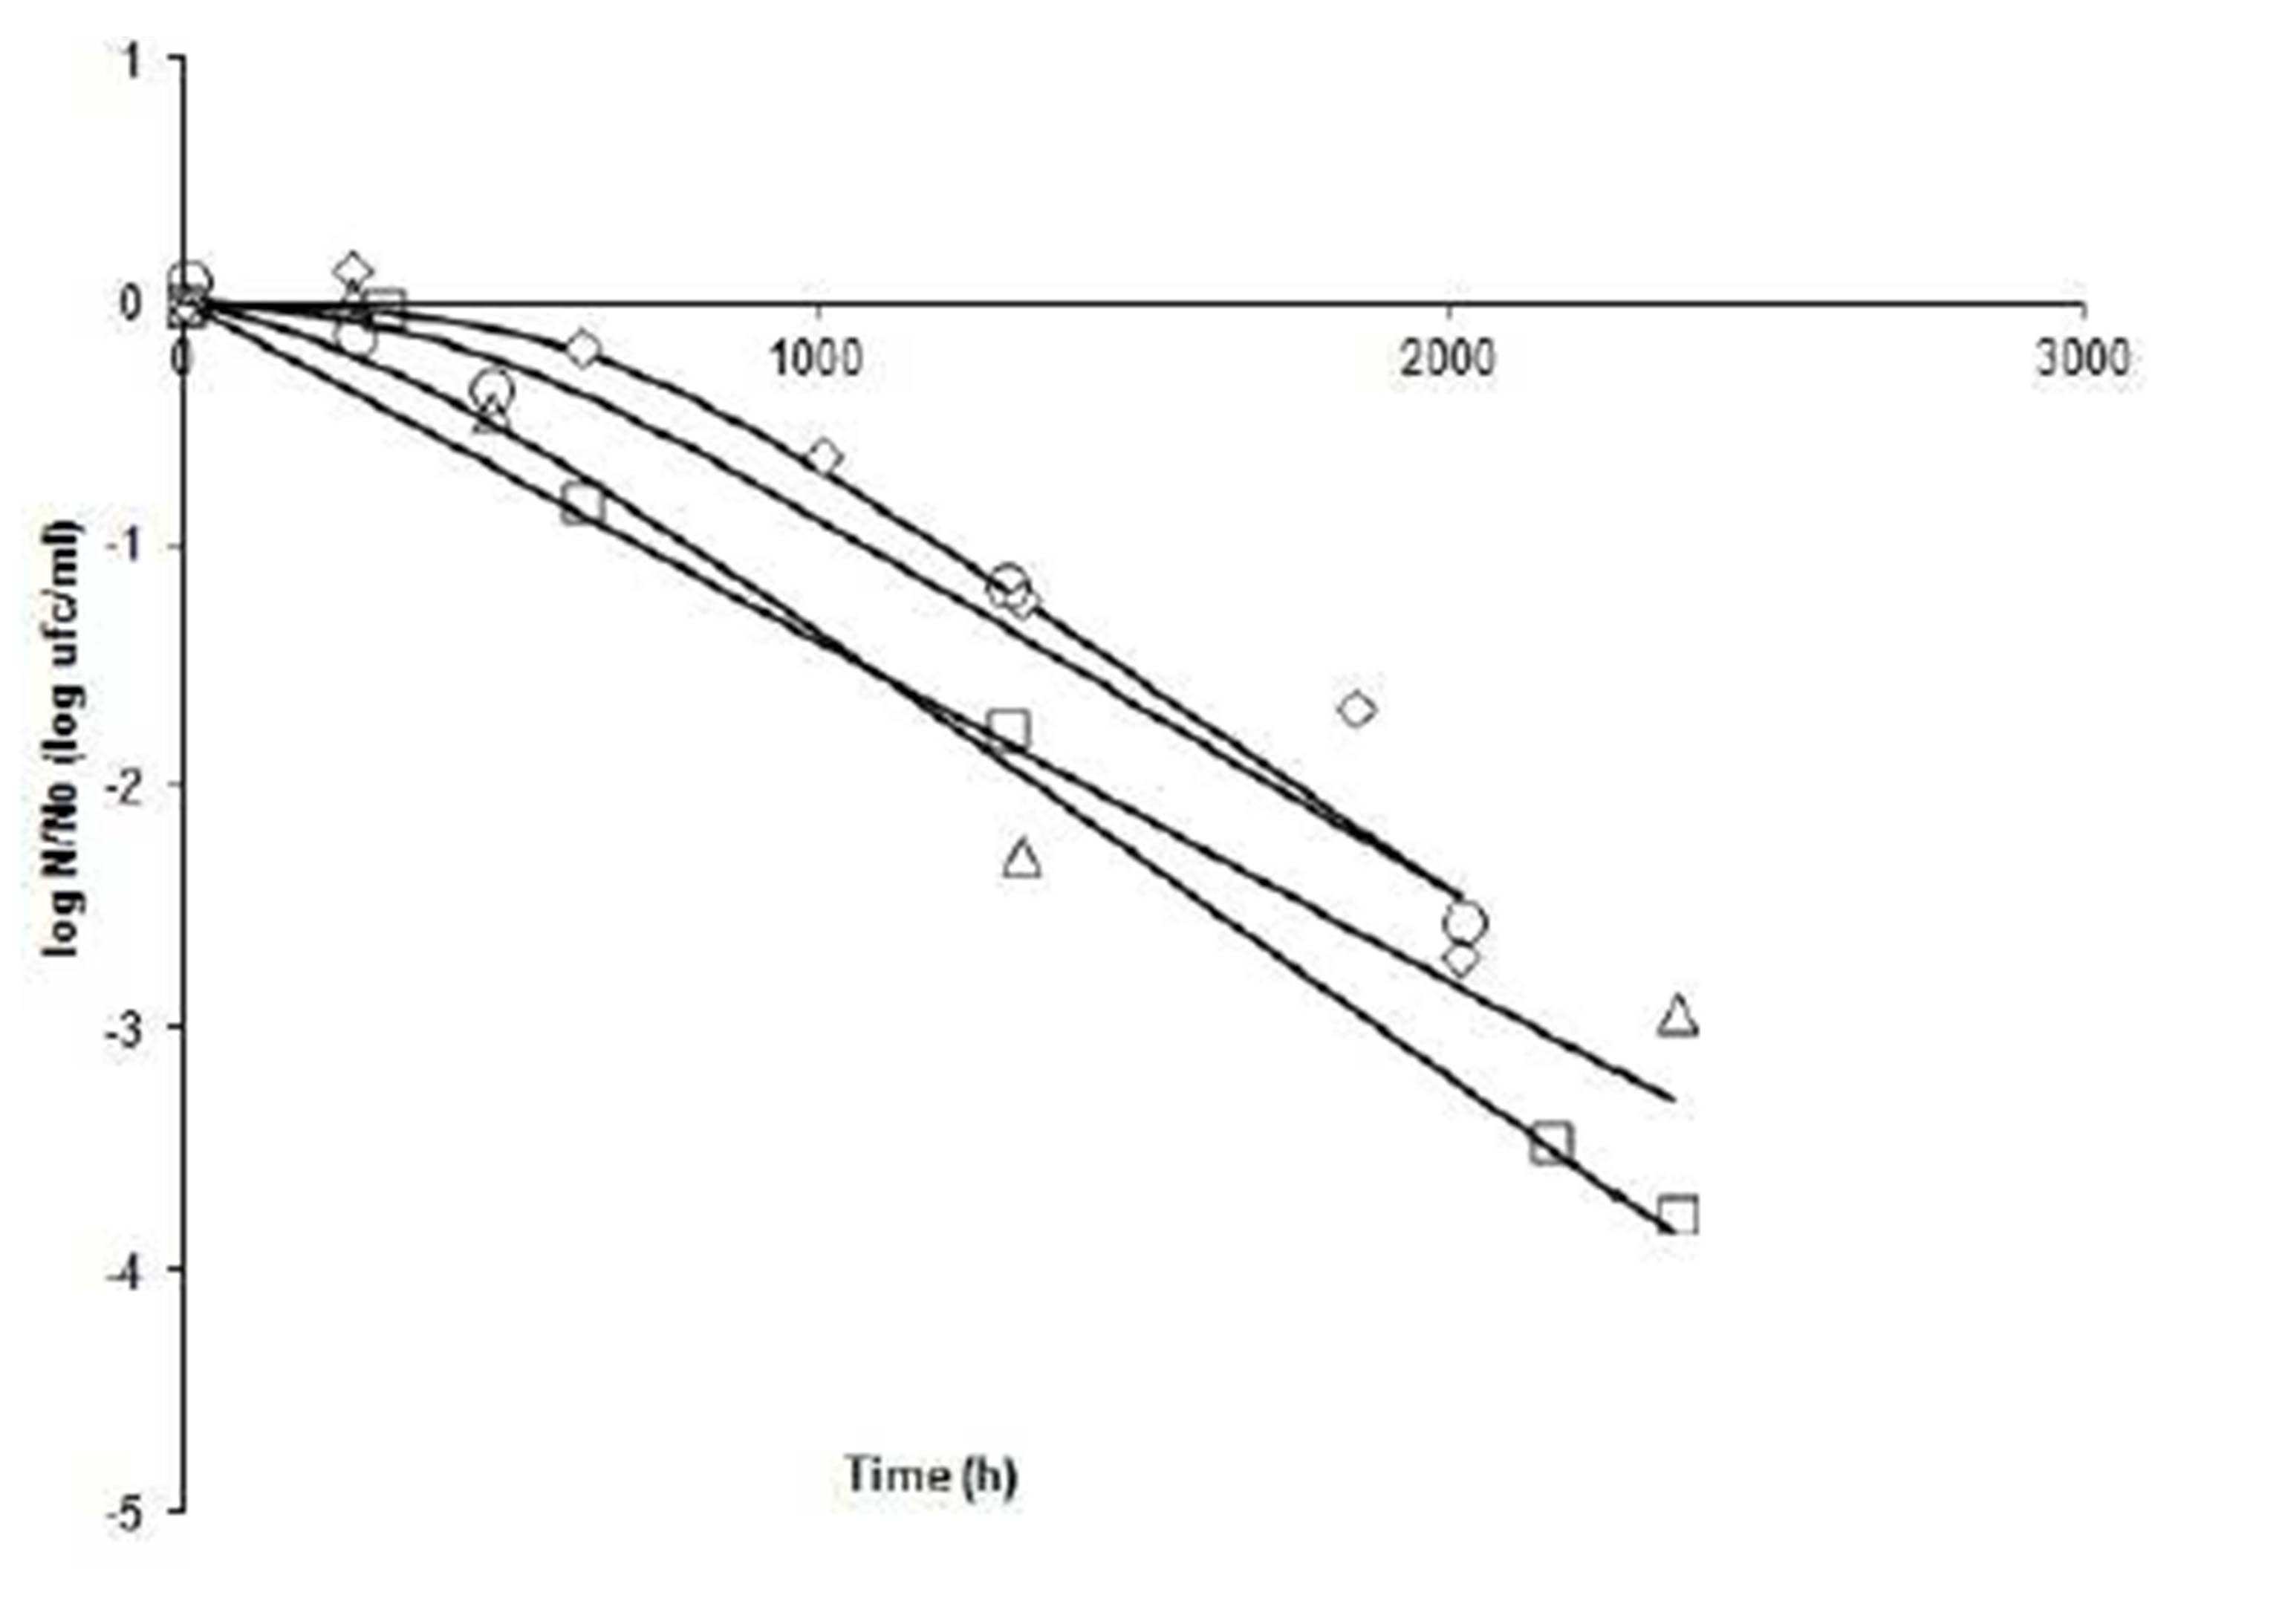
Varied responses were shown on runs at 13.5°C, as it can be seen in Fig. 2. Run 7 (3.9 – 0.99) and Run 13 (3.9 – 0.97), both of which had the lowest pH (3.9), are shown as decline runs, after an extended shoulder and followed by a rapid decrease in cell numbers. Moreover, the slope of Run 7 is less steep than that of Run 13. One might conclude, therefore, that pH is the critical factor. Runs 1, 8 and 15 (pH 4.2 —aw0.98), show responses that are at the central point of the experimental design. It is noted that while Run 1 developed a brief lag phase, Runs 8 and 15 started growth immediately, without lag phase. The growth rate and the final value are virtually the same in the three curves, indicating uniformity in the response of the organism in these experiments. Runs2 (pH 4.5 —aw0.97) and 6 (pH 4.5 – aw0.99), were programmed at pH 4.5. A lag phase of about 24 h was shown in Run 6, while this phase was extended for 100 h on Run 2. These curves also differ in their slope. A steep slope is presented by Run 6, which corresponds to a higher growth rate, compared with Run 2. One may be led to consider aw as a cause for cell behaviour in these two situations
According to the data, it can be said that at 13.5ºC (Fig. 2), the pH has the greatest effect. Inactivation occurs on cultivation when pH is 3.9, and in this case, it appears that aw does not influence the response of the organism. However, at pH 4.5, aw defines the lag time, as well as μmax and the final cell count, which shows the combined effect of the factors.
Figure 2: Fate of Salmonella Newport at 13.5°C under different combinations of pH and aw. N: bacterial count at time t; No: bacterial count at initial time. (ï‚) Run 1 (4.2, 0.98); (ïƒ ) Run 2 (4.5, 0.97); (ï„) Run 6 (4.5, 0.99); (ï‚™) Run 7 (3.9, 0.99); (ï‚¡) Run 8 (4.2, 0.98); (-) Run 13 (3.9, 0.97), and (â—) Run 15 (4.2, 0.98).
Fig. 3 shows the comparison of the curves at 7°C. Decreasing curves are presented in all runs, and quite possibly indicate the death of cultures under test conditions. The slopes of the curves indicate that ïmax are quite similar (range: -0.0014 to -0.0018 log cfu ml-1h-1). Comparing Run4 (pH 4.2 to 0.99 aw) with 9 (pH 4, 2 – aw 0.97), it is shown that there is a big difference in the shoulder time (ï¬: 636.5 vs. 6.3 h). In the last case, cells started dying rapidly, possibly due to the effect of lower aw at equal pH. Run 11 (pH 3.9 – aw0.98) and Run 3 (pH 4.5 – aw0.98) have very similar shoulder time.
Figure 3: Fate of Salmonella Newport at 7°C under different combinations of pH and aw. N: bacterial count at time t; No: bacterial count at initial time. (ï‚) Run 3 (4.5, 0.98); (ïƒ ) Run 4 (4.2, 0.99); (ï„) Run 9 (4.2, 0.97), and (ï‚™) Run 11 (3.9, 0.98).
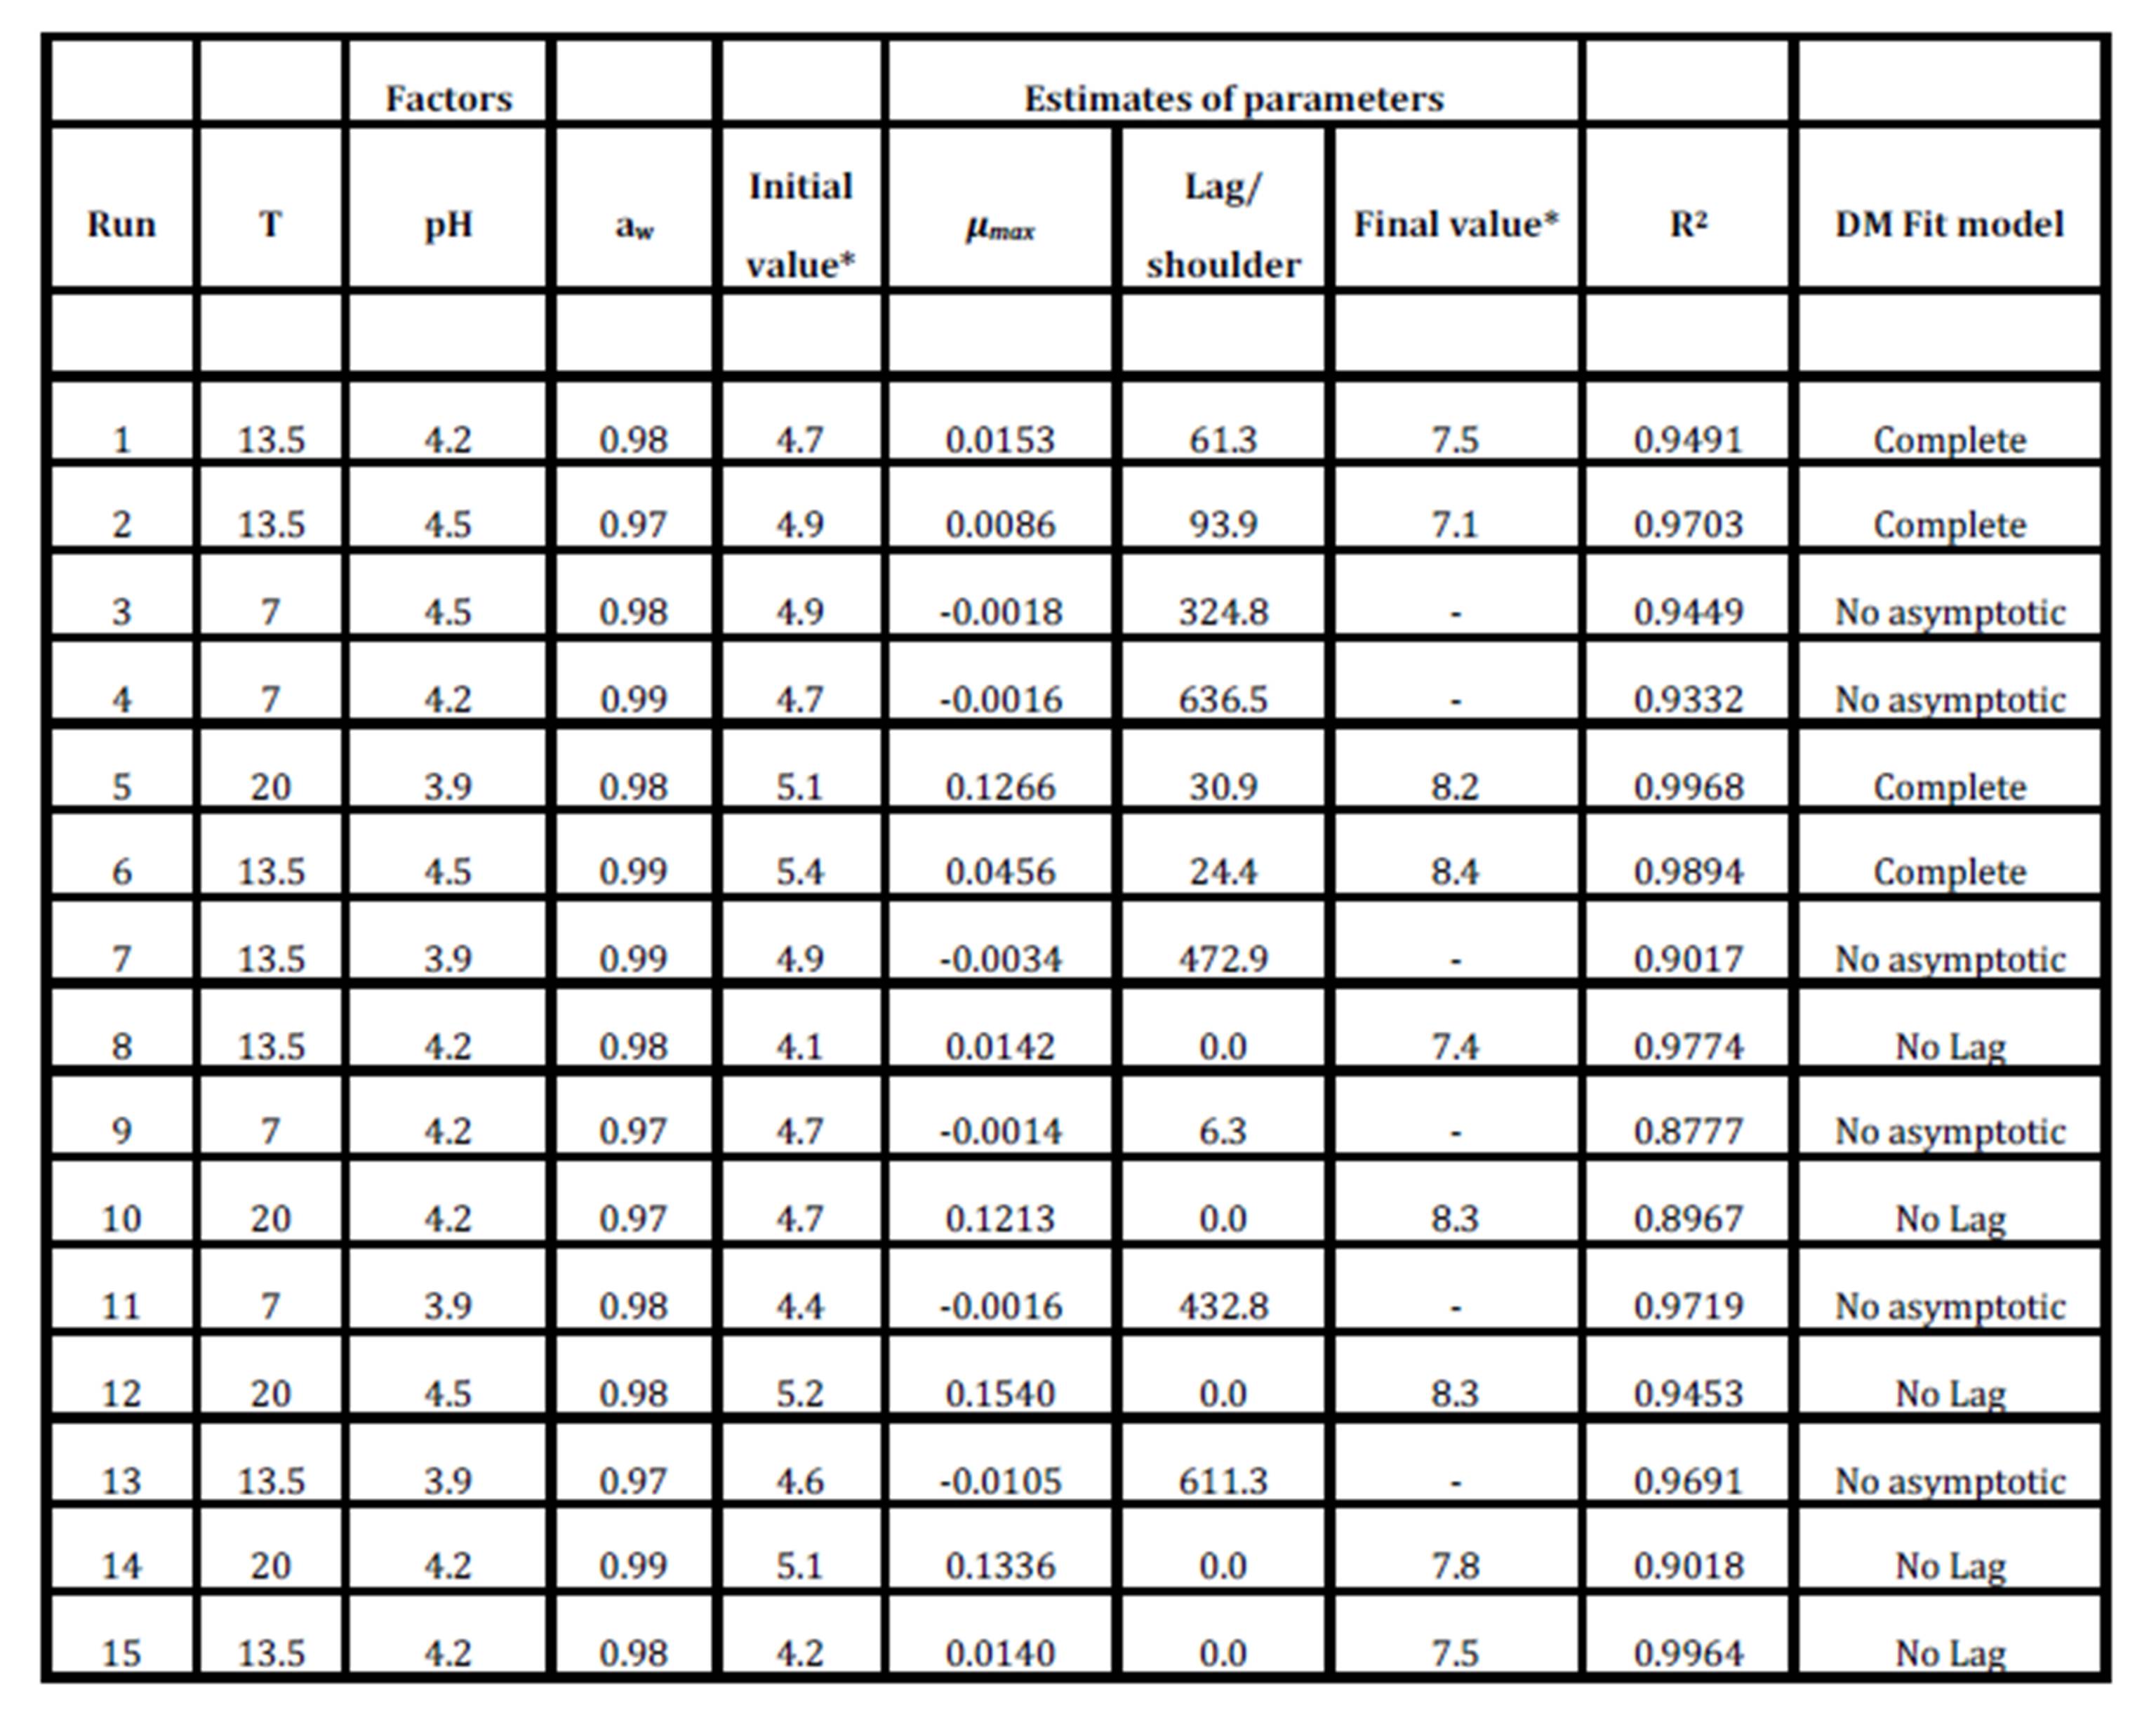
Table 4 summarizes the estimated parameters of the Baranyi and Roberts Model obtained from the experimental data when they were fitted with the DMFit program. It quantifies the lag time, maximum growth/death rate, initial and final values (numbers of viable cells were expressed as log cfu ml-1) and the coefficients of determination for primary models. The statistical significance of each term of the 2nd order polynomial equation by comparing the mean square against an estimate of experimental error was determined by the ANOVA of the RSM models.
Table 4: Experimental combining conditions of factors, parameter estimates, and models used with DMfit software for each run of the Box Behnken experimental design
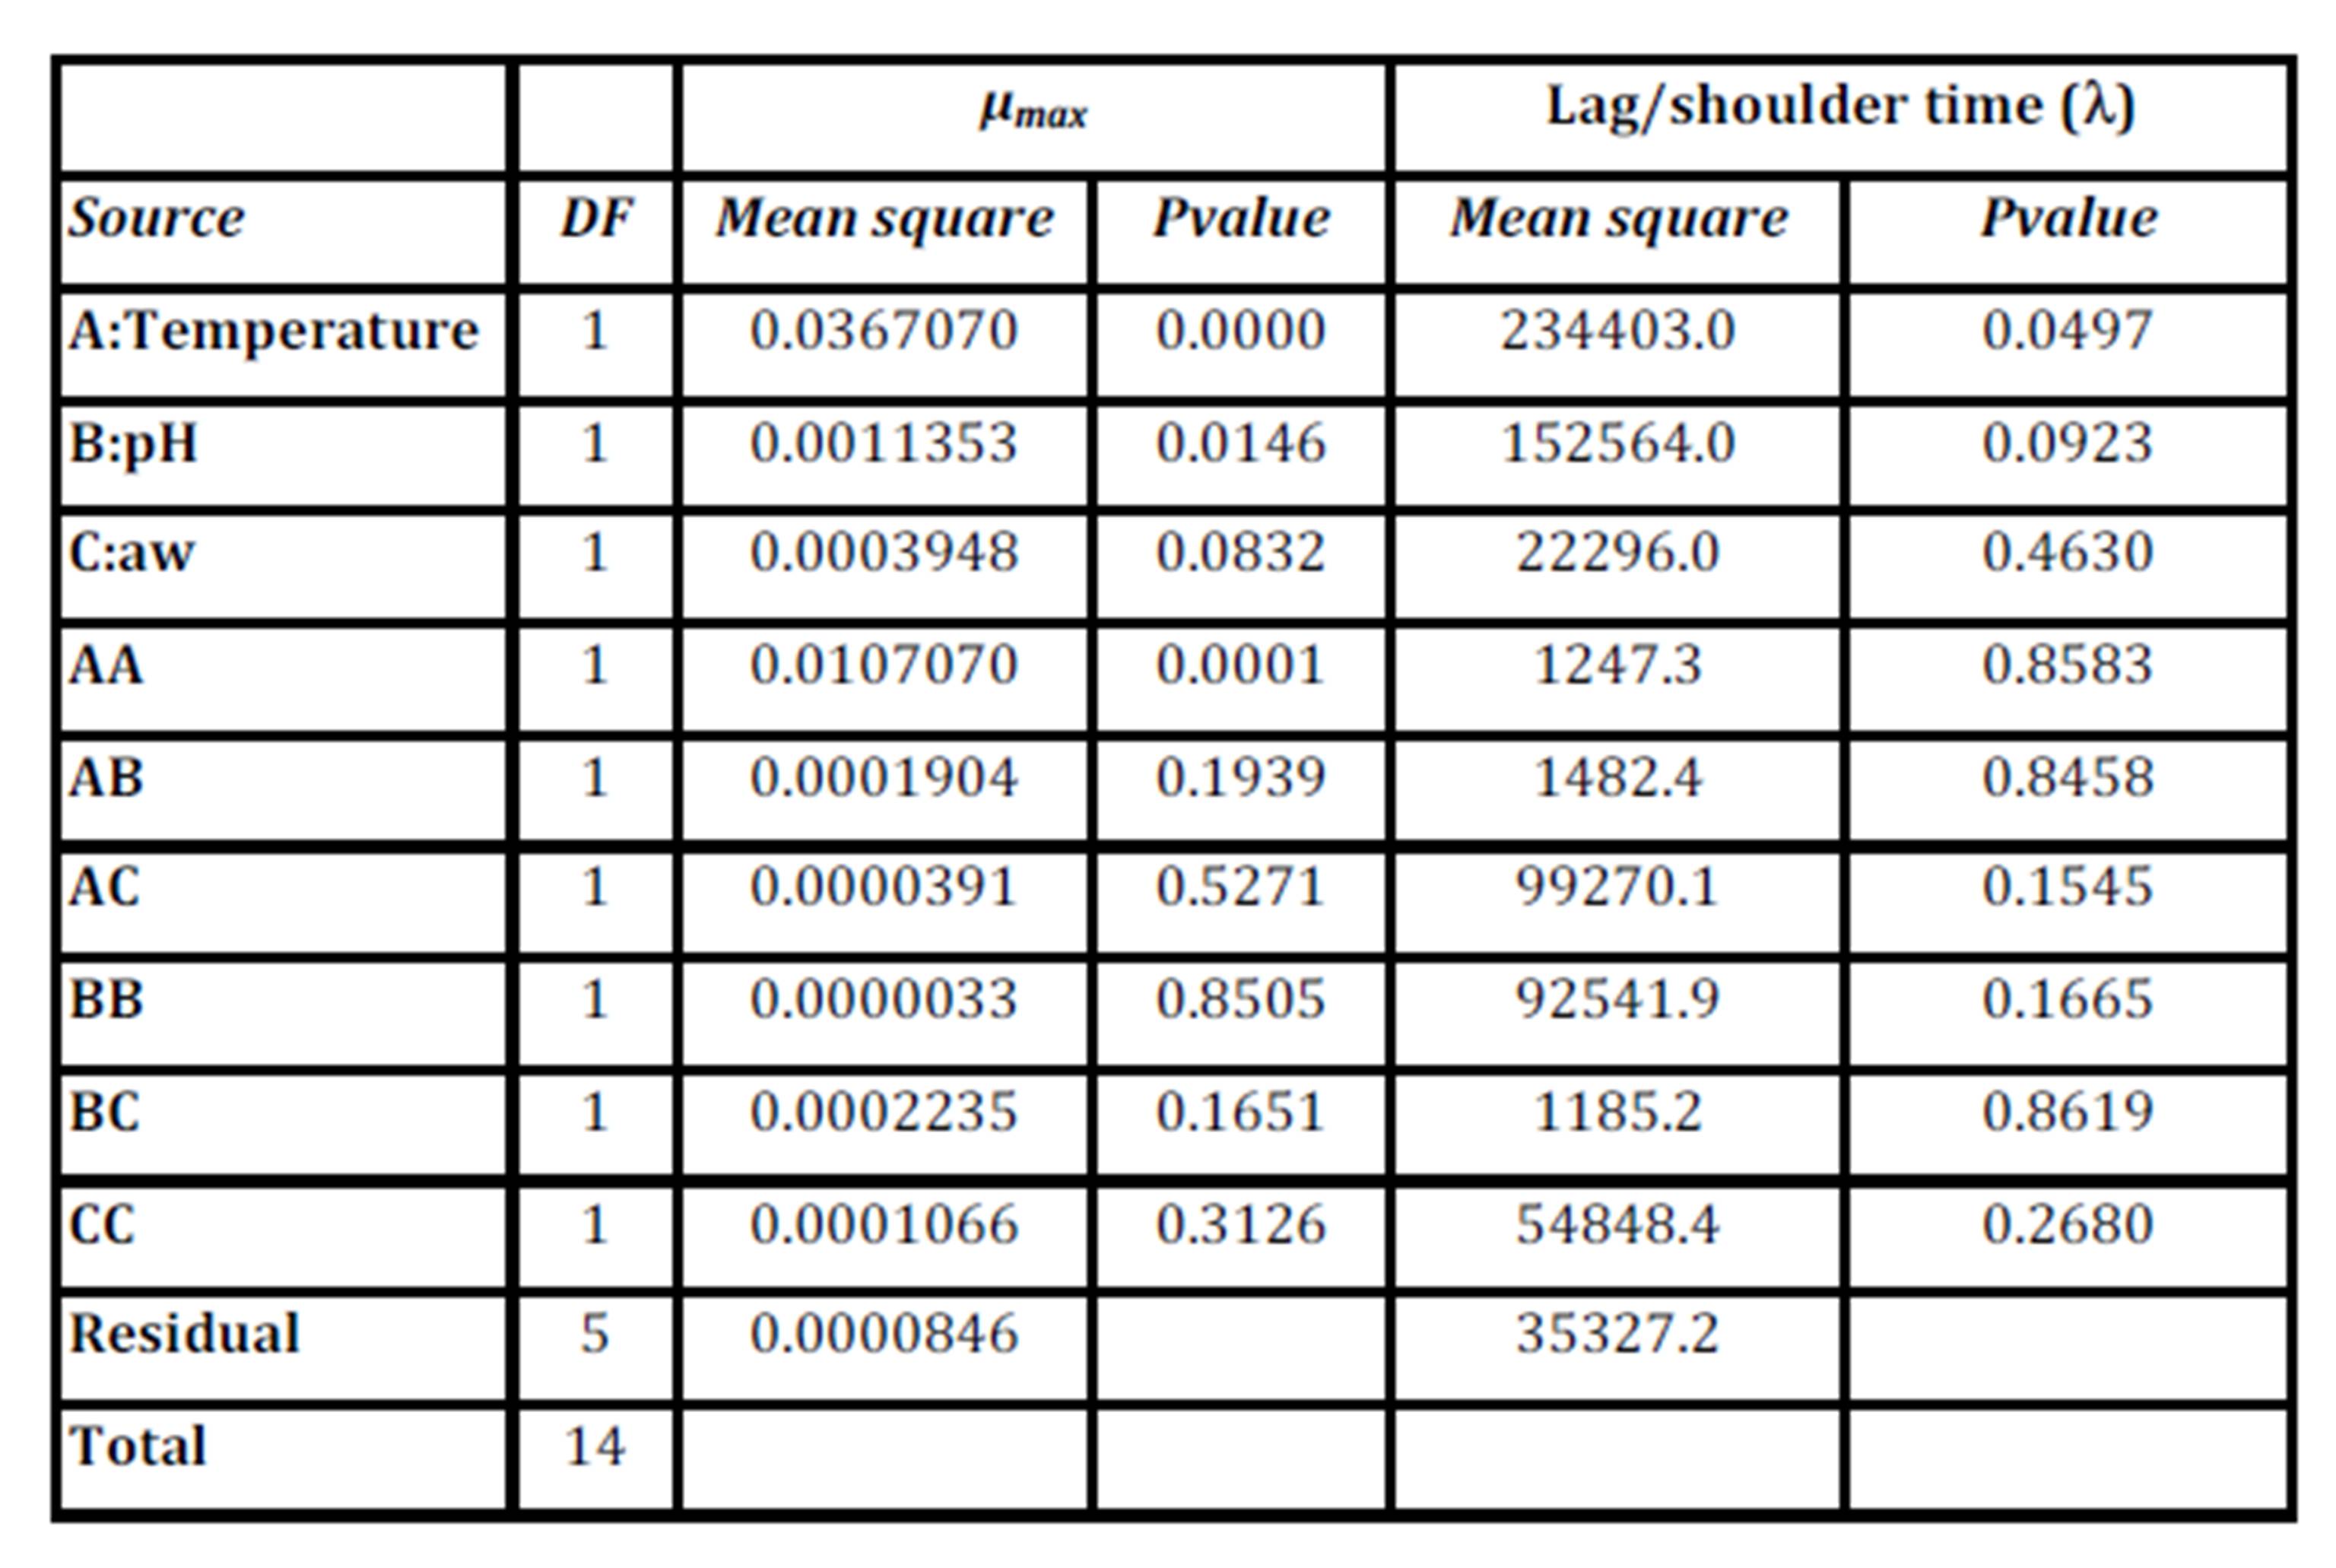
Table 5: Analysis of Variance of the μmaxand Lag/shoulder time (ï¬) responses
Table 5 shows that for theμmaxmodel, the linear and quadratic terms of temperature and linear of pH have a P value less than 0.05, indicating that the variables of temperature and pH are significant at a confidence level of 95.0%. The aw linear term is significant at P=0.0832 (at P<0.10). The R-Squared statistic indicates that the model explains 99.2% of the μmax variability. It was observed that the most important factors were temperature and, to a lesser extent, pH and aw.
The complete fitted model for ïmax in non-coded variables is presented in Equation 1

where μ max is expressed as log cfu ml-1 h-1.
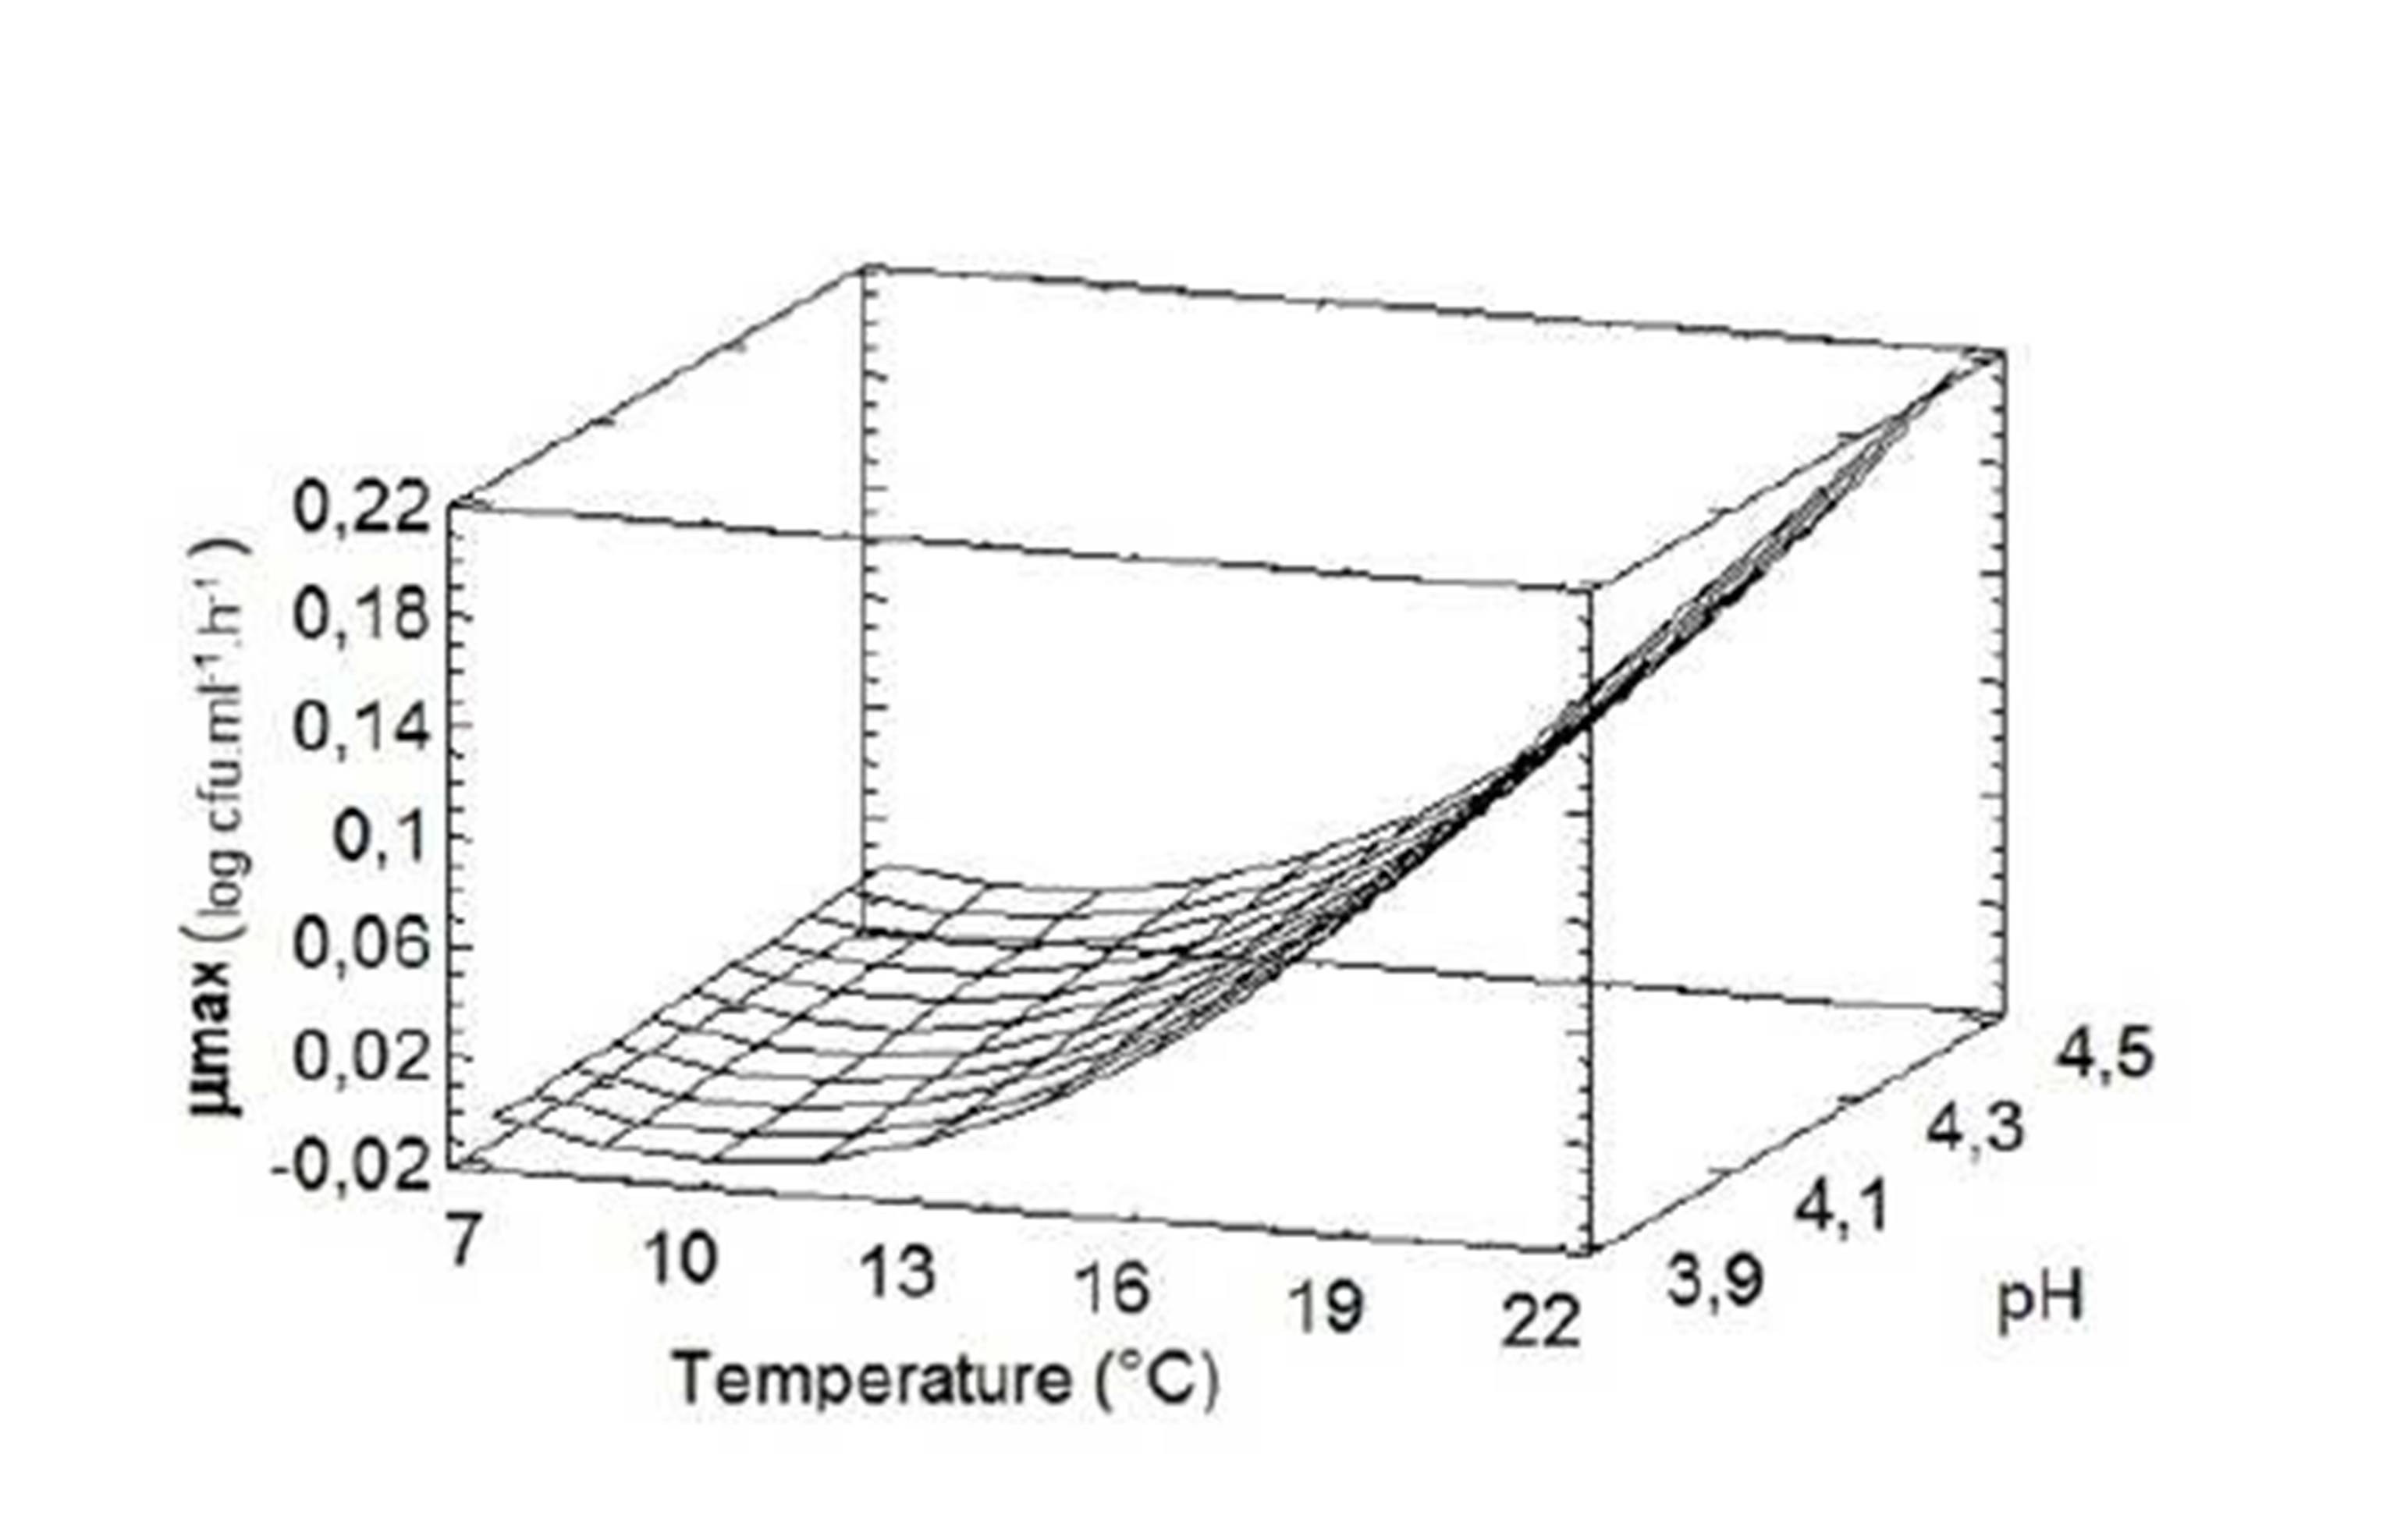
Fig. 4 shows the functionality between the temperature and pH on the maximum growth/death rate, at aw 0.98. At high temperatures, there was a slight increase in rate with increasing pH. However, this effect was less important at lower temperatures.
Figure 4: Response surface of maximum growth/death rate model of Salmonella Newport as a function of temperature and pH at aw 0.98.
Table 5 shows that for the model of lag/shoulder time (ï¬), only the linear terms for temperature and pH have P values of 0.05 and 0.09 (less than 0.10), indicating that the variables of temperature and pH are significant at a confidence level of 90.0%. Therefore, the most important factors were the temperature and, to a lesser extent, pH. The R-Squared statistic indicates that the model explains 78.6 % of the ï¬variability.
The complete fitted model for ï¬ in non-coded variables is presented in Equation 2

where λ is expressed as h.
Discussion
In the present study, growth limits for native Salmonella strains were shown to be: pH 3.7, aw 0.95, and T 5.5ºC.These limits showed slight differences from those reported in the literature. In ICMSF (1996) it was reported that 5.2ºC is the minimum standard temperature for Salmonella spp.growth; however, it has also been shown in the text that most Salmonella strains are considered not capable for growing below 7ºC. Additionally, Pradhan et al., (2012) reported the growth of S. Typhimurium at 8ºC, but not at 4ºC. ICMSF (1996) also reported pH 3.8 as the minimum pH value for Salmonella growth. Results obtained here show that some native Salmonella strains can grow at pH 3.7, which could mean a higher resistance to acidic conditions, and a higher probability of human exposure to the pathogen. Alegre Vilas (2012), also reported that S. Newport strain was able to grow in fruits at this low pH (3.7).
With regards to aw, a slight difference has also been observed between the minimum value obtained in this investigation for native Salmonella strains (aw0.95) and that reported by ICMSF (1996) (aw0.94).
On the other hand, Koutsoumanis et al., (2004) showed in his research that cultures of S. Typhimurium, when incubated at temperatures below the range of 25º – 35° C, the minimum values of pH and aw that allow the growth of the pathogen must be increased, while temperature drops.
The influence of inoculum size on the growing of native Salmonella strains is supported by previous studies performed on other pathogenic bacteria, such as those obtained by Pascual et al., (2001). They observed the need to increase Listeriamonocytogenes inoculum size to start its growth, when NaCl concentration was increased or the pH of the culture medium decreased. Coleman et al., (2003) reported the influence of agitation, inoculum density, pH, and strain on the growth parameters of Escherichia coli O157:H7. They reported that there was a significant effect of initial population density at 10ºC but not at higher temperature, in pathogen cultures at pH 5.5.
In the study performed here, it was observed that native S. Newport grew at T 13.5ºC, pH 4.2 and aw 0.98, while Alonso and Hiroyuki (2010) observed no growth of S. Enteritidis at 15ºC, pH 4 and aw 0.98, when combined effects of hurdles on the pathogen were performed. Moreover, these authors reported that, when all collected data per pathogen were subjected to regression analysis to determine the effects of the independent variables on the responses, temperature was shown to be the greatest source of variation, significantly overwhelming the effects of pH and aw.In this case, results obtained here are in agreement with responses generated on the study by Alonso and Hiroyuki (2010).
The functionality between T and μmax, at aw 0.98, indicates that, when high temperatures with increasing pH were used, there was a slight increase in rate, as shown in Fig. 4. Alesser effect was observed at lower temperatures. The most important parameter in the extension of the lag phase is T, as well as for μmax. The factors of pH and aw have lower impact.
Theys et al., (2008) also reported the effect of pH and aw at maximum rate, which decreased with decreasing pH or aw, but the impact of the effect also depended on other factors, such as the presence of different concentrations of gelatine.
The inhibitory effect exerted by low aw on Salmonella is increased by the use of cold storage (ICMSF 1996). In this investigation, suboptimal physicochemical conditions (low aw, low pH, and refrigeration temperatures) simultaneously applied to salmonellas, exhibited greater effect than that exerted by any single factor used. When barriers are used in combination, temperature should be strictly controlled. In case of T abuse, even slight, pH will be the most important factor in controlling the growth of the pathogen.
Predicting Salmonella spp. behaviour with the Growth Predictor software (GPS), under the same combinations of pH and aw as those made in this research at 7ºC, showed growth of Salmonella after a long lag phase (12-14 days). Curves obtained with experimental data showed inactivation of the strain after similar lag periods. At 20ºC, there were no differences between the predictions and the experimental data in all of the combined values of pH and aw assayed. However, at 13.5º C, differences appeared between curves generated by the GPS and those obtained here, depending on pH and aw. For Runs 7 (pH 3.9, aw0.97) and 13 (pH 3.9, aw0.99), the GPS predictive curves showed growth of the strain, whereas the experimental curves showed germ inactivation. It is important to consider that data generated by models should be validated with experimental assays.
Conclusions
This work meets the recommendations of the Joint FAO/WHO Expert Meeting on Risk Assessment JEMRA (Codex Alimentarius Commission 1999) about data of native strains in developing countries and it is a potential contribution to Salmonella Risk Assessment. The use of MRA will lead, in turn, to the development of the necessary skills to conduct applied research to help visualize the connection of pathogen contamination problems in foods to human health.
Data obtained in this investigation contributes significantly to the characterization of the behaviour of native Salmonella strains and can be useful during decision making process for foods regulations.
Acknowledgements
This research was supported by the Universidad Nacional del Litoral, in Santa Fe Argentina, through funds for Scientific Research CAI+D.
Salmonellaserotypes (Table 1) were generously determined by M.I. Caffer and M. Pichel (Dept. Enterobacterias, Inst. Malbrán, Buenos Aires, Argentina).
The authors also acknowledge helpful insights on early versions of these investigations offered by Dra. MaríaLourdes Costarrica, México.In addition, our special appreciation goes to Dr. O.P. Snyder, who is acknowledged for the reading of the manuscript and providing, and also to Ms. Lynn W. Hodulik for review of the use of the English language (HITM, St. Paul, MN). We also thank Dr.Andrea Bergesio the generous information on statistical stuff.
References
1. Alali, W.Q., Doyle, M.P., Cox Jr, N.A., Walls, I. 2012. “Salmonella prevalence in poultry varies greatly in emerging markets”. WATT Poultry USA. 13 18-26.
2. Alegre Vilas, I. (2012) “Capacidad de crecimiento de patógenos de transmisión alimentaria en manzana y melocotón mínimamente procesados y nuevas estrategias de intervención para mejorar su seguridad microbiológica,” PhD Thesis, Universitat de Lleida, España. Available in: http://hdl.handle.net/10803/84172. Accessed 19 February 2014
Google Scholar
3. Alonzo, A. G. and Hiroyuki, N. (2010) “Responses of E. coli O157:H7, List monocytogenes 1/2c and SalmEnteritidis to pH, aw and temperature stress combinations,”Food Control,21644-650. DOI: 10.1016/j.foodcont.2009.10.001
Publisher – Google Scholar
4. Baranyi, J. and Roberts, T. A. (1994) “A dynamic approach to predicting bacterial growth in food. Review Paper,”International Journal of Food Microbiology,23277-294. DOI: 10.1016/0168-1605(94)90157-0
Publisher – Google Scholar
5. Black, D. G. and Davidson, P. M. (2008) “Use of modelling to enhance the microbiological safety of the food system,”Comprehensive Review in Food Science and Food Safety,7159-167. DOI: 10.1111/j.1541-4337.2007.00034.x
Publisher – Google Scholar
6. Box, G. E. P. and Behnken D. W. (1960) “Some new three level designs for the study of quantitative variables,”Technometrics2455-475.
Google Scholar
7. Caffer, M. I., Alcain, A.,Pangópulo, M., Moroni, M., Brengi, S. andTerragno, R. (2010) “Serovariedades de Salmonellaspp. en Argentina, 2007-2009,”ConferenceProceedings of XII Congreso Argentino de Microbiología – VI Congreso de la Sociedad Argentina de Bacteriología, Micología y Parasitología Clínica (SADEBAC) – I Congreso de Microbiología Agrícola y Ambiental (DiMAyA),Buenos Aires, Argentina (2010).P146 — 27432.Published in: Revista Argentina de Microbiología (2010) 42 (1) 80.
8. Caffer, M. I., Alcain, A., Pangópulo, M. andTerragno R. (2007) “Evolución de la salmonelosis en Argentina, en el período 2004 — 2006,”ConferenceProceedings ofXI Congreso Argentino de Microbiología, Asociación Argentina de Microbiología.Córdoba, Argentina.Oralcommunication (7) -20320.
9. Codex Alimentarius Commission CAC Joint FAO/WHO. Food Safety. (1999) “Principles and guidelines for the conduct of a microbial risk assessment (CAC/GL-30-1999),”available in: http://www.who.int/foodsafety/publications/micro/cac1999/en/ . Accessed 19 February 2014.
10. Codex Alimentarius Commission. Joint FAO/WHO Food Standards Program (2011) “Guidelines for the control of Campylobacter and Salmonella in chicken meat. (CAC/GL 78-2011),”available in:
http://www.codexalimentarius.net/download/standards/11780/CXG_078e.pdf Accessed 19 February 2014.
Publisher – Google Scholar
11. Coleman, M. E., Tamplin, M. L., Phillips, J. G. and Marmer, B. S. (2003) “Influence of agitation, inoculum density, pH, and strain on the growth parameters of Escherichia coli O157:H7 relevance to risk assessment,”International Journal of Food Microbiology(83)147-160DOI: 10.1016/S0168-1605(02)00367-7
Publisher – Google Scholar
12. CSPI Center for Science in the Public Interest (2011), Petition for an Interpretive Rule Declaring Specific Strains of Antibiotic Resistant Salmonella in Ground Meat and Poultry to be Adulterants,available in:
http://cspinet.org/new/pdf/cspi_petition_to_usda_on_abr_salmonella.pdf Accessed 8 april 2014.
13. FAO/WHO (2002) “Risk Assessment of Salmonella ineggs and broiler chickens”, in Microbiological Risk Assessment Series Nº 2. ISBN 92 5 104872 X (FAO)
Google Scholar
14. FAO/WHO (2009) “Salmonella and Campylobacter in Chicken Meat: Meeting Report,”in Microbiological Risk Assessment Series No. 19. ISBN 978 92 4 154790 1.
Google Scholar
15. Floros, J. D. and Chinnan, M. S. (1988) “Computer graphics assisted optimization for product and process development,”Food Technology42 (2)72- 78.
16. Giovani, M. (1983) “Response surface methodology and product optimization,”Food Technology37(11)41-46.
17. ICMSF International Commission on Microbiological Specifications for Foods (2011) Microorganisms in Foods 8,. Use of Data for Assessing Process Control and Product Acceptance 1stedn, Corrective Actions to Reestablish Control,Katherine MJ Swanson (ed), Springer New York Dordrecht Heidelberg London, ISBN 978-1-4419-9373-1
Google Scholar
18. ICMSF International Commission on Microbiological Specifications for Foods (1996) Microorganisms in Foods 5, Microbiological Specifications of Food Pathogens 1stedn., Salmonellae, Blackie Academic & Professional(ed) London, UK, ISBN 0-412-47350-X.
19. INEI Instituto Nacional de Enfermedades Infecciosas — ANLIS “Dr. Carlos G. Malbrán, Servicio Enterobacterias, Departamento Bacteriología (2006) “Evolución de las infecciones humanas por Salmonellaspp. en Argentina (2004-2005),” Boletín Epidemiológico Periódico Nº 30. Ministerio de Salud. Presidencia de la Nación, Argentina available in:
http://msal.gov.ar/htm/site/sala_situacion/PANELES/boletines/boletin_BEP30.pdfAccesed 19 february 2014.
20. Juneja, V. K., Valenzuela Melendres, M., Huang, L., Gumudavelli, V., Subbiah,J. and Thippareddi, H. (2007) “Modeling the effect of temperature on growth of Salmonella in chicken,”Food Microbiology24328-335.
Publisher – Google Scholar
21. Koutsoumanis, K. O., Kendall, P. A. and Sofos, J. N. (2004) “Modeling the boundaries of growth of Salmonella Typhimurium in broth as a function of temperature, water activity and pH,”Journal of Food Protection67(1)53-59.
Google Scholar
22. McCann, M. S., McDowell, D. A. and Sheridan, J. J. (2009) ”Effects of reduction in beef surface water activity on the survival of Salmonella Typhimurium DT104 during heating,” Journal of. Applied Microbiology1061901-1907.DOI: 10.1111/j.1365-2672.2009.04154.x
Publisher – Google Scholar
23. Oscar, T. P. (2004) “A quantitative risk assessment model for Salmonella and whole chickens,” International Journal of Food Microbiology93231-247. DOI: 10.1016/j.ijfoodmicro.2003.12.002
Publisher – Google Scholar
24. Oscar, T. P. (2009) “Predictive Model for Survival and Growth of Salmonella Typhimurium T104 on Chicken Skin during Temperature Abuse,”Journal of Food Protection 72 (2)304—314.
Google Scholar
25. Pascual, C., Robinson, T. P., Ocio, M. J., Aboaba, O. O. and Mackey, B. M. (2001) “The effect of inoculum size and sublethal injury on the ability of Listeria monocytogenes to initiate growth under suboptimal conditions,”Letters of Applied Microbiology33357-361.DOI: 10.1046/j.1472-765X.2001.01012.x
Google Scholar
26. Pradhan, A. K., Li, M., Li, Y., Kelso, L. C., Costello, T. A. and Johnson, M. G. (2012)“A modified Weibull model for growth and survival of Listeria innocua and SalmonellaTyphimurium in chicken breasts during refrigerated and frozen storage,”PoultryScience911482-1488.
27. Theys, T. E., Geeraerd, A. H., Verhulst, A., Poot, K., Van Bree, I., Devlieghere, F., Moldenaers, P., Wilson, D., Brocklehurst, T. and Van Impe, J.F. (2008) “Effect of pH, water activity and gel micro-structure, including oxygen proï¬les and rheological characterization, on the growth kinetics of SalmonellaTyphimurium,”International. Journal of Food Microbiology12867-77. ISSN 0740-0020. DOI: 10.1016/j.ijfoodmicro.2008.06.031.
Publisher – Google Scholar
28. USDA-FSIS United States Department of Agriculture/Food Safety and Inspection Service (2008)Isolation and Identification of Salmonella from Meat, Poultry, and Egg Products. Laboratory Guidebook (MLG 4.04),Available in: http://www.fsis.usda.gov/PDF/MLG_4_04.pdfAccessed 19