Introduction
Customer-Centric marketing viewpoints have been receiving a substantial amount of attention by academics and researchers. They are progressively searching for methods in order to better comprehend, appeal to, keep and build a close and intimate long-lasting relationship with clients that are considered profitable (Kotler, et al, 2006). Making sure that the current clients are fully satisfied is one of the most vital areas of the client-centric marketing model. For this reason, companies have been studying and working on strategies that will lead to customer satisfaction. If a client is satisfied, then that client is six-times more probable to bond with the company through loyalty, repeat purchases, and promote the company’s product through word of mouth marketing, by encouraging peers to try it than an unsatisfied customer. Similarly, it is noted that a satisfied client voices his/her appreciation about the brand to five other individuals. So on one hand, a 5% boom in customer loyalty can improve and raise company profits by 25%-85%, while on the other hand, an unsatisfied customer voices his/her dissatisfaction to eight to ten individuals (Limayem, 2007).
Several research studies have concluded the idea that client loyalty and retention are mainly influenced, and directly proportional to customer satisfaction (Heskett et al., 1997). As a result, companies that are basing their marketing strategy on long- term growth are progressively establishing measures in order to create satisfied customers. It is true that effective feedback, and most importantly customer complaints, can be used to determine overall satisfaction; however it has its limitations, because the average organization does not hear back from 96% of its unsatisfied clients, and 91% of those 96% will not return (Pedron et al, 2009).
One benchmark to meet the organizational objective is that a firm must establish the demands of its customers and then provide goods and services that appease those demands better than the competitors. Therefore, an important assignment is to decide, with some preciseness, how much Customer satisfaction can maximize customer loyalty. Understanding exactly what customers and patients require or need from their providers is defiance for many of those providers (Oyatoye et al., 2013).
There are many studies on customer satisfaction, mainly in the banking sector (e.g. Ogbadu et al, 2012; Adebanjo, 2003), and little on this challenge in the pharmaceutical industry. According to Kotler and Keller (2006), the most important role of customer satisfaction, which is a means of managing all data about any client and their touch points, is to boost customer loyalty.
This article’s objective is to study why the pharmaceutical company in question is facing decreased sales, which hospitals are the company’s most profitable and significant clients, and to suggest a way to solve this problem. The main research question is: To what extent can customer service be beneficial to pharmaceutical companies?
Once these questions are answered, the reasons behind decreasing sales will be evident, in addition to which clients are unsatisfied, and at what level are they not satisfied. This way, the institution will know how to increase customer loyalty and eventually, overall profitability.
Literature Review
Status of Pharmaceutical Industry in Lebanon
The pharmaceutical market in Lebanon is valued at approximately 1,925 billion LBP in the year 2012. It means an increase of 6.5% from the year 2011. In 2015, it was expected to grow by a rate of 7.71% to attain a value of 2,095 billion LBP. This boom was also mirrored in the sales of pharmaceutical products which is continuing to increase, and is forecasted to reach almost 430 USD per individual in the year 2009, which is almost twice the value in 2009 which was 206 USD per person.
Lebanon is considered as an importer of pharmaceutical products as opposed to a manufacturer, since imports constitute almost 90% of the market share, while manufactured drugs and devices account for 10% only. In the year 2012, Lebanon’s estimated imported goods were almost 970 million USD, which is an increase of 12.9% from 2010. The countries from which Lebanon imports most goods are France, United Kingdom, Switzerland, and Germany.
The Lebanese Pharmaceutical Company In Question
This research studies the situation of a particular pharmaceutical company whose identity is confidential due to the use of its actual sales figures and customers. This company was established in 1975 and is considered as a one of the leading pharmaceutical companies in Lebanon. Its products are divided into cardiovascular, Orthopedic, Disinfection and Sterilization, and General Surgery. The products are distributed in pharmacies, where the customer has the choice in choosing which product he/she wants, in hospitals and doctors’ clinics.
However, this study will be involved in the general surgery department only. The products are anesthesia care (endotracheal tubes, Venturi, oxygen and nebulizer masks, nasal cannulas, rebreathing bags, breathing circuits… etc.), sutures required in all types of surgeries, short-term, long-term and medium-term, surgical instruments like scalpels, scissors, forceps, retractors, … etc. These products are only sold in hospitals and can only be ordered by doctors, residents, nurses, quality control agents, purchasing department and store managers. The clients of this company are hospitals in all of Lebanon.
Although the pharmaceutical company is considered as one of the leading companies in Lebanon, it has been facing a significant decrease in its revenues from surgical equipment.
Competitive advantage
Capable work force:
- Lebanon is known for the superior quality of its university education. It is ranked by the
- Global Competitiveness report in the year 2012, in tenth place worldwide as general education and fourth place for its math and sciences higher education.
- Tactical Geographical Location: Lebanon is strategically located in the middle of the three continents: Asia, Europe, and Africa and in the middle of the quickest booming pharmaceutical markets globally.
- Rapid Growing Pharmaceutical Markets: Countries that have emerging economies, like Lebanon, are expected to grow almost five times as much as industrialized countries throughout 2020.
- Highly- Advanced healthcare service Providers: The proportion of doctors to people in Lebanon is one of the highest worldwide, since there are almost 35 doctors for every ten thousand people as per the WHO (World Health Organization) in 2012. Because of this fact, and also because of the highly-advanced private hospitals, Lebanon has become the go-to place for Middle Eastern patients, and place for continuous market boom.
- Relatively Expensive Medication Prices: Prices for Medicines and surgical equipment are more expensive in Lebanon compared to neighboring countries.
- Support and Help from the Government: Some incentives are gives to businesses that are involved in pharmaceutical marketing by the “Investment Development Authority of Lebanon”. Some of those incentives can involve exemption from taxes for up to 100% for a period of up to ten years.
- Proper Regulatory Basis: “Lebanon’s Intellectual Property Law (IP) law was passed in the year 19999 which protects medication and surgical brands from unfair competition through patents, copyrights, trademarks, and penalties for violation.
In 2010, sales in Lebanon were raised by 18% to reach USD 1.18 billion. The pharmaceutical industry in Lebanon kept on growing at a slow rate of 1.7% in 2011 (USD 1.20 billion) and 8.3% in 2012 (USD 1.30 billion) even with the financial challenges that encountered Lebanon. It is important to mention that almost ninety percent of the health sector, like pharmacies and hospitals, are owned by the private sector.
In Lebanon, the individual person’s spending on medications per capita is the uppermost in the Middle East. There are many causes for this fact. The pharmaceutical market in Lebanon is controlled by the big number of privately owned pharmacies that undergo a certain mark-up system on medications. This led to doctors prescribing medicines that are costly even when a cheaper alternative is available in order to increase revenues. Also, there are approximately fifty pharmaceutical firms which restrict the welfares of economies of scale.
In the year 2010, there was a growth of almost 11.3% of pharmaceutical expenditure per capita, attaining USD 278. The per capita sales only increased by 1.3% approximately attaining USD 281.7 in 2011. By 2012, the spending per capita also increased by almost 6.2% reaching USD 299.1.
Customer Satisfaction
The word satisfaction results from the Latin word “Satis” that means enough, and “facere” that means to make. Therefore the two words together mean to make or to provide enough. These words show that satisfaction suggests a feeling of fulfillment. More recent studies however suggest other meanings to the word “satisfaction”. Customer satisfaction is explained as a client’s general feedback about his/her purchase and consumption of a product. Additionally, a customer’s perceived product quality refers to his/her own point of view and judgment about that product. So customer satisfaction does not have a general rule, it is subjective to each and every consumer’s evaluation that is linked to consumption experience (Namkung et al, 2008).
Over the last ten years, all organizations have realized the importance and necessity of customer satisfaction. To retain a client costs much less than to win a new one. There exists a strong association between customer satisfaction, retention and profitability. According to Hill et al, (2000), client satisfaction is how much a company performs in accordance to its clients’ expectations. However, Armstrong et al., (2009) describe customer satisfaction as how much a company’s products match its clients’ expectations. So of the company’s performance was the same or matched what its clients’ expected, then the clients are satisfied. The factors that affect customer satisfaction are perceived value, the image of the organization, what the client expects, and the quality of the goods and services.
Consumer satisfaction has been operationalized as both one-element and multiple element scale. For instance, Shank (2002) saw client satisfaction as a single element scale, which measures the consumer’s general feelings towards a company. While Meng et al, (2009) saw client satisfaction as multi-faceted and utilized multiple element scales to measure it.
Ameliorating a firm’s relationship with its clients and increasing retention through increasing loyalty does not only signify better managing client interactions, but also dealing with them in a fundamentally enhanced manner.
The Profit-Chain of Customer Satisfaction
A firm’s profitability can be outlined back to customer satisfaction for many companies. Researchers have proven that a 5% boom in client reliability can lead to an increase of between 25%-85% of profits (Hill et al, 2000).
High customer satisfaction leads to the feeling of bonding between the client and the organization, so he/she feels the sense of belonging and commitment. When the client develops the bond with the organization, then he develops a feeling of loyalty to the brand. Customer loyalty and retention, influenced by satisfaction, is a key to a firm’s success. Academics are confirming more and more that satisfaction causes repeated purchases, a deeper brand loyalty and the spreading of encouraging opinions of the good. So loyalty will lead to repeat purchases, and eventually profit.
There are many aspects that must be accounted for from the seller’s part in order to completely implement the idea of customer satisfaction, which is a main measurement for quality philosophies and measurement and management tools (Wink et al, 2009).
Delivering Quality to Consumers
Conveying good quality to consumers in the market calls for continuous improvements and ameliorations of the client’s experience and overall satisfaction because the market is very competitive. Most consumers fall in the range between reasonably satisfied to reasonably unsatisfied, which means that more than half of the clients are basically undecided about their loyalty to a certain firm. These clients would most probably lose their loyalty when even a modest stimulus is to present itself; for example, like a lower price, the opening of a more conveniently located store… etc. (Schneider et al, 1999). In order to evaluate this, there must be satisfactory market research data that deliver an explanation of how client satisfaction and loyalty influence consumer buying behavior (Large, 2003).
Once the company’s products reach or exceed the client’s perception of quality, then that client will spread positive words about the product through “word of mouth marketing”, and create loyalty (Dutta et al, 2009).
Methodology
The population will target all of the pharmaceutical company’s clients, which are hospitals in all of Lebanon from the North to the South. This study will target hospitals that are the company’s customers located in different regions in Lebanon: Dahye, Jnah, Aley, Chouf, Saida, Tyr and Nabatieh. This includes a total of 20 hospitals. The sample for this research includes medical staff in the OR, ICU, Purchasing department, Quality Control and ICN. There are 328 people working in these departments in total who can influence buying habits, and who can place purchase orders. To pursue this research, a sample of 200 was chosen from the 328 potential responders. Individuals working in other departments were not chosen for this article because they are not decision makers for the company’s general surgery products.
The sampling procedure is stratified Random Sampling, because the hospitals are divided into areas, and a random sample will be chosen from those areas. More specifically, 200 individuals will be chosen from the 328 employees working in the West Beirut, Jabal, and South area.
Questionnaire Design and Preparation
The Questionnaire was comprised of two divisions. The first division focused on the individual’s traits, like age, years of experience, gender, educational level, and career. The second division was concerned with the purpose of this thesis.
The questions in the survey were organized in a proper sequence, where the first section focused on personal traits, and the second section moved to customer satisfaction, ending with customer loyalty.
The questionnaire sent to the customers was the same one regardless of their department.
The survey was refined and fixed after studying many models, like: Masroje 2009, Shiah 2005, and Rahimi 2008.
Response Rates
The response rate was 100% since the researcher personally delivered the questionnaire to each employee by hand, and waited in a different room for the employees to fill the survey.
Data Collection
The data collection stage was accomplished by the researcher without any help. The distribution was based on previously prepared client lists in order to prevent duplication. This also prevented hospital employees who are not familiar with the company, or who haven’t worked with its products before from filling the questionnaire.
The researcher drove to each of the 20 hospitals, met with each of the people and gave them the survey by hand, then waited in a separate room until the hospital employees were done filling it.
Ethical Matter
An explanation of customer satisfaction preceded the questionnaire in order to avoid any confusion. The hospital employees were visited personally, and were kindly encouraged to fill the survey. Since the researcher agreed with the employees on specific appointments for the visit, the employees had time to fill the questionnaire. The researcher waited in a separate room.
Data Coding and Entry
Data from each questionnaire was entered on SPSS which is the (Statistical Package for Social Science). Regression analysis was performed initially on e-views to understand which hospitals influenced the pharmaceutical company’s sales most. Then factor analysis was used on the results of the questionnaire in order to group the results so they would be easier to study and to reach a conclusion.
Data Measurement
For the suitable system of analysis to be chosen, the degree of measurement needs to be selected. For instance, in this study, the ordinal scale was used. The ordinal scale uses numbers in an increasing or a decreasing order. The interval between the numbers is not equal, and the numbers do not mean absolute magnitudes. They are simply numerical labels. The following is demonstrated according to a Likert scale.
Variables
The independence variable is anything that can be subjective or used like a reason; while the dependent variable is the result of the independent variable, and therefore can be influenced by it (Trochim and Donnelly, 2006).
Regarding this study, and the research questions that it discusses, the dependent variable is solely total sales, while the independent variables are loyalty, customer satisfaction with products, customer satisfaction with the medical representative, loyalty, and customer satisfaction with the customer service department.
Pilot test
A pilot test of 15 observations was conducted in order to verify if the survey is based on consistent scientific grounds, and to see the extent to which the questionnaire reaches its intended objectives and to pinpoint any flaws in the survey design.
Statistical Validity of the Questionnaire
Validity is how much a certain instrument actually measures what it must be measuring (Pilot et al, 1985). In order to make sure of the validity of the survey, two statistical tests must be used. The first test is the Criterion-related validity. This test calculates the correlation coefficient between each section. While the second test is the Spearman Correlation test, used to check the validity of the structure of the survey by checking the validity of each part of the survey, and for the survey as a whole. It calculates the correlation coefficient between parts of the survey that use the same scale. The Spearman Correlation showed a good result, so the structure of the survey is significant.
Criterion Related Validity– Pilot Test
The consistency of the survey was measured using a pilot test, which included 15 questionnaires, where there was a measure of the correlation coefficients between each section of the questionnaire, and the whole survey
Cronbach Alpha
Cronbach’s alpha measures how reliable the survey is between each part and throughout the survey. The value for Cronbach’s coefficient alpha must fall in the range [0 – 1]. The higher the resulting value the greater the internal consistency and reliability of the survey. The Cronbach alpha of this research was 0.736, which means that the survey is reliable.
Internal Validity
Internal validity is known as the fundamental relationship between the variables (Independent and dependent). Internal validity faces threats regarding history, mortality, regression, testing, instrumentation, and maturation. In this research, they do not constitute threats.
Findings
Descriptive Analysis of the Sample
Age
More than half of the questionnaire respondents are between the ages of 30-49 years old (59.5%), which shows that the chosen customers are mature enough to be able to contribute to this research.
Education Backgrounds
Regarding the education backgrounds, 92.5% of the respondents have a Bachelor’s degree at least. This shows that respondents can understand the goal of this research, and can give practical answers. So the study will be as close to reality as possible.
Years of Experience
Regarding the years of experience, only 2 of the respondents have been the pharmaceutical company’s clients for less than 1 year, while 49% of the respondents have been dealing with the company for almost 20 years. So they are familiar with the processes, and can give a true opinion.
Hypothesis Testing
Regression Analysis
A regression analysis was performed on e-views program in order to find the company’s most significant customers. The clients (hospitals) are the primary contributors to the pharmaceutical company’s monthly revenues.
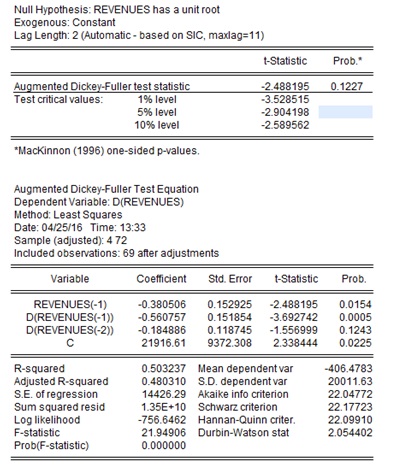
The researcher tested if the dependent variable (revenues) series is stationary. An augmented Dickey-Fuller test was conducted to verify if the series has a unit root. The null hypothesis of the Dickey-Fuller test is the unit root; thus non-stationary.
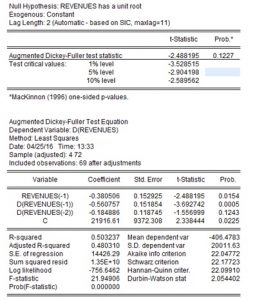
Figure 1: Augmented Dickey-Fuller Test
The obtained p-value was 12.27%, which is greater than 5%, which represents α/2 with 90% level of confidence; this means that Ho is not rejected; consequently the series has a unit root.
Revenues, as a series, must then be differenced to the first level (I=1), in order to check whether or not it will become stationary.
The obtained P-value, after differencing the revenues series to the first-level, was 0.0001, which means that Ho (the series has a unit root) must be rejected. D (revenues) is stationary.
D (revenues) is ∆ revenues = revenues t – revenues t-1. It is the increment in revenues between the month (t) and the month (t-1).
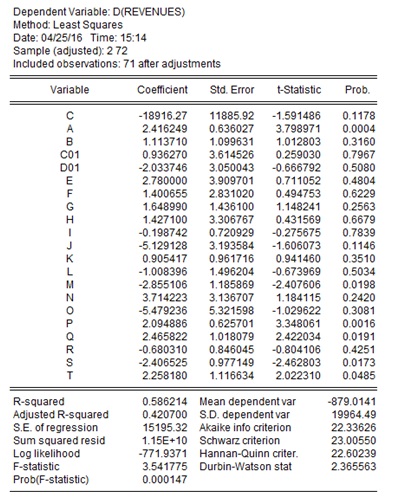
Once the series was turned stationary, the regression was performed; the explanatory variables (hospitals), with a p-value of more than 5% were removed, because their relative t-statistic was above the t-critical of the null hypothesis that their relative coefficient is equal to 0. In other terms, their p-value is greater than 5% (which represents α/2 with 90% level of confidence).

Figure 2: Regression D (Revenues)
The difference between R-squared and adjusted R-squared is more than 10% which means that there are insignificant explanatory variables, so the two highest p-values among all explanatory variables were eliminated. So the hospitals with a large p-value are removed gradually, recalculating and re-regressing after each removal. In this case, first C01 (p-value= 0.7967) and I (p-value =0.7839) were removed. Next, H (p-value= 0.6923) and F (p-value= 0.6366) were removed. Then D01 (p-value = 0.6074) and E (p-value = 0.5501) were removed. Then R (p-value= 0.3631) and L (p-value= 0.3550) were removed. Then O (p-value= 0.5396) was removed. After O, hospital N (p-value= 0.3760) and hospital G (p-value= 0.3351) were removed. After which hospital J (p-value= 0.1382) was removed. Then hospital B (p-value= 0.1159) was deleted. Hospital T (p-value= 0.0759) was later removed. And finally hospital M (p-value = 0.0732) was removed. The remaining p-values are all less than 5%, which means that all the remaining explanatory variables (hospitals) are significant.
The spread between R-squared and R-squared adjusted is less than 10%, so the significance of explanatory variables is confirmed.
Durbin-Watson statistic checks for autocorrelation on the dependent variable. In this case, Durbin-Watson statistic is 2.59, which means that there is a negative autocorrelation on the dependent variable. A lag must be added so that the Durbin-Watson value falls in the tolerated range of the statistic, which is [1.8 – 2.2].
The p-value of the lag is 0.000, which indicates that it is significant. Consequently, the value for Durbin-Watson statistic of 2.1973 falls on the limit of the tolerance range [1.8-2.2].
After adding the lag, the p-value of hospital S increased to p-value= 0.624, which is greater than 5%; so it was removed, and the same process took place with hospital S (p-value=0.6421), and hospital Q (p-value = 0.1524).
Another lag (revenues t-2) was added to try to comfortably place DW in its proper range. The p-value of the second lag came bigger than 5%, thus it was rejected. So the process is definitely an AR1 (auto-regressive).
In an attempt to further reduce the Durbin-Watson statistic, a residual lag was added (moving average MA). The below figure is the result:

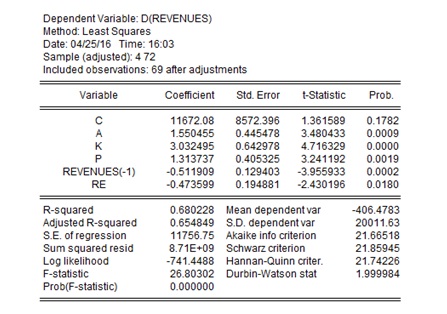
Figure 3: Final Regression Analysis after Durbin Watson Correction
The p-value of the residual (t-1) has a p-value <5%, meaning that it is significant. On the other hand, the DW statistic fell to 1.999 meaning that the autocorrelation effect was treated. So the final result of this regression is that revenues is a series that follows an ARIMA (1,1,1).
N.B: The constant C was also removed, because its p-value was >5%. “C” as a series is a constant so after differencing “Revenues” as a series to the first degree, it was deleted.
It is noted that the pharmaceutical company’s most significant customers are hospital K (Coefficient=3.0324), hospital A (Coefficient= 1.5504), and hospital P (Coefficient = 1.3137). Hospital K is the company’s most important client because its revenues are almost double those of the other two hospitals. The pharmaceutical company has many insignificant customers that are costing it more than they are giving back, so if it focuses on hospitals A, K, and P, by sending the medical representative to visit them regularly, spending money on training and conferences to further educate the staff and to make them feel cared for, important, and valued, then its total sales will be greatly positively influenced.
Factor Analysis
An exploratory factor analysis (EFA) can be defined as methodical simplification that follows a certain order of interconnected measures. Conventionally, EFA is used to discover the probable underlying assembly of the factors of a certain set of variables, without commanding a predetermined structure for the outcome (Child, 1990). By performing EFA, the causal structure of the factor is recognized.
Confirmatory factor analysis (CFA) can be defined as a statistical method that confirms the structure of the factor for a certain set of variables. CFA is a tool that helps the researcher either confirm or refute the hypothesis that a relationship exists between the variables from observations and their underlying latent theories.
An exploratory factor analysis was performed on SPSS (Statistical Package for the Social Sciences) Program in order to determine the level of satisfaction for the company’s most significant customers, and also to determine where the company falls short. Factor Analysis will group the factors into categories so that the company can easily analyze them in order to determine the best course of action.
First of all, a Pearson – Correlation test was performed on the data. Pearson-Correlation measures the linear correlation between all sets of two variables. The resulting values fall in the range [-1; 1], the value 1 means a total positive correlation, the value 0 means no correlation, and the value -1 means a total negative correlation. However, if the value is greater than the chosen significance level (α/2 for a two-tailed test), then the result is not statistically significant. On the other hand, if the value is less than the chosen significance level, then there is enough evidence that the correlation observed does exist in the evaluation. The Pearson-Correlation obtained showed enough correlation between multiple variables at the 0.05 significance level. Hence, we can proceed in the designated factor analysis (See Appendix C).
A factor analysis was performed on the sample size of 200 respondents. These respondents were selected from the 328 people working as doctors, residents, quality agents, nurses, purchasing agents, and storekeepers in the 20 hospitals that were chosen according to their geographical location (Aley, Chouf, Saidon, Tyr and Nabatieh).
The resulting KMO (Kaiser-Meyer-Olkin) value is 0.895, which is superior to the required 0.700, to show significant levels of correlation. The p-value (0.000) of the Bartlett Test of Sphericity shows that there are enough correlations to go ahead with the study.
Following the overall KMO and Bartlett test, those variables that scored less than 0.5 on the diagonal of the anti-image matrix, were also removed gradually starting with the lowest value; Gender (0.459).
After running the factor analysis on SPSS again, all MSA values in the anti-image table were above 0.5, and the KMO increased slightly to 0.897.
Following the table of “total variance explained”, it was noted that 5 factors represent 66.309% of the 26 variables (check Appendix B).
The scree plot shows the inflection point, or the meeting point between Eigen value =1 and the line drawn from the curve towards the horizontal axis. In this study, the inflection point was located on the fifth factor. Therefore 5 factors will be kept. (Check Appendix B)
After factor analysis was performed, we checked the un-rotated component matrix. We realized that there were multiple cross-loadings of variables between the factors; so, a rotation was necessary to eliminate those cross-loadings.
All rotations were tried, varimax, quartimax… etc., the varimax rotation method was adopted, since it resulted in the most convenient and suitable factor division.
The question “The Medical Representative contacts me as much as needed” scored 0.458 and 0.463 respectively on two factors so it was removed since the two numbers are almost equal.
The question “I am satisfied with the overall efficiency of the products” scored less than 0.45 on all of the 5 factors, so it was also removed.
The resulting rotated component matrix can be found on Appendix C:
After removing all factor loadings, the KMO became 0.898, which is slightly higher than before.
The 5 resulting factors were named:
Factor I – Customer Service
Factor II – Company Products
Factor III – Medical Representatives
Factor IV – Customer Loyalty
Factor V – Customer Profile
Discussion of the hypotheses
The hypotheses for this study are:
H1: Total Sales Revenues are driven by price and quality.
H2: Quality and Price positively influence customer satisfaction.
H3: Customer service has a significant influence on customer satisfaction.
H4: The medical representative positively affects customer satisfaction.
As a result of the factor analysis study, a clear conclusion was derived as to the importance of customer service as the deciding factor in determining customer satisfaction.
On a second level comes the quality and price of the general surgery equipment,
Since factor 2 not factor 1 proved to be the most important, then the initial hypothesis was refuted.
Surprisingly, the customer service proved to be more important than quality and price of the products themselves. At the third level comes the medical representative, customer loyalty at the fourth level, and customer profile is at the fifth level.
Conclusion
The results clearly show that the company’s customers are satisfied with the products and the use of the products; however they were not satisfied with the Customer service department and with the sales team. Hence, the main issue does not reside in the prices and quality of the products, but in customer service (pre-sales and post-sales).
The pharmaceutical company, as was noticed from both the regression and factor analysis, has a big number of insignificant clients, who barely contribute to the total monthly revenues of the firm. So if the firm focuses its efforts on hospitals A, K and P by for example, finishing offer quotations, replying to client inquiries in a timely manner, visiting the clients more often, positively changing the attitude of the customer care department, and spending money in retaining and trying to increase the satisfaction of the clients that work in these hospitals, then the pharmaceutical company can significantly increase its revenues. Marketing, promotional items, gifts, invitations, incentive travel etc.
Limitation of the Study
One limitation to the study is that the pharmaceutical company’s many products were not differentiated. They were considered as “product line”, which is the overall performance of the product. Also, it is vital to mention that the general surgery products did not change, and have been of the same quality for more than ten years.
Managerial Implications
This study will facilitate the job of the pharmaceutical company’s managers that have been trying to find a solution for the decreasing sales over the past years, and were unable to do so. In this thesis, the causes of the main problem, decreasing sales, have been identified. The main hospitals that influence company revenues have also been identified.
Recommendations
In this study, the components of the customer satisfaction of Lebanese pharmaceutical companies were examined by conducting a survey of 200 observations that covered hospital staff that work as doctors, residents, nurses, purchasing agents, store keepers, and quality agents, since they are the ones that have a say in the purchase of the surgical equipment; and it was found that what determines satisfaction are as ranked below service, product/price, medical representative, loyalty, and customer profile.
Furthermore, a thorough regression analysis was conducted to determine significant customers, which were only hospitals A, K, and P and a recommendation to focus marketing, sales and advertising efforts on those same customers.
For future papers, it would be interesting to see if the results of this paper for this specific pharmaceutical company can be generalized to other pharmaceutical companies in Lebanon or abroad.
References
- Adebanjo D. (2003), Classifying and selecting e-CRM applications: an analysis-based proposal, Management Decision, Vol. 41 No. 6, pp. 570-577.
Google Scholar
- Armstrong,S. J. and Fukami, C. F. (2009), Past, present and future perspectives of management learning, education and development, The Sage handbook of management learning, education and development, London: Sage, pp. 1-23.
Google Scholar
- Child, D. (1990), The Essentials of Factor Analysis, second edition, London: Cassel Educational Limited.
Google Scholar
- Dutta Anil, Dutta Kritti (2009) Customer Expectations and Perceptions across the Indian Banking Industry and the Resultant Financial Implications, Journal of Services Research,Volume 9, Number 1 (April-September 2009)
Google Scholar
- Heskett, J. L. Jones, T. Loveman, G. W., Sasser, W.E. & Schlesinger, L.A. (1994): Putting the Service-Profit Chain to Work, Harvard Business Review, March-April, pp. 164-174.
Google Scholar
- Hill, N, Alexander, F, (2000), Hand Book of Customer Satisfaction And Loyalty Measurement, Aldershot, Hampshire: Grower Publishing Limited.
Google Scholar
- Balanda, H. MacGillivray (1990), Kurtosis and spread, Canadian Journal of Statistics, 18:17-30.
Google Scholar
- Kotler P, Keller K, (2006), Marketing Management, 12th edition, New Jersey: Pearson Prentice Hall.
- Large Ian (2003), The Customer is King, Materials Management and Distribution, 48(3), 82.
Google Scholar
- Limayem, Moez, Hirt, Sabine Gabriele, Cheung, Christy M, (2007), How Habit Limits the Predictive Power of Intention: The Case of Information Systems Continuance, MIS Quarterly, (31: 4) pp.705-737.
Google Scholar
- Menassa, E. (2014), Business Research Methodology, BUS668, Lecture 4, Strategic Philosophical Debates, Notre Dame University.
- Meng Juan, Elliot Kevin (2009), Investigating Structural Relationships between Service Quality, Switching Costs and Customer Satisfaction, Journal of Applied Business and Economics, Minnesota.
Google Scholar
- Namkung Young, Jang Shawn (2008), Are highly satisfied restaurant customers really different, Journal of Contemporary Hospitality Management Vol. 20 No. 2,
Google Scholar
- Oyatoye E, Adebiyi, O, B. Amole, (2013), An Empirical Study on Consumers Preference for Mobile Telecommunication Attributes in Nigeria, British Journal of Economics, Management & Trade 3, No.4, pp. 419-428.
- Pedron, C. D. and Saccol, A. Z. (2009), What Lies Behind the Concept of Customer Relationship Management, Discussing the Essence of CRM through Phenological Approach, Brazilian Administration Review (BAR), Vol. 6, (1).
- Pilot, D, Hungler, B. (1985), Essentials Of Nursing Research; Methods and Applications, B. Lippincott company.
- Trochim, W. Donnelly, J. (2008) The Research Methods Knowledge Base, Atomic Dog.
- Shank, Linda Pearl, (2002), Consumer’s perceptions of quality, value and satisfaction: A behavioral consequences view, DBA dissertation, Nova Southeastern University, United States, Florida.
- Schneider Benjamin, Bowen David, (1999), Understanding Customers delight and outrage, Sloan Management Review pp. 35.
Google Scholar
- Spreng, Richard A, MacKenzie, Scott B, Olshavsky, Richard W. (1996), A Reexamination of the determinants of consumer satisfaction, Journal of Marketing, July 1996; 60,(3).
Google Scholar
- Wink Angela M, Roethlein Christopher J. (2009), A Satisfaction-Based Definition of Quality Journal of Business & Economic Studies, 15, No. 1.
Google Scholar