Bismaleimide/Rice Husk Nanosilica Nanocomposites — Investigation on Thermal Properties

Dharmaraj Rajamani1, Shanmugam Muthusubramanian2 and Chinnaswamy Thangavel Vijayakumar3

1Department of Chemistry, The Standard Fireworks Rajaratnam College for Women, Sivakasi – 626123, India

2Department of Organic Chemistry, School of Chemistry, Madurai Kamaraj University, Madurai – 625021, India

3Department of Polymer Technology, Kamaraj College of Engineering and Technology, S.P.G.C. Nagar, K.Vellakulam Post – 625701, India

Academic Editor: Weixing Wang

Cite this Article as:

Dharmaraj Rajamani, Shanmugam Muthusubramanian and Chinnaswamy Thangavel Vijayakumar, “Bismaleimide/Rice Husk Nanosilica Nanocomposites — Investigation on Thermal Properties”, Journal of Research in Nanotechnology, Vol. 2015 (2015), Article ID 989594, DOI: 10.5171/2015.989594

Copyright © 2015. Dharmaraj Rajamani, Shanmugam Muthusubramanian and Chinnaswamy Thangavel Vijayakumar. Distributed under Creative Commons CC-BY 4.0

Abstract

Nano silica particles are obtained from the inexpensive agricultural waste rice husk ash, by acid alkali treatment. Organic and chemical modifications are done in the nano silica particles in order to enhance their surface reactivity and to introduce reactive functional groups to achieve adequate bonding between polar inorganic nano silica particles and organic polymer. The nano silica, organically and chemically modified nano silica particles are dispersed in 4,4’-bismaleimidodiphenylmethane (BMIM) by ultrasonic method. Fourier Transform Infrared studies confirm the interaction existing between the nanosilica particles and the BMIM matrix system. The decrease in the enthalpy of curing, curing temperatures and degradation temperatures confirm the catalytic activity exhibited by nanosilica and modified nanosilica particles on the curing of BMIM and degradation polyBMIM matrix. The Ea values calculated for curing and thermal degradation process are influenced by the interaction of nanosilica, and modified nanosilica particles with the BMIM matrix system. The scanning electron microscopy images show the uniform dispersion of nanosilica particles in the BMIM.

Keywords: Bismaleimide, Rice husk, Nanosilica, Kinetics
Introduction

Nanocomposites refers to composites in which one phase has nanoscale morphology such as nanoparticles, nanotubes etc. [1]. Polymer nanocomposites are polymer matrices filled with finely dispersed nanoscopic inorganic particles that have at-least one dimension in the nanometer range typically 10-100 nm in order to dramatically improve the performance properties of the polymer [2]. Nanofillers with high aspect ratio have higher specific surface area, providing better reinforcing effects and lead to marked improvement in properties when compared to pure polymers or their traditional composites [3, 4]. Properly chosen polymer matrix and nanofiller will give polymer nanocomposites having much better polymer/filler interactions than conventional composites.

When the microparticles are converted into nanoparticles a tremendous change in physical properties takes place [5]. Nanomaterials may include nanofibers, nanotubes, nanowires and fullerenes. The important factor related to nanocomposites is the interfacial adhesion between reinforcing nanofiller and a matrix polymer. In order to obtain good compatibility between these two materials with different properties, reinforcing nanofillers are used after chemical modification. Chemical modification is done to overcome the incompatibility between matrix polymer and nanofiller due to the difference in their hydrophobicities.

Rice husk is the outer layer of rice grain which is removed during rice processing. Rice husk contains 34-44% cellulose, 23-30% lignin, 13-39% ash and 8-15% moisture [6,7]. Tones and tones of rice husks are produced every year by rice mills as agricultural waste. The disposal of rice husk has become a problem due to environmental concerns. This agricultural problem actually provides opportunities for the researchers to utilize rice husk into value added products. Incineration of rice husk produces rice husk ash. Silica is the major constituent of rice husk, hence it becomes economical to get silica from the ash, which has wide market and also takes care of ash disposal [6-9]. Silica has been used in many application areas including the synthesis of nanosilica and other related materials [10]. Nanosilica is one of the valuable inorganic multipurpose chemical compounds. However, the manufacture of nanosilica is energy intensive, a variety of industrial processes involving conventional raw materials require high furnace temperatures. But in our work, nanosilica particles are prepared by the low cost acid alkali treatment.

In this study, nanosilica (NS) particles derived from rice husk is used as filler for 4,4’-bismaleimidodiphenyl methane (BMIM). To improve the compatibility between the BMIM and the nanofiller, an inexpensive modifier, n-octadecanoic acid (Stearic acid, SA), containing a hydrophobic long alkyl chain was used to modify the surface of the nanosilica particles [11]. Another modification in the nanosilica particles was done by using N-[4-(chlorocarbonyl)phenyl] maleimide (Cl-CPMI) which contains a reactive maleimide group. The nanosilica, organically modified nanosilica with stearic acid (NSOM) and chemically modified nanosilica using N-[4-(chlorocarbonyl)phenyl] maleimide (NSCM) are then blended with BMIM and thermally cured to produce the BMIM/silica nanocomposites.  The thermal curing behaviour and the thermal degradation properties of these BMIM/silica nanocomposites are investigated in detail and the results are presented and discussed.

Theory

The following two equations are the fundamental expressions used to calculate kinetic parameters from thermal analysis data.

dα/dt = A exp(-Ea / RT) f(α)               (1)
dα/dT = (A/ β) exp(-Ea / RT) f(α)          (2)


Where dα/dt is the reaction rate, A is the pre-exponential factor, Ea is the apparent activation energy (kJ mol-1), R is the gas constant (8.314 J K-1 mol-1), T is the absolute temperature (K), f(α) is the reaction model and β is the heating rate (dT/dt).
In the present investigation, both the thermal curing of BMIM/nano silica blends and the thermal degradation kinetics of BMIM/silica nano composites were evaluated by three iso-conversional model-free methods: Kissinger-Akahira-Sunose method, Flynn-Wall-Ozawa method and Friedman method. All these three methods do not require prior knowledge of the reaction mechanism to quantify the kinetic parameters. Since every kinetic method has different error, the use of more than one method can give a range of values for the activation energy at very particular value of α [12].

Kissinger-Akahira-Sunose (KAS) Method

This method is based on the expression [13, 14]   


ln (β/T2) = ln(AR/Ea)-Ea /RT          (3)


The plot of ln(β/T2) vs 1/T gives straight line and the slope of this line equals -Ea/R by which the activation energy has been calculated.

Flynn-Wall-Ozawa (FWO) Method

Flynn-Wall-Ozawa [15-17] method is an iso-conversional integral method. This method involves the measurement of the temperature T, corresponding to a fixed value of degree of conversion α, from the experiments at different heating rates, β. The FWO method uses Doyle’s approximation and the equation is given as

log β =0.457(-Ea/RT) + [log(A Ea/R) – log f(α) – 2.315]          (4)

The plot of log β vs1/T gives a straight line and its slope equals -0.457 Ea/R by which the activation energy has been calculated. If the determined Ea is the same for the various values of α, the existence of a single step reaction can be concluded with certainty.

Friedman (FRD) Method

The Friedman [18, 19] method is an iso-conversional differential method, which directly leads to (-Ea/R) for a given value of α by plotting the term ln(dα/dt) against 1/T. This method is based on the equation

ln(dα/dt) = ln(A f(α))-Ea/RT          (5)


Experimental

Materials

4,4’-Diaminodiphenylmethane was purchased from Himedia Pvt. Limited, Mumbai. Maleic anhydride and Stearic acid were supplied by s.d. fine chemicals Pvt. Ltd., Mumbai. Sodium acetate and acetone were obtained from Merck Specialist, Mumbai. Ethyl alcohol and 4-amino benzoic acid were purchased from Hayman Ltd., England and Central Drug House Pvt. Ltd., New Delhi respectively. 4, 4’-Diaminodiphenyl-methane, maleic anhydride, stearic acid (SA), ethyl alcohol and 4-amino benzoic acid were used as received.

Preparation of Bismaleimide (BMIM)

In a 250 mL round bottom flask, maleic anhydride (0.11 mol) was taken and dissolved in 150 mL of distilled acetone, and then diamine (0.05 mol) was added into the solution in portions. Bisamic acid gets precipitated. After the complete addition of the diamine, the precipitated bisamic acid was stirred for 30 min. Anhydrous sodium acetate (3.4 g) and acetic anhydride (40 mL) were added to the resultant slurry and was refluxed for a period of 3 h.  The resulting reddish yellow solution was poured into large quantities of crushed ice and the precipitated yellow bismaleimide was collected by filtration and washed with large quantities of ice water. The yield was around 90%.

989594-fig-1
Scheme 1: Preparation of Bismaleimide (BMIM)

Preparation of Rice Husk Ash (RHA):

Rice husk ash (RHA) was prepared by heating the rice husk in a muffle furnace from 100 to 800 °C by increasing 50 °C for every 15 min. The resulting particles were then crushed to give fine powder. The rice husk ash prepared in this way was found to contain 97 % of Silica.

Extraction of pure silica (RH):

A sample of 20g of RHA was stirred in 160 mL, 2.5N NaOH solution. The solution was heated in a covered beaker for 3h by stirring constantly and filtered; the residue was then washed with 40 mL of boiling distilled water. The obtained viscous, transparent and colorless solution was allowed to cool to room temperature and 5N H2SO4 was then added under constant stirring at controlled conditions until it reached pH 2. To this, NH4OH was added and the pH was adjusted to 8.5 and was allowed to stand at room temperature for 3h [20 – 22]. The precipitate was filtered and washed with large quantities of distilled water and the material was press dried. The product was dried in an air oven kept at 60 °C for 24 h.

Preparation of Nanosilica Powder from Pure Silica (NS):

Pure silica was extracted by refluxing with 6N HCl for 4h and then washed repeatedly using deionized water to make it acid free. Extracted silica was then dissolved in 2N NaOH by continuous stirring for 10 h on a magnetic stirrer and then concentrated H2SO4 was added to adjust pH to 7.5-8.5. The precipitated silica was washed repeatedly with warm deionized water. The washing process was continued using deionized water till the washings were free from alkali. The material was filtered and dried at 50 ºC for 48h in an air oven [20 – 22].

Organic Modification of Nanosilica Particles by Stearic Acid (NSOM):

To modify the NS particles, 200 mL of n-hexane and 3 g of NS particles were mixed in a three neck round bottom flask equipped with a condenser, thermometer and stirrer, and then 1.4 g of stearic acid was added into the solution. The mixture was heated under vigorous stirring at 60 °C for 4 h. The solution was then filtered and the precipitate was washed thoroughly with 30 % ethanol in deionised water. The precipitate was dried in vacuum at 110°C for 10 h. The white powder was identified as the SA modified nanosilica particles (NSOM).

989594-fig-2
Scheme 2: Preparation of NSOM particles

Chemical Modification of Nanosilica Particles by N-[4-(chlorocarbonyl) Phenyl] Maleimide (NSCM):

Chemical modification of NS by Cl-CPMI involves the following steps:

Preparation of N-(carboxy phenyl) Maleimide (p-CPMI):

In a three neck round bottom flask equipped with a condenser, mechanical stirrer and a thermometer, solution of 4-amino benzoic acid (82.2 g) in acetone (1000 mL) was placed and maleic anhydride (58.8 g) in acetone (200 mL) was added at 10 °C over a period of 30 min. The reaction mixture was stirred for an additional 30 min at 10 °C, and yellowish green precipitate was purified by recrystallization using 50:50 v/v mixture of dimethylformamide and ethanol to yield pure 4-carboxyphenylmaleamic acid.

To slurry of 4-carboxyphenylmaleamic acid (11.8 g) in distilled acetone, acetic anhydride (20.4 g) and anhydrous sodium acetate (2 g) were added and gradually heated to reflux and allowed to react for 15 min. The final reaction mixture was cooled to ambient temperature and poured into ice water to obtain fine pale yellow precipitate. This precipitate was recrystallised using ethyl acetate/n-hexane 50/50 wt/wt solution and the product vacuum dried.

Preparation of N-[4-(chlorocarbonyl) phenyl] Maleimide (Cl-CPMI)

A mixture of p-CPMI (35.5 g, 0.16 mol),  thionyl chloride (400 g, 4.02 mol) and t-butyl catechol (0.01 g) was refluxed for 2 h. Unreacted thionyl chloride was distilled off and then the residual product was recrystallised from benzene to obtain 28 g of pure Cl-CPMI. (Yield: 73.3 %; m.p.: 168-169 °C).

Preparation of NSCM Particles

The procedure used for the preparation of NSOM particles was used to prepare NSCM particles where instead of stearic acid, Cl-CPMI was used (Scheme 3). After completion of the reaction, the unreacted Cl-CPMI was removed by repeatedly washing the precipitate with distilled acetone. The precipitate was dried in a vacuum at 110 °C for 10 h. The white powder was identified as Cl-CPMI modified nanosilica particle NSCM

989594-fig-3
Preparation of BMIM/nanosilica Nanocomposites:

BMIM/nanosilica blends were prepared by the method shown in Scheme 4. 
989594-fig-4
Scheme 4: Preparation of BMIM/nanosilica nanocomposite

The bismaleimide (BMIM) and its nanosilica blends (BMIMN1, BMIMN2, and BMIMN3) were thermally cured at 250 °C for 12 h. The cured materials of BMIM, BMIMN1, BMIMN2 and BMIMN3 were labeled as CBM, CBMN1, CBMN2 and CBMN3, respectively.

Methods

The FTIR spectra of the NS, NSOM and NSCM particles and BMIM/nanosilica nanocomposites were recorded in a Shimadzu IRAffinity-1 spectrophotometer using KBr pellet technique. Differential scanning calorimetric analysis was carried out using a DSC 4000 analyzer. Samples (2.5 mg) were placed in aluminum pan and were heated from 50 to 350 °C. The results were recorded using different heating rates (10, 20 and 30°C/min). All the measurements were carried out in nitrogen atmosphere by using a gas flow rate of 25 mL /min. Thermo gravimetric analysis was carried out using a TGA Q5000 V3 analyzer. Samples (2.5 mg) were placed in platinum pan and were heated from 50 to 850 °C. The thermograms were recorded using different heating rates (10, 20 and 30 °C/min). All the measurements were carried out in dry oxygen-free-nitrogen atmosphere by using a gas flow rate of 25 mL /min.

Results and Discussion

FTIR Study

Characterization of the NS, NSOM and NSCM Particles

The characteristic groups on the surface of the nanosilica particles before and after modification by SA and Cl-CPMI were identified by FTIR spectra (Fig. 1). The appearance of two peaks at 1103 and 833 cm-1 is characteristic of Si-O-Si units which are present in NS, NSOM and NSCM particles. The characteristic peak of —COOH of SA at 1729 cm-1 is not observed in NSOM, instead the peaks at 1627 and 787 cm-1 corresponding to the asymmetric stretching of carboxylate and the rocking of the long alkyl chain are noted. Furthermore, the peaks at 2924 and 2846 cm-1 are also found in the spectra of the NSOM particle for the absorption of —CH2— asymmetrical stretching and symmetrical stretching, respectively. It indicates that the SA has successfully modified the surface of the NS particles by the reaction of the SiO2—OH groups with stearic acid via esterification. For NSCM, the peak at 1628 cm-1 corresponding to the asymmetric stretching of carboxylate indicates the successful chemical modification carried out by ClPMI on NS. In all NS, NSOM and NSCM particles the broad band between 3300 and 3400 cm-1 is due to silanol OH groups [12].

989594-fig-5
Figure 1: FTIR spectra of NS, NSOM and NSCM particles

Characterization of BMIM/Nanosilica Nanocomposites

The characteristic peaks of BMIM are observed at 1726cm-1  for C=O, 1173 cm-1 and 1390 cm-1 for  C—N—C, 1512 cm-1 for double bond of benzene ring, 1702 cm-1 for cyclic imide ring and  1635 cm-1 for C=C (imide part). For the BMIM/nanosilica nanocomposites, the corresponding characteristic absorption peaks of the BMIM matrix and the Si—O—Si (1103 and 833cm-1) are observed as expected (Fig. 2A). The characteristic absorption peaks of the SA and ClCPMI moiety are not clearly observed. This is because the intensities of the characteristic absorption peaks of the SA and ClCPMI moiety concentrations are too low because of the low SA, ClCPMI content in the BMIM/nanosilica nanocomposites and some of the peaks overlap with the characteristic absorptions of BMIM matrix.

In the cured BMIM and BMIM/nanosilica nanocomposites (Fig. 2B), the complete disappearance of C=C peak at 1635 cm-1  (imide part) and appearance of aliphatic C-H peak at 2931 cm-1  indicate that the curing process is completed. Again the incorporation of NS, NSOM and NSCM particles are also confirmed by the appearance of broad band between 3100 — 3600 cm-1 due to the presence of silanol—OH group in the CBMN1, CBMIN2 and CBMN3.

989594-fig-6
Figure 2: FTIR spectra of pure Bismaleimide and its nanosilica belnds and thermally cured nanosilica nanocomposites

XRD Analysis

The x-ray diffraction curves are presented in Fig. 3. The particle size of NS, NSOM and NSCM are calculated using Debye-Scherrer formula [23].

D=0.9λ / W Cosθ                               (6)
The particle sizes of NS, NSOM and NSCM are found to be 2, 10 and 10 nm, respectively. Due to the incorporation of organic and inorganic modifiers into the nanosilica particle surface, the particle size of NSOM and NSCM get increased.
989594-fig-7
Figure 3: XRD analysis of NS, NSOM and NSCM particles

SEM Analysis

The SEM photographs of NS, NSOM and NSCM particles are shown in Fig. 4.  It is found that NS are present in a loose form. Dense agglomerate structures with larger size are found for the NSOM and NSCM particles. This is ascribed to the interaction among the functional groups of the SA and Cl-CPMI modified silica surfaces [11].  According to the SEM photographs, the particles sizes of NS, NSOM and NSCM are found to be 7, 14 and 15 nm, respectively [20-22].

989594-fig-8
Figure 4: SEM Images Of A) Ns B) Nsom C)Nscm Particles

The surface morphology of the thermally cured BMIM and its nanosilica nanocomposites were studied using scanning electron microscope and the SEM images are shown in Fig. 5. The rough surface shown in the SEM image of thermally cured pure BMIM (CBM) reveals that some voids are formed during polymerization (Fig. 5A). The SEM photograph of CBMN1 shows smooth surface indicating the uniform dispersion of NS particles in the BMIM matrix. But in the case of CBMN2 and CBMN3, the surfaces were significantly different from that of CBM. The surfaces were broken into small and rough fractured pieces or strips, contributing to improvement in the toughness of the nanocomposites [24].
 
 
989594-fig-9
Figure 5: SEM images of cured BMIM and its nanosilica nanocomposites
 
A) CBM B) CBMN1 C) CBMN2 D) CBMN3

DSC Studies

The DSC curves of pure BMIM recorded at multiple heating rates (β=10, 20 and 30ºC/ min) and the DSC curves of BMIM and its nanosilica blends recorded at a heating rate of  20 ºC/min are shown in Fig. 6A and 6B, respectively. The values obtained from the DSC curves such as melting point (Tm), enthalpy of curing (ΔHc) and curing temperatures at a heating rate of  20 ºC/min for BMIM and its nanosilica blends are tabulated in Table 1.
989594-fig-10
Figure 6: DSC curves of pure BMIM and its nanosilica blends. A) Pure BMIM at   different heating rates. B) Pure BMIM and it nanosilica blends at a heating rate of 20 ºC/ min

Table 1: DSC studies: BMIM and its nanosilica blends
989594-tab-1
(heating rate = 20ºC /min)

From Fig. 6 it is clear that BMIM showed Tm at 155ºC. The onset of curing was noted around 197ºC, curing attained a maximum at 269ºC and ended at 344ºC. The enthalpy of curing was 243 J/g. The introduction of organically and chemically modified nanosilica particles led to the decrease in the intensity of melting peak. The addition of nanosilica particles into the BMIM resin system lowers the melting point, curing onset, maximum and endset temperatures as well as the enthalpy of curing values. This demonstrates the catalytic activity of nanosilica particles on the crosslinking reaction of the BMIM resin system [25]. The onset curing temperature for BMIMN1, BMIMN2 and BMIMN3 are 186, 183 and 191 ºC, respectively. The incorporation of NS, NSOM and NSCM particles into the BMIM resin system shifted not only the curing onset temperature but also the curing maximum temperature to the lower temperature region i.e. 267, 247 and 249 ºC, respectively, which strongly confirms the influence of nanosilica particles on the polymerization reaction i.e. on the olefinic bond present in the maleimide part of BMIM which led to crosslinking [26]. A single exothermic peak is observed in all the BMIM nanosilica blends and it indicates the homogeneous mixing of nanosilica particles in BMIM matrix system [27].

The ΔHc value of BMIM i.e. 243 J/g get decreased by the incorporation of NS, NSOM and NSCM to 99, 143 and 125 J/g, respectively. The decrease in the heat of curing for the nanosilica blends compared to the neat BMIM may also be the indication of the reduction in the degree of crystallinity [25]. Ghaemy et al. [28] studied the effect of nanosilica on the kinetics of cure reaction of epoxy resin. The exothermic peak temperature for diglycidylether of bisphenol-A based epoxy/3,5-diamino-N-(4-(quinolin-8-yloxy)phenyl)benzamide (DGEBA/DQPB) system containing 10% of NS shifted towards lower temperature in comparison with the Tg of DGEBA/DQPB system. This decrease is attributed to the increased rate of cure reaction. The exothermic heat of the samples containing NS is lower than the exothermic heat of the samples without the NS. This can be suggested to be due to the absorption of some of the exothermic heat of cure reaction by the nanosilica particles. In the BMIM the decrease in Ts, Tmax and TE may be due to the increased rate of cure reaction by the incorporation of NS and modified NS particles. Since the NS, NSOM and NSCM particles have the capability to absorb some of the exothermic heat of cure reaction; this led to the drastic decrease in the ΔHc values for the BMIMN1, BMIMN2 and BMIMN3 materials.

Cure Kinetic Studies

The kinetics of polymerization of pure BMIM and its nanosilica blends were studied using three different isoconversional methods KAS, FWO and FRD.

989594-fig-11
Figure 7: DSC studies: KAS, FWO and FRD plots of BMIM and BMIMN2

The apparent activation energy calculated by KAS and FWO methods are  same, but the values obtained by the FRD methods differ from other two methods. This pattern is shown in the Fig. 7. This is due to the way in which the activation energy was calculated i.e. KAS and FWO method are integral methods and FRD is differential method [29]. The plots between apparent activation energy for curing (Ea) and the reaction extent (α) values for all the blends by KAS methods are shown in Fig. 8 and the values for all the materials investigated by these three kinetic methods are tabulated in Table 2.
989594-fig-12
Figure 8.  DSC studies: Activation energies calculated using KAS method for different conversions of BMIM and its nanosilica blends

Table  2:  Apparent activation energies for the curing of bismaleimide and its nanosilica blends
989594-tab-2
As the curing process proceeds, the system undergoes gelation (liquid-to-rubber) and vitrification (rubber-to-glass) transitions. At the glassy state, the small amount of free volume only allows local motions of the chain segments. To initiate the translational motion of the segments, it requires a great degree of cooperativity between chain segments, which is associated with a large energy barrier as reflected in the great value of  Ea, so when the system vitrifies, the value of Ea begins to increase [26, 30, 31].

In the present work, the activation energies for the curing of BMIM were observed to increase with the increase in extent of reaction (α = 0.2 to 0.8). At the initial stage, more number of monomers was available for polymerization, so that BMIM require low energy at this stage. As the reaction precedes, the viscosity of the medium increases, availability of monomers for polymerization process gets reduced. This situation makes the polymerization i.e. cross linking of monomers as a difficult one and the activation energy value gets increased gradually. After α = 0.55, Ea increases more steeply, due to addition reactions between oligomers and the gelation process takes place. In the gelled state, the previously formed longer chains are branched together by further cycloaddition reactions leading to three dimensionally cross linked material. At nearing the end of the polymerization reaction, the rate of cross linking is limited by the mobility of longer polymer chains and diffusion encounters a large energy barrier, leading to higher Ea values [32].

The material BMIMN1 shows similar trend as that of BMIM, but the Ea values are in the higher region than BMIM. The activation energy for BMIMN1 is approximately 60 KJ/mol more than that of BMIM. This kind of trend is followed in the case of bismaleimidodiphenylmethane/o,o’-diallyl bisphenol A (BMPM/DABA) resin system [33]. In the case of BMPM/DABA, diallyl bisphenol A (DABA) react with BMPM to give linear chain extension by an ene type reaction and this is followed by a Diels-Alder reaction at higher temperature. The reaction is complex and leads to the formation of succinimide groups from the polymerizing maleimide moieties. As a result the activation energy gets steadily increased.

The higher activation energy value for BMIMN1 may be due to the presence of nanosilica particles that can restrict the polymerization. In the BMIMN1 system, in the initial stage the nanosilica particles tend to reduce the viscosity of the medium, but their interaction with BMIM matrix become stronger which in turn restrict the mobility of resin system. As a result, activation energy gets increased at the initial stage. After 0.60 reaction extent value, movement of segments is more and more restricted due to the crosslinking reactions as well as the nanoSiO2¬ particles block the movement of molecular segments. Therefore, the segments need more energy to rearrange and results in an increase in the apparent activation energy [34].

For BMIMN2 system also the activation energy values are higher than that of BMIM, but the trend is different from that of BMIMN1. Initially, the Ea values are high but the Ea value gets decreased slowly as the reaction proceeds. After 0.45 reaction extent value, it becomes almost constant. The DSC study confers the catalytic activity exhibited by NSOM which can accelerate the curing process. The long alkyl chains present in the NSOM particles have some weak interactions with the BMIM at the initial stage and led to higher activation energy, but the catalytic activity exhibited by NSOM accelerates the rate of the cure reaction. As a result the activation energy values get decreased as the curing reaction proceeds.

BMIMN3 system also shows the similar trend as that of BMIMN2 but the activation energy values are lower than that of BMIM after 0.50 reaction extent value. At the initial stage, the Ea values are higher and get decreased sharply as the reaction proceeds. NSCM particles contain the maleimide moieties which itself can undergo polymerization process supporting the polymerization process to proceed in a better way. The DSC study proves the catalytic activity exhibited by NSCM which enhance movement of molecular segments without any interruption. Since the mobility of molecular segments is easier one, this needs lower activation energy. Due to these reasons the BMIMN3 has activation energies in the lower region than that of BMIM. 

In our previous study, all the matrix systems that are dispersed with silica (RH), organically (RHOM) and chemically modified (RHCM) silica particles have activation energy values in the higher region [35], but when they are converted into nanoparticles, NS has the same influence as that of RH particle, but the NSOM and NSCM particles in their nanometer size, exhibit the catalytic activity. Because of this catalytic activity, the curing behaviors as well as the activation energy value trend get changed.

TG Studies

The TG and DTG curves for thermally cured BMIM and its nanosilica nanocomposites recorded at 20 ºC/min in N2 atmosphere are shown in Fig. 9A. The TG and DTG traces of CBM at multiple heating rates (10, 20, 30 ºC/min) in N2 atmosphere are shown in the Fig. 9B. All the thermograms are shifted to higher temperatures with increasing heating rates. The TG parameters noted at 20 ºC/min was tabulated in Table 3. Poly BMIM (CBM) and its three composites (CBMN1, CBMN2 and CBMN3) are stable up to around 375 ºC which suggests that all the four samples have excellent thermal stability.

989594-fig-13
Figure 9: TG curves of pure BMIM and its nanosilica blends. A) TG curve of pure BMIM at different heating rates. B) DTG curve of pure BMIM at different heating rates C)TG curves pure BMIM and it nanosilica blends at a heating rate of 20 ºC/min D) DTG curves pure BMIM and it nanosilica blends at a heating rate of 20 ºC/ min

Table 3: Degradation parameters of BMIM and its nanosilica nanocomposites (heating rate = 20 °C/min)
989594-tab-3
Thermal degradation of CBM starts at 435 ºC, attains maximum at 482 ºC and ends at 508 ºC in the 20 ºC/min heating rate. Incorporation of organically and chemically modified nanosilica particles into the CBM decreases the onset degradation temperature by 39 and 35 ºC, respectively. Nanosilica particles have some influence on the onset degradation temperature that is indicated by the increase of 10 ºC in CBMN1. The maximum peak temperature for all the three composites gets decreased by 22, 60 and 58 ºC for CBMN1, CBMN2 and CBMN3 respectively. When the 2,2-bis[4-(4-maleimidophenoxy phenyl)]propane (BMIX) matrix system was blended with different percentages of cloisite 15a nanoclay, at higher loading the onset degradation temperature  decreases nearly 32, 21, 47 and 52 ºC when compared to the pure polyBMIX. This decrease in onset degradation temperature may be due to the thermal degradation products liberated by clay particles catalyze the thermal degradation of polyBMIX[36]. In this investigation the variation in onset and maximum degradation temperatures is mainly due to the difference in the catalytic activity induced by the thermal degradation products liberated by nanosilica and modified nanosilica particles on the thermal degradation of polyBMIM [22, 24, 33]. The endset of degradation temperature increases nearly 102, 100 and 106 ºC by the incorporation of NS, NSOM and NSCM particles in BMIM respectively. Vijayakumar et al. [37] did the blending of natural clay with BMIM at three different ratios (1, 3 and 5%). Incorporation of 1% natural clay into the BMIM matrix decreases the onset temperature of initial degradation but higher loading of natural clay (3 and 5%) does not have any influence over the initial degradation temperature of BMIM. The clay loading from 1 to 5% into BMIM does not have any influence over the degradation maximum and the endset of this particular degradation stage. The char residues for CBM, CBMN1, CBMN2 and CBMN3 are 47, 52, 50 and 47%, respectively. This indicates that the incorporation of NS and modified NS particles in the BMIM matrix system slightly improves the char residue [31].

Degradation Kinetic Studies

The apparent activation energy for the degradation of thermally cured pure BMIM and its nanosilica nanocomposites were calculated using three isoconversional model free kinetic methods such as KAS, FWO, and FRD methods. The apparent activation energy values calculated for the degradation of cured samples by KAS and FWO methods are  same, but the values obtained by the FRD method differ from other two methods (Fig. 10). This is due to the way in which the activation energy was calculated, that is KAS and FWO methods are integral methods and FRD is differential method [29].

The plots between the apparent activation energy(Ea) and the reaction extent (α) values for all the samples investigated using KAS method are shown in Fig. 11.The apparent activation energy values for degradation obtained using KAS, FWO and FRD kinetic methods are tabulated in Table 4.
989594-fig-14
Figure 10: TG studies: KAS, FWO and FRD plots of CBM andCBMN2
 
 
989594-fig-15
Figure 11:  TG studies: Activation energies calculated using KAS method for different conversions of CBM and its nanosilica blends nanocomposites

Table 4:  Apparent activation energies for the degradation of bismaleimide and its nanosilica nanocomposites
989594-tab-4
The activation energy for the degradation of thermally cured pure BMIM (CBM) shows a slight decrease up to the reaction extent values 0.5, then a steep increase is noted up to the reaction extent value 0.6 and the activation energy decreases up to the reaction extent level 0.7 and further it increases.

Studies on the thermal degradation of poly N-arylmaleimide [38] using GC-MS technique reveal the major formation of carbon dioxide during thermal degradation of polyimide and the two mechanisms that account for the release of carbon dioxide are the imide-isoimide rearrangement and the formation of isocyanates from the polymer chains followed by dimerization of the isocyanate yield a carbodiimide and the release of carbon dioxide.  Natural clay is blended with 4,4’-bismaleimidodiphenyl methane in different ratios and the degradation kinetics for the initial degradation of the polyimides-clay composites was performed by Vijayakumar et al. [37]. In the initial degradation stage, the activation energy for the pure thermally cured bismaleimide slightly decreases (before the reaction extent of 0.6) and may be attributed to the liberation of CO and CO2 from the degrading polybismaleimide matrix. The progressively increasing activation energy after α = 0.6 may due to formation of sufficient amounts of aniline and phenyl isocyanate from degrading polyBMIM. Torrecillas et al. [39] studied the thermal pyrolysis products of polymerized bismaleimide, 4,4’-bismaleimidodiphenyl methane at 500, 600 and 700 °C  in air and 500 and 600 °C  in nitrogen using GC-MS technique. They found that the main substances formed are aniline and phenylisocyanate, which occur in the first phases of degradation (500 °C), whether under air or nitrogen and also they suggested the degradation mechanism for the formation of isocyanate derivatives from crosslinked polybismaleimides which releases CO, CO2 and H2O molecules.
 
The thermal properties of four different PMR (Polymerization of Monomeric Reactants) polyimides were studied using TG/FTIR/MS by Xie et al. [40]. They reported that carbon dioxide is the major compound released from the polyimides and it will release in two stages. The release of CO2 is detected before CO, which indicates that both CO and CO2 are the direct products from the decomposition of polyimides. The other major product obtained from the degradation of polyimides is phenyl isocyanates. The detection of benzonitrile by TGA-MS strongly confirmed the cleavage of carbonyl group in the imide rings. Finally they conclude that carbon monoxide is the direct degradation product from imide rings and carbon dioxide is produced through the further combination of CO with oxygen radicals during pyrolysis of hydrocarbon polymers. From the above results, one can conclude that during the thermal degradation of polybismaleimide, the major degradation product formed is amine and isocyanate of the corresponding polybismaleimide by the release of carbon monoxide and carbon dioxide.

So, the increase in the activation energy is due to the formation of aniline and phenylisocyanate during the degradation of polyBMIM. Before the reaction extent 0.6, reasonable amounts of CO and CO2 may be released from the degrading polymerized BMIM. Owing to the destruction of the imide rings and the presence of favorably structured degrading polyBMIM requires considerably less energy for degradation after α=0.6.  After the reaction extent value of 0.7, the degraded polyBMIM may form coke; it may form a surface layer of protective char for the degrading polyBMIM and restricts further degradation. So, the system needs more amount of energy for degradation, hence the activation energy for the system increases.

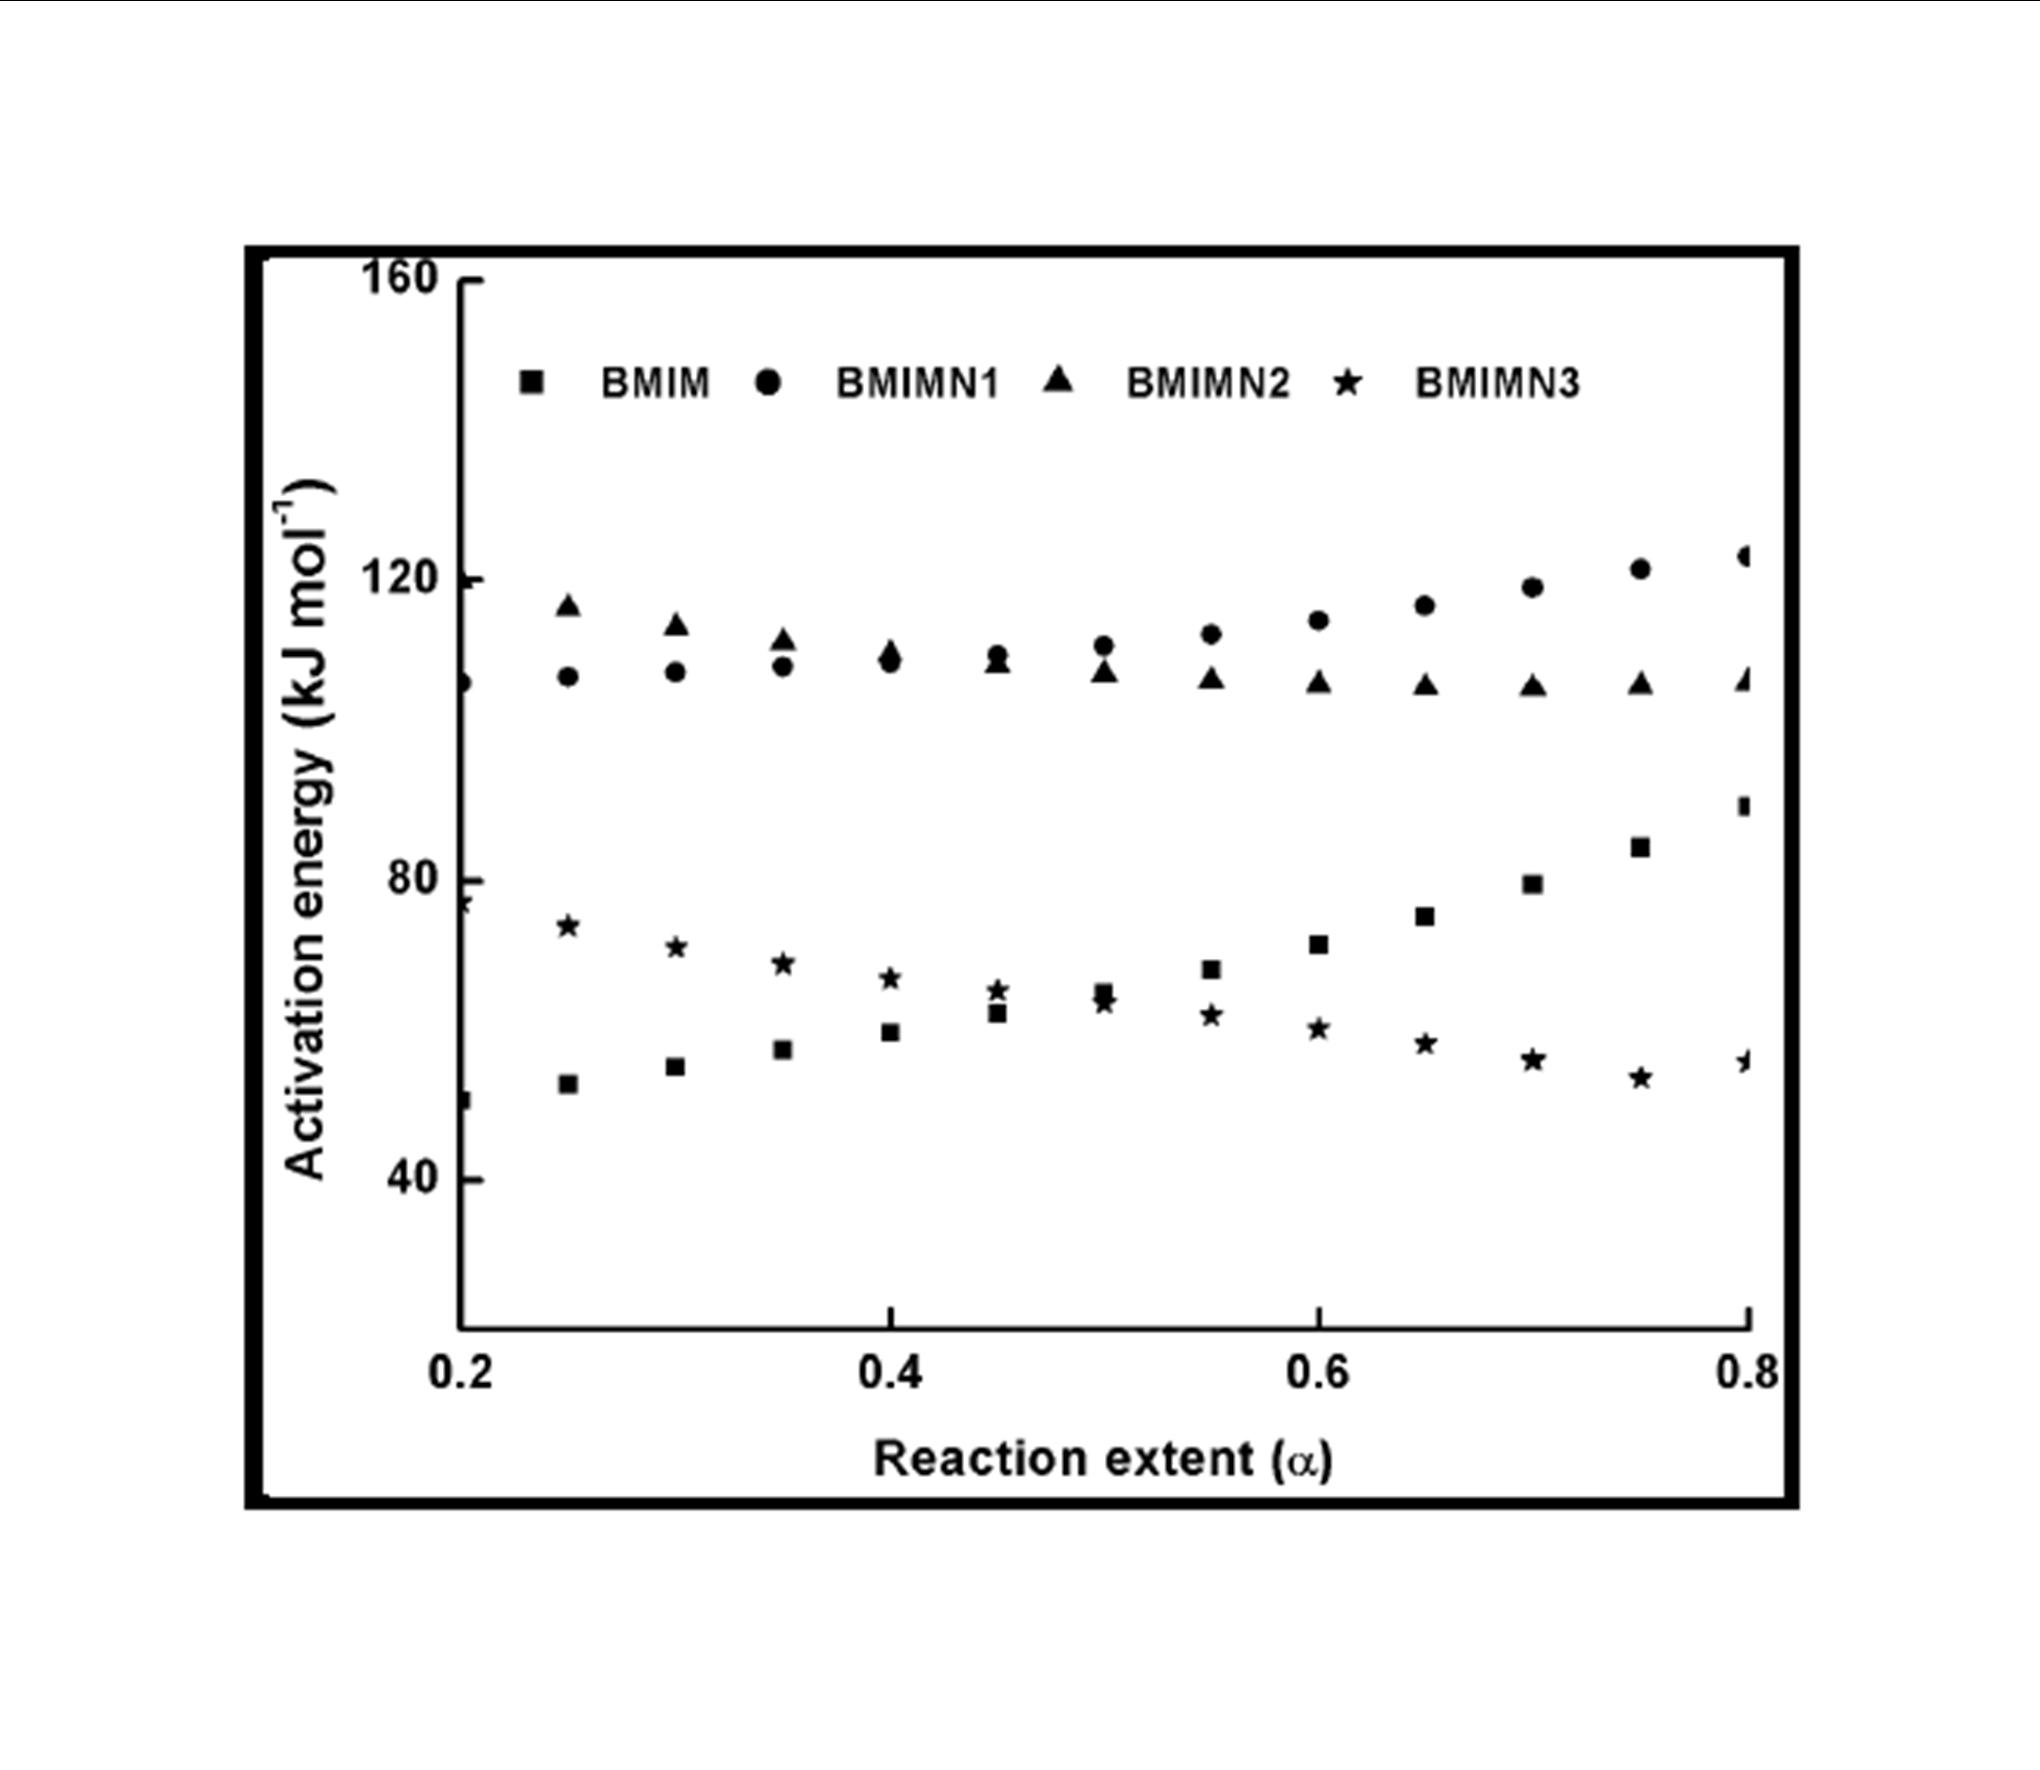
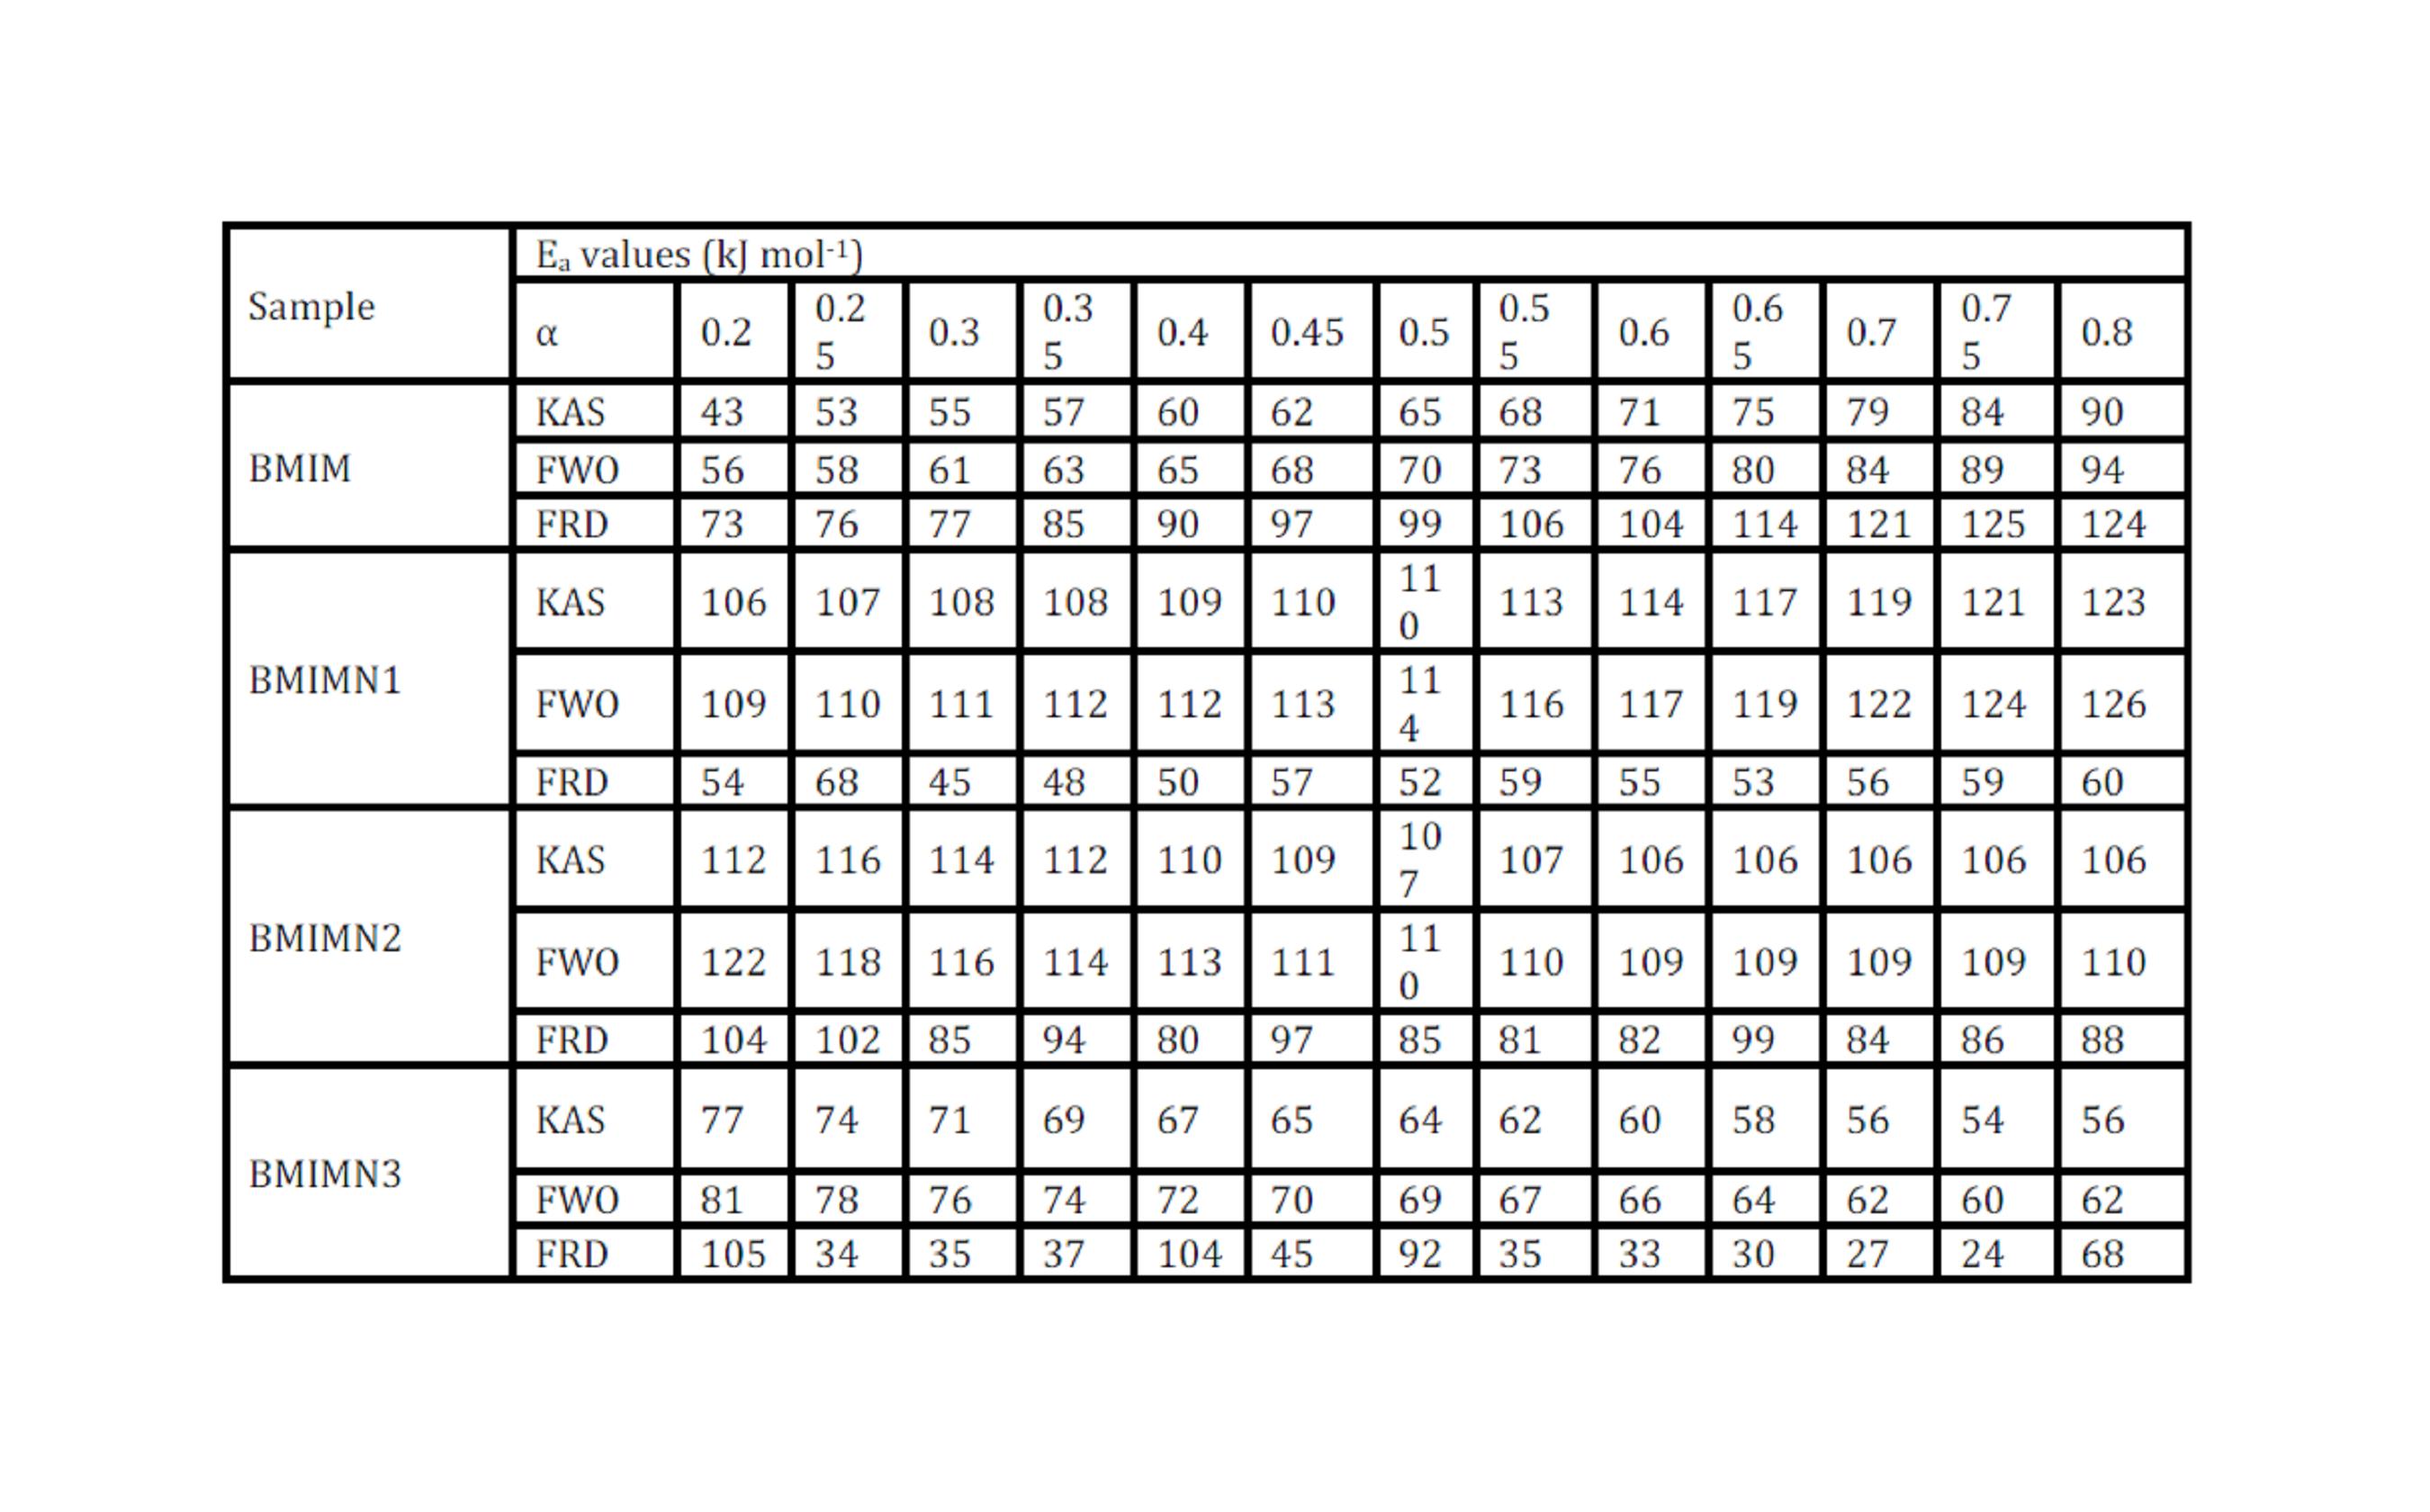
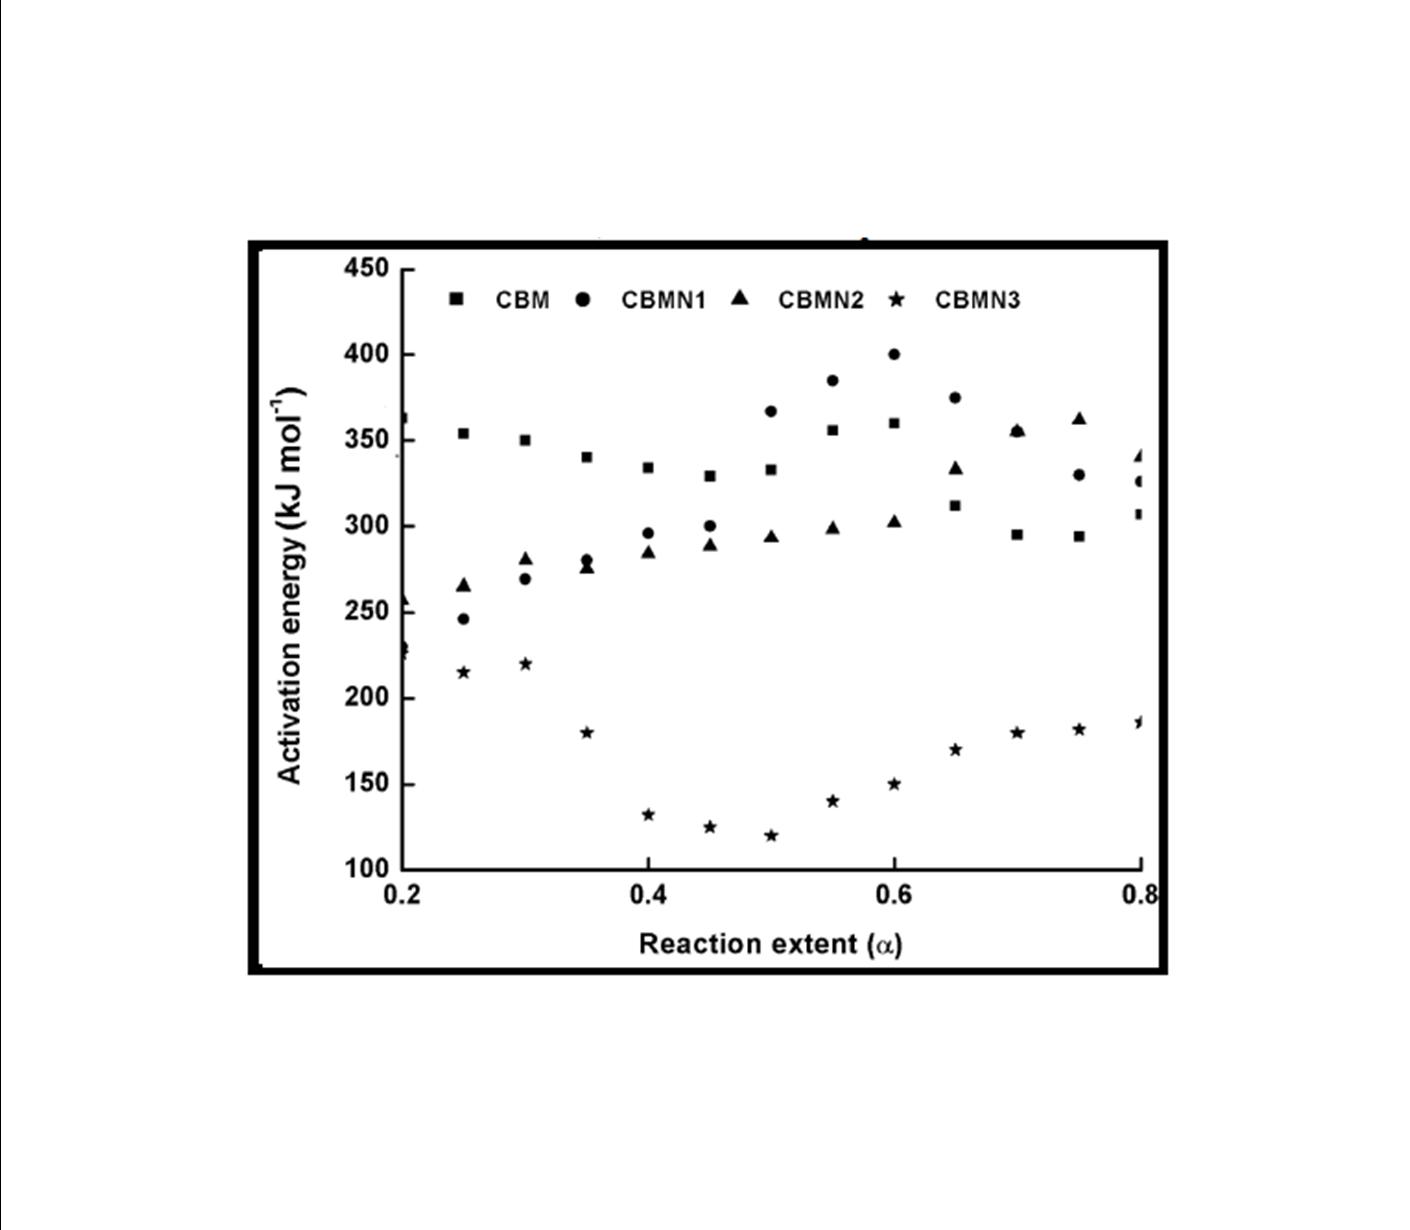
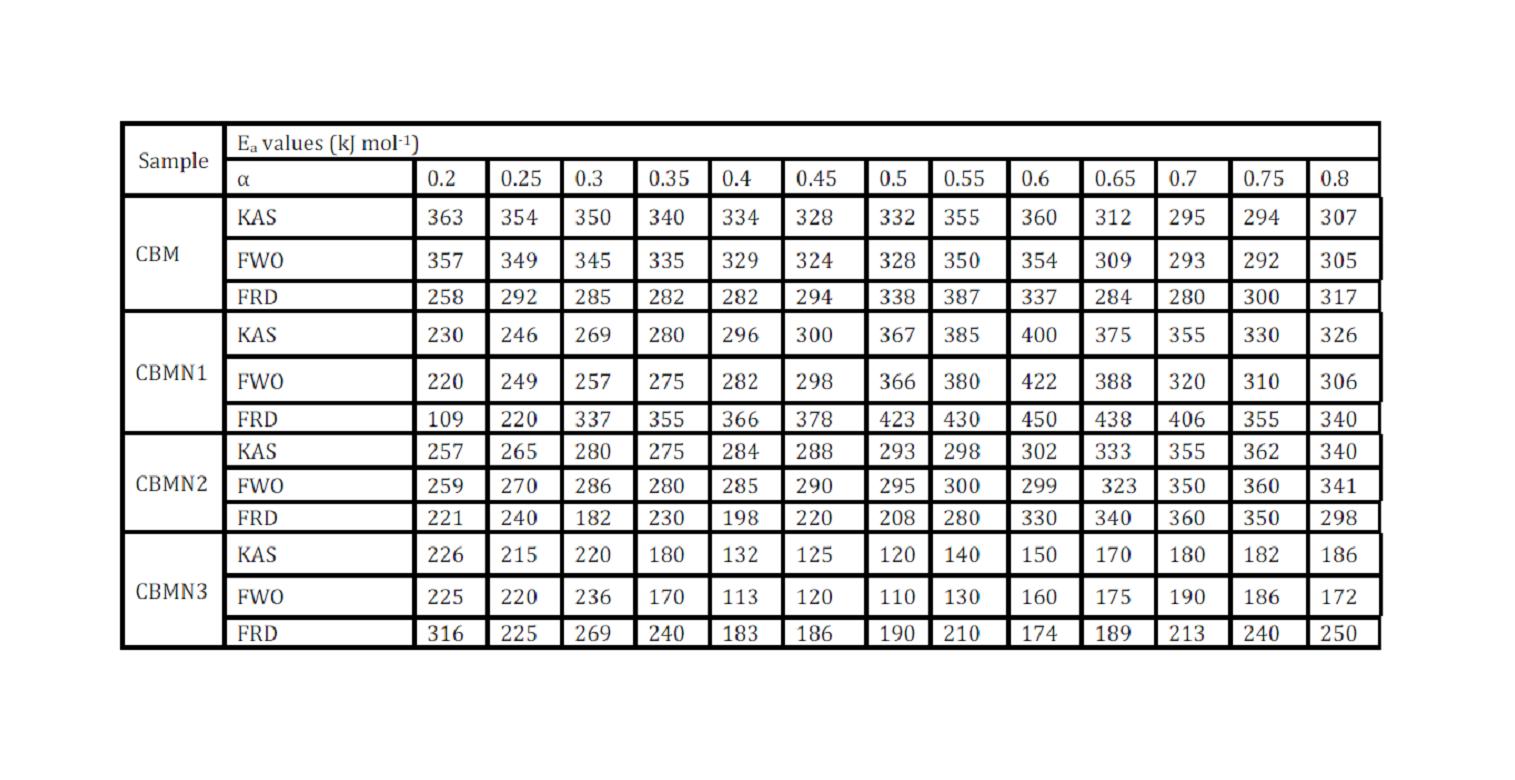
The trend in the activation energy variation noted for the degradation of the material CBMN1 is very similar to that of CBM but the activation energy at the initial stage is lower than the CBM but after α = 0.40, the activation energy value is 30-40 kJ mol-1  higher than CBM. At the initial stage the nanosilica particles may act as medium for thermal transport for the degrading material, thus requiring lower activation energy for degradation. The increase in activation energy value after α = 0.40 may be attributed to the shielding effect of nanoparticle in the evolution of formed gases from polymer matrix, during its thermal decomposition [41].

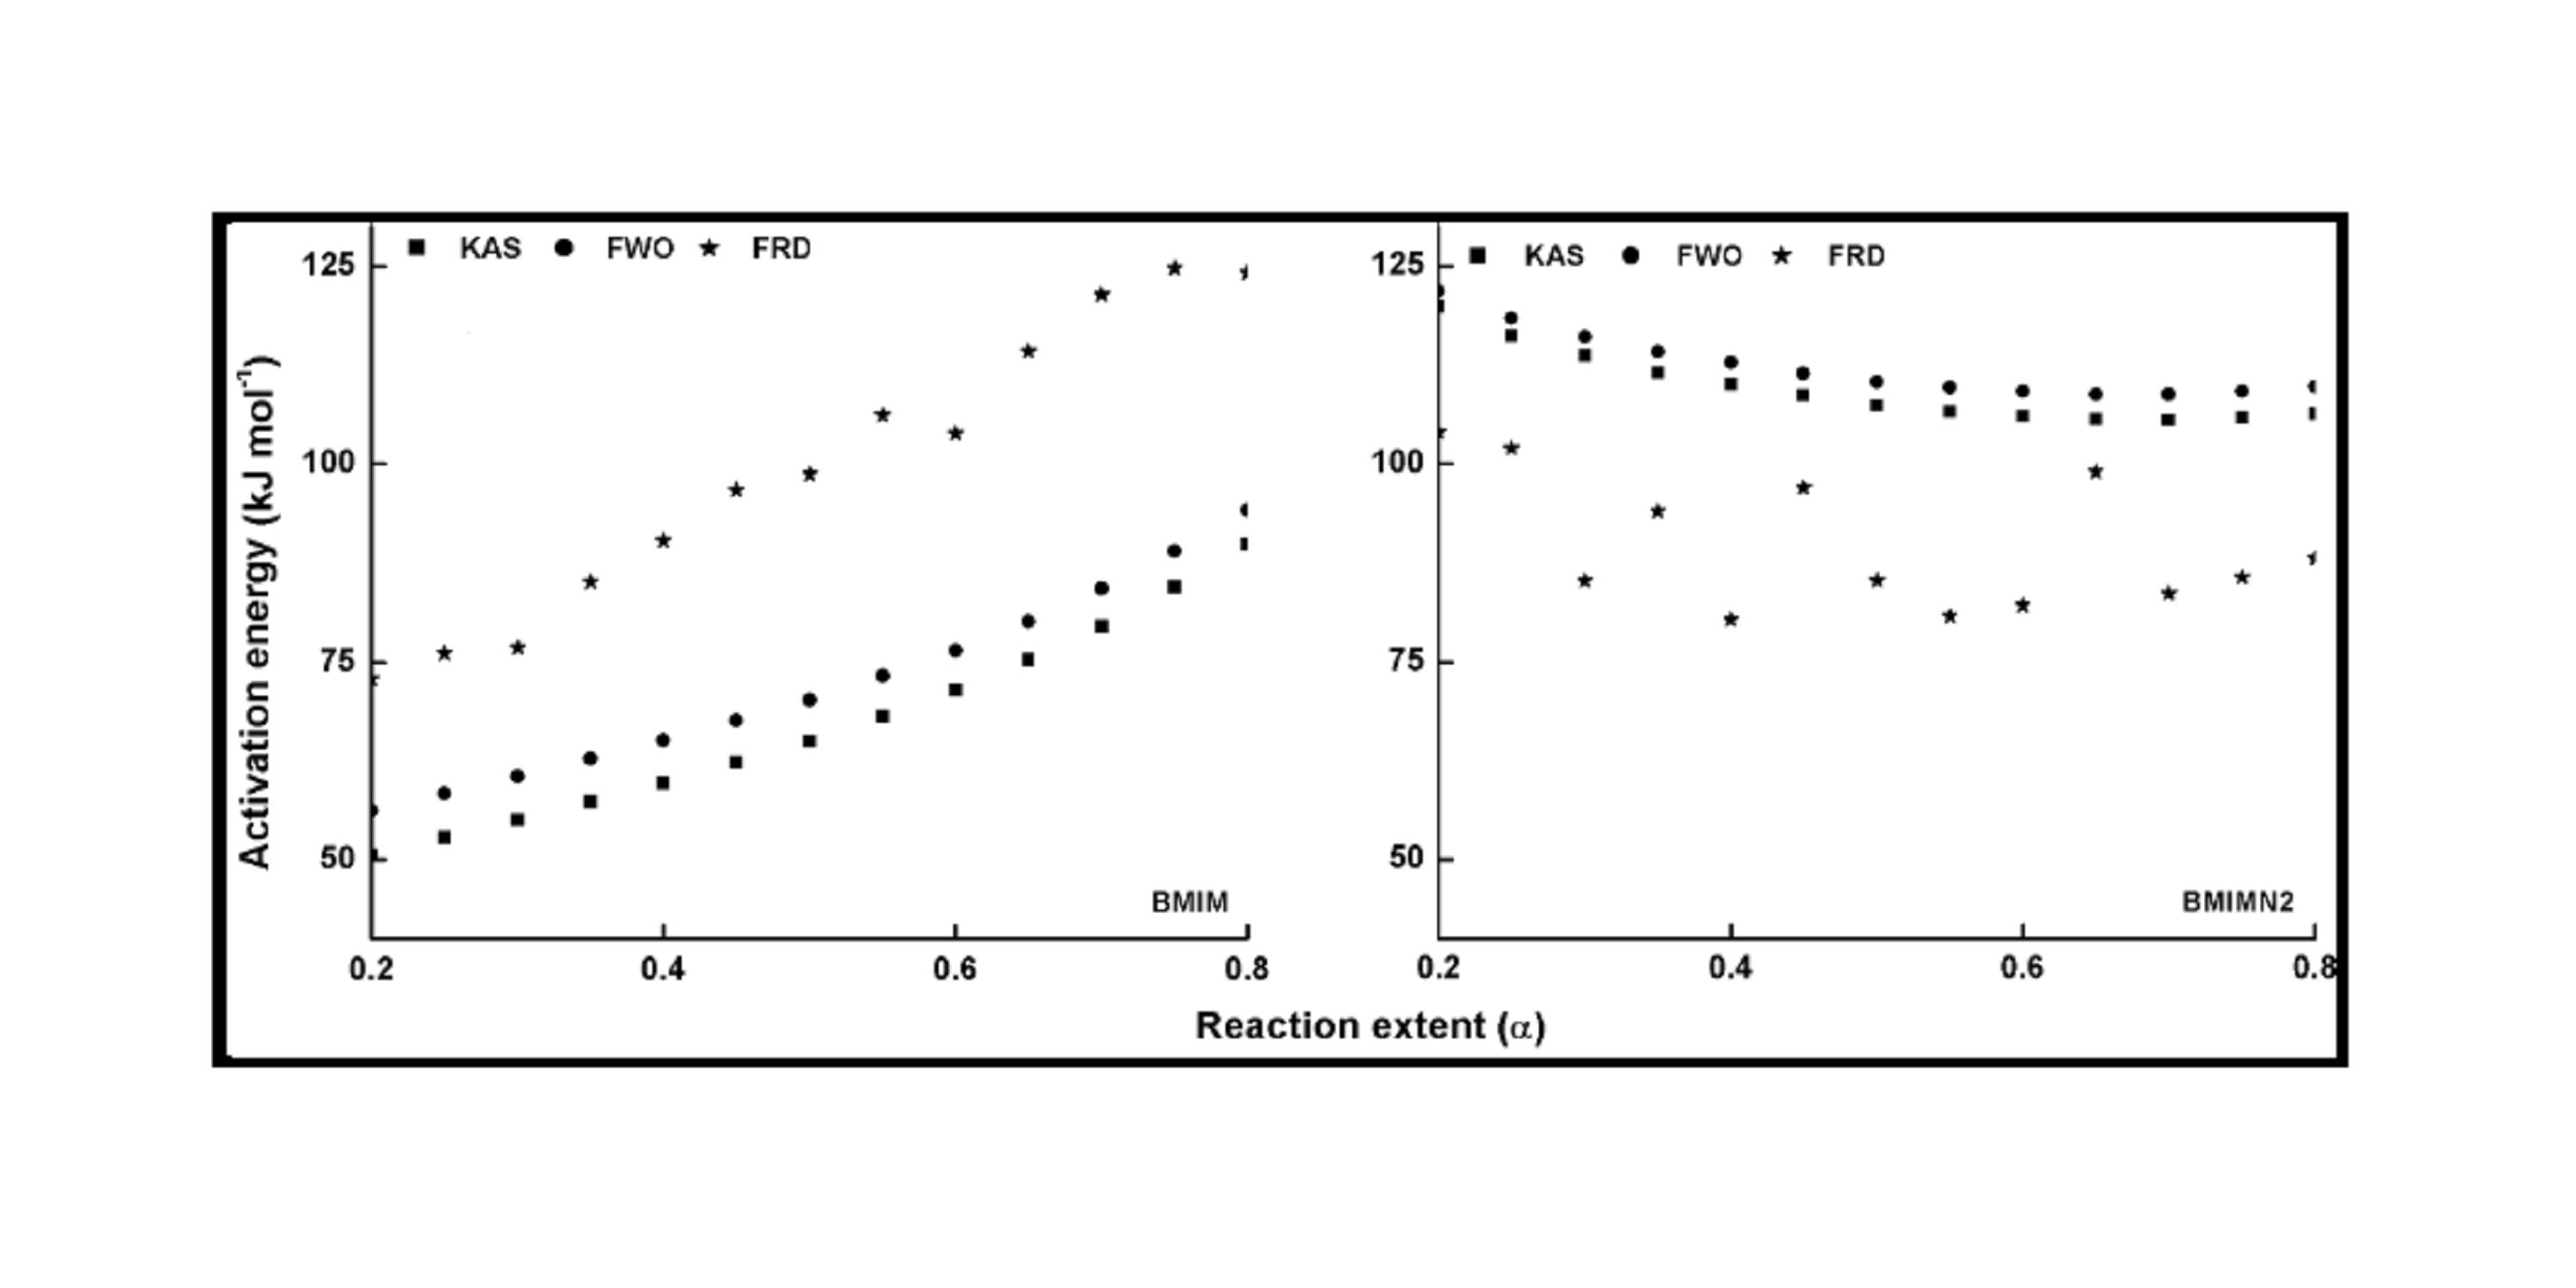
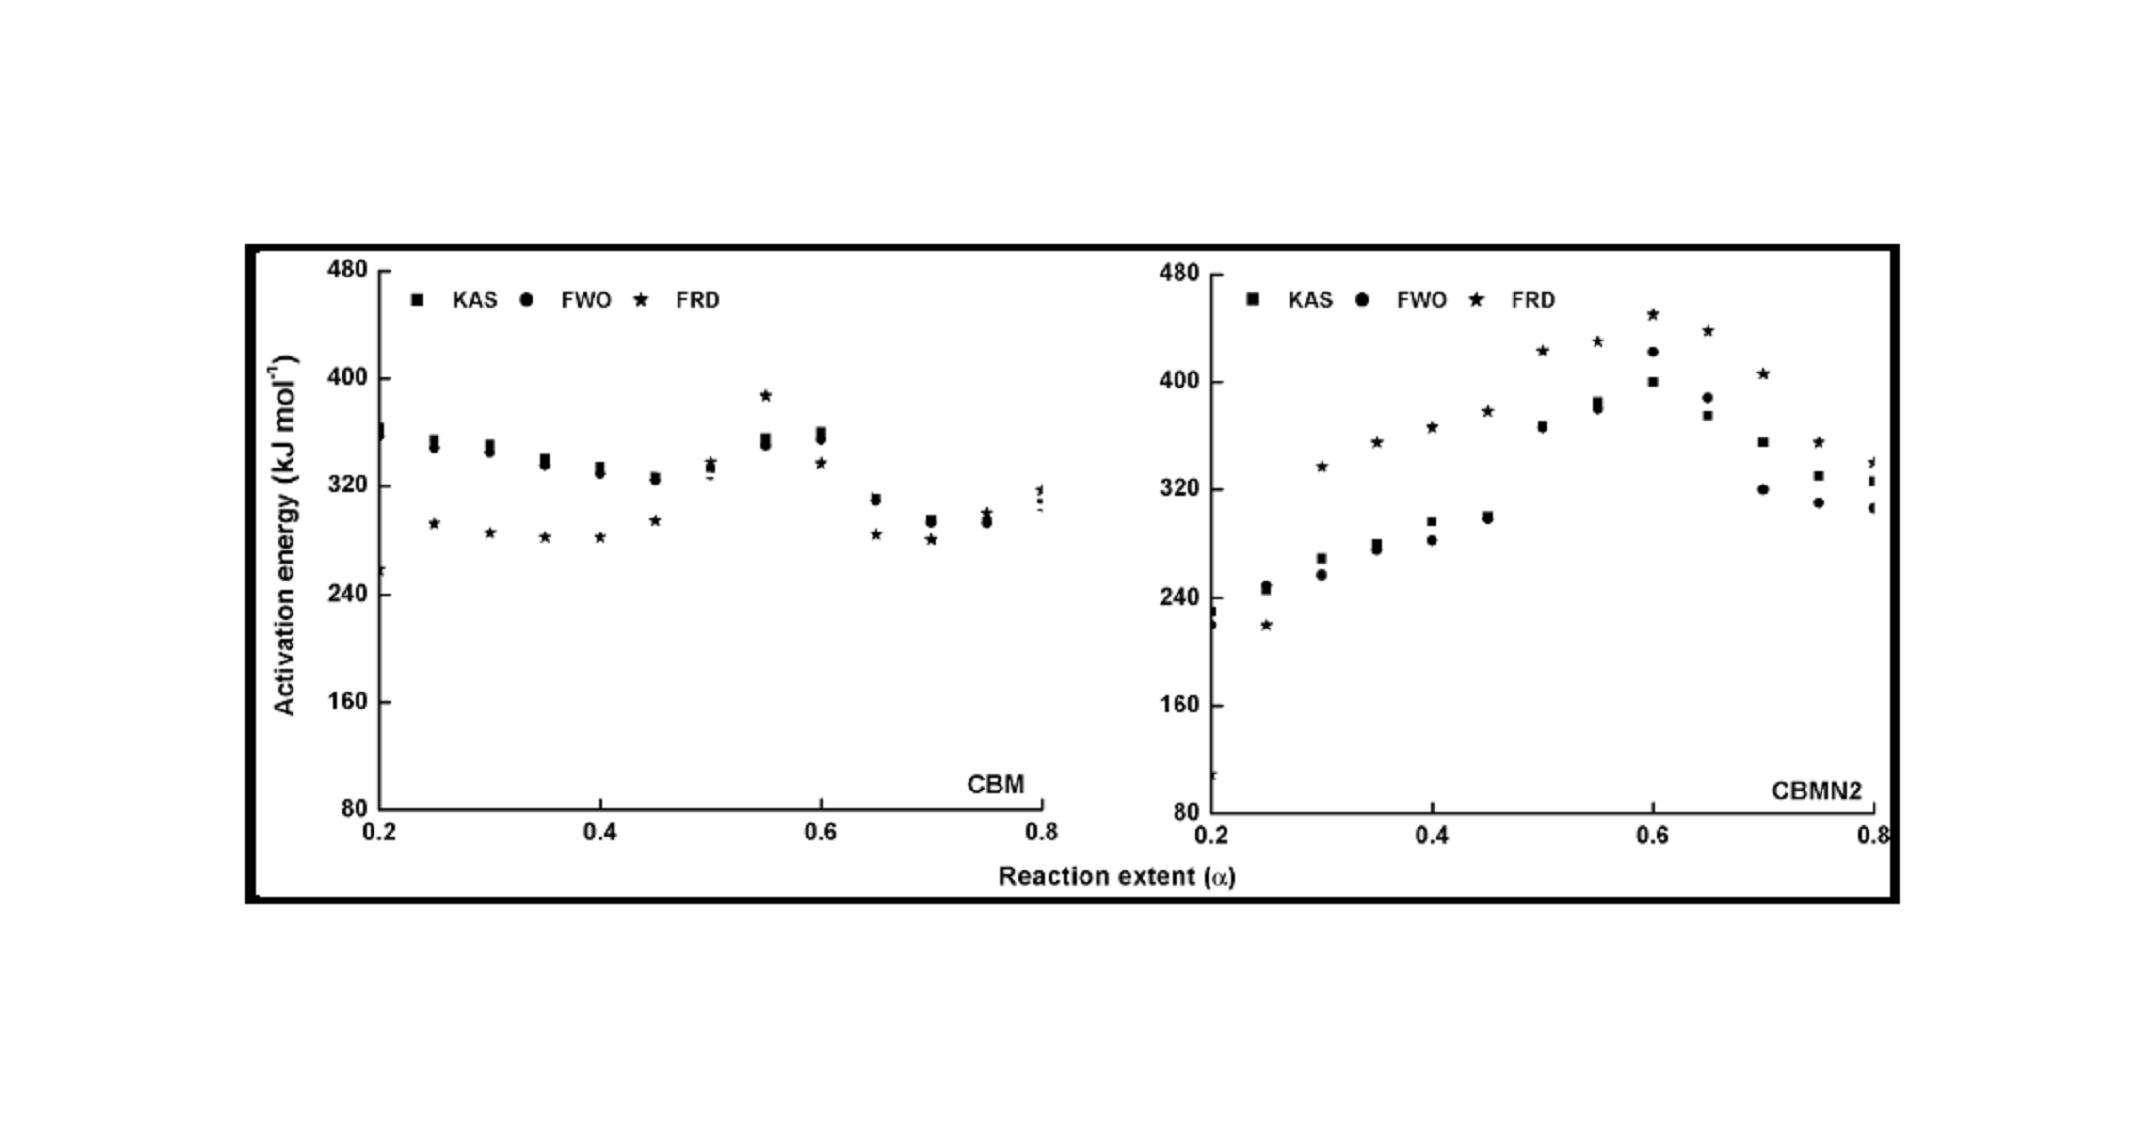
CBMN2 also shows similar trend as that of CBMN1, but its activation energy values are lower than CBM and CBMN1 up to α = 0.60, but afterwards the value reaches a higher region compared to both the systems. At the initial stage the catalytic activity exhibited by NSOM particle makes the degradation of CBMN2 as an easier one; as a result the Ea values are lower. Further, the degradation of the long alkyl chains present in the NSOM particles may also add to this factor. But after 0.60 reaction extent value the Ea value get increased this may due to the restriction of mobility of the segmental movement of degrading chains exhibited by the enhanced interaction between the silica and the polymer matrix.

The trend shown by CBMN3 is completely different from the other three systems. The activation energy values are present in the lower region. In the chemically modified nanosilica particles incorporated BMIM system, the maleimide units chemically bound with the silica units is having the possibility to polymerize with the maleimide double bonds present in the BMIM monomer. The chemically modified silica particles act as spacers and this bulky spacer invariably reduces the crosslinking density in the cured BMIM (CBMN3). Due to this aspect, during the degradation there will be enhanced motion of the chain segments favoring easy degradation [42]. 

Conclusions

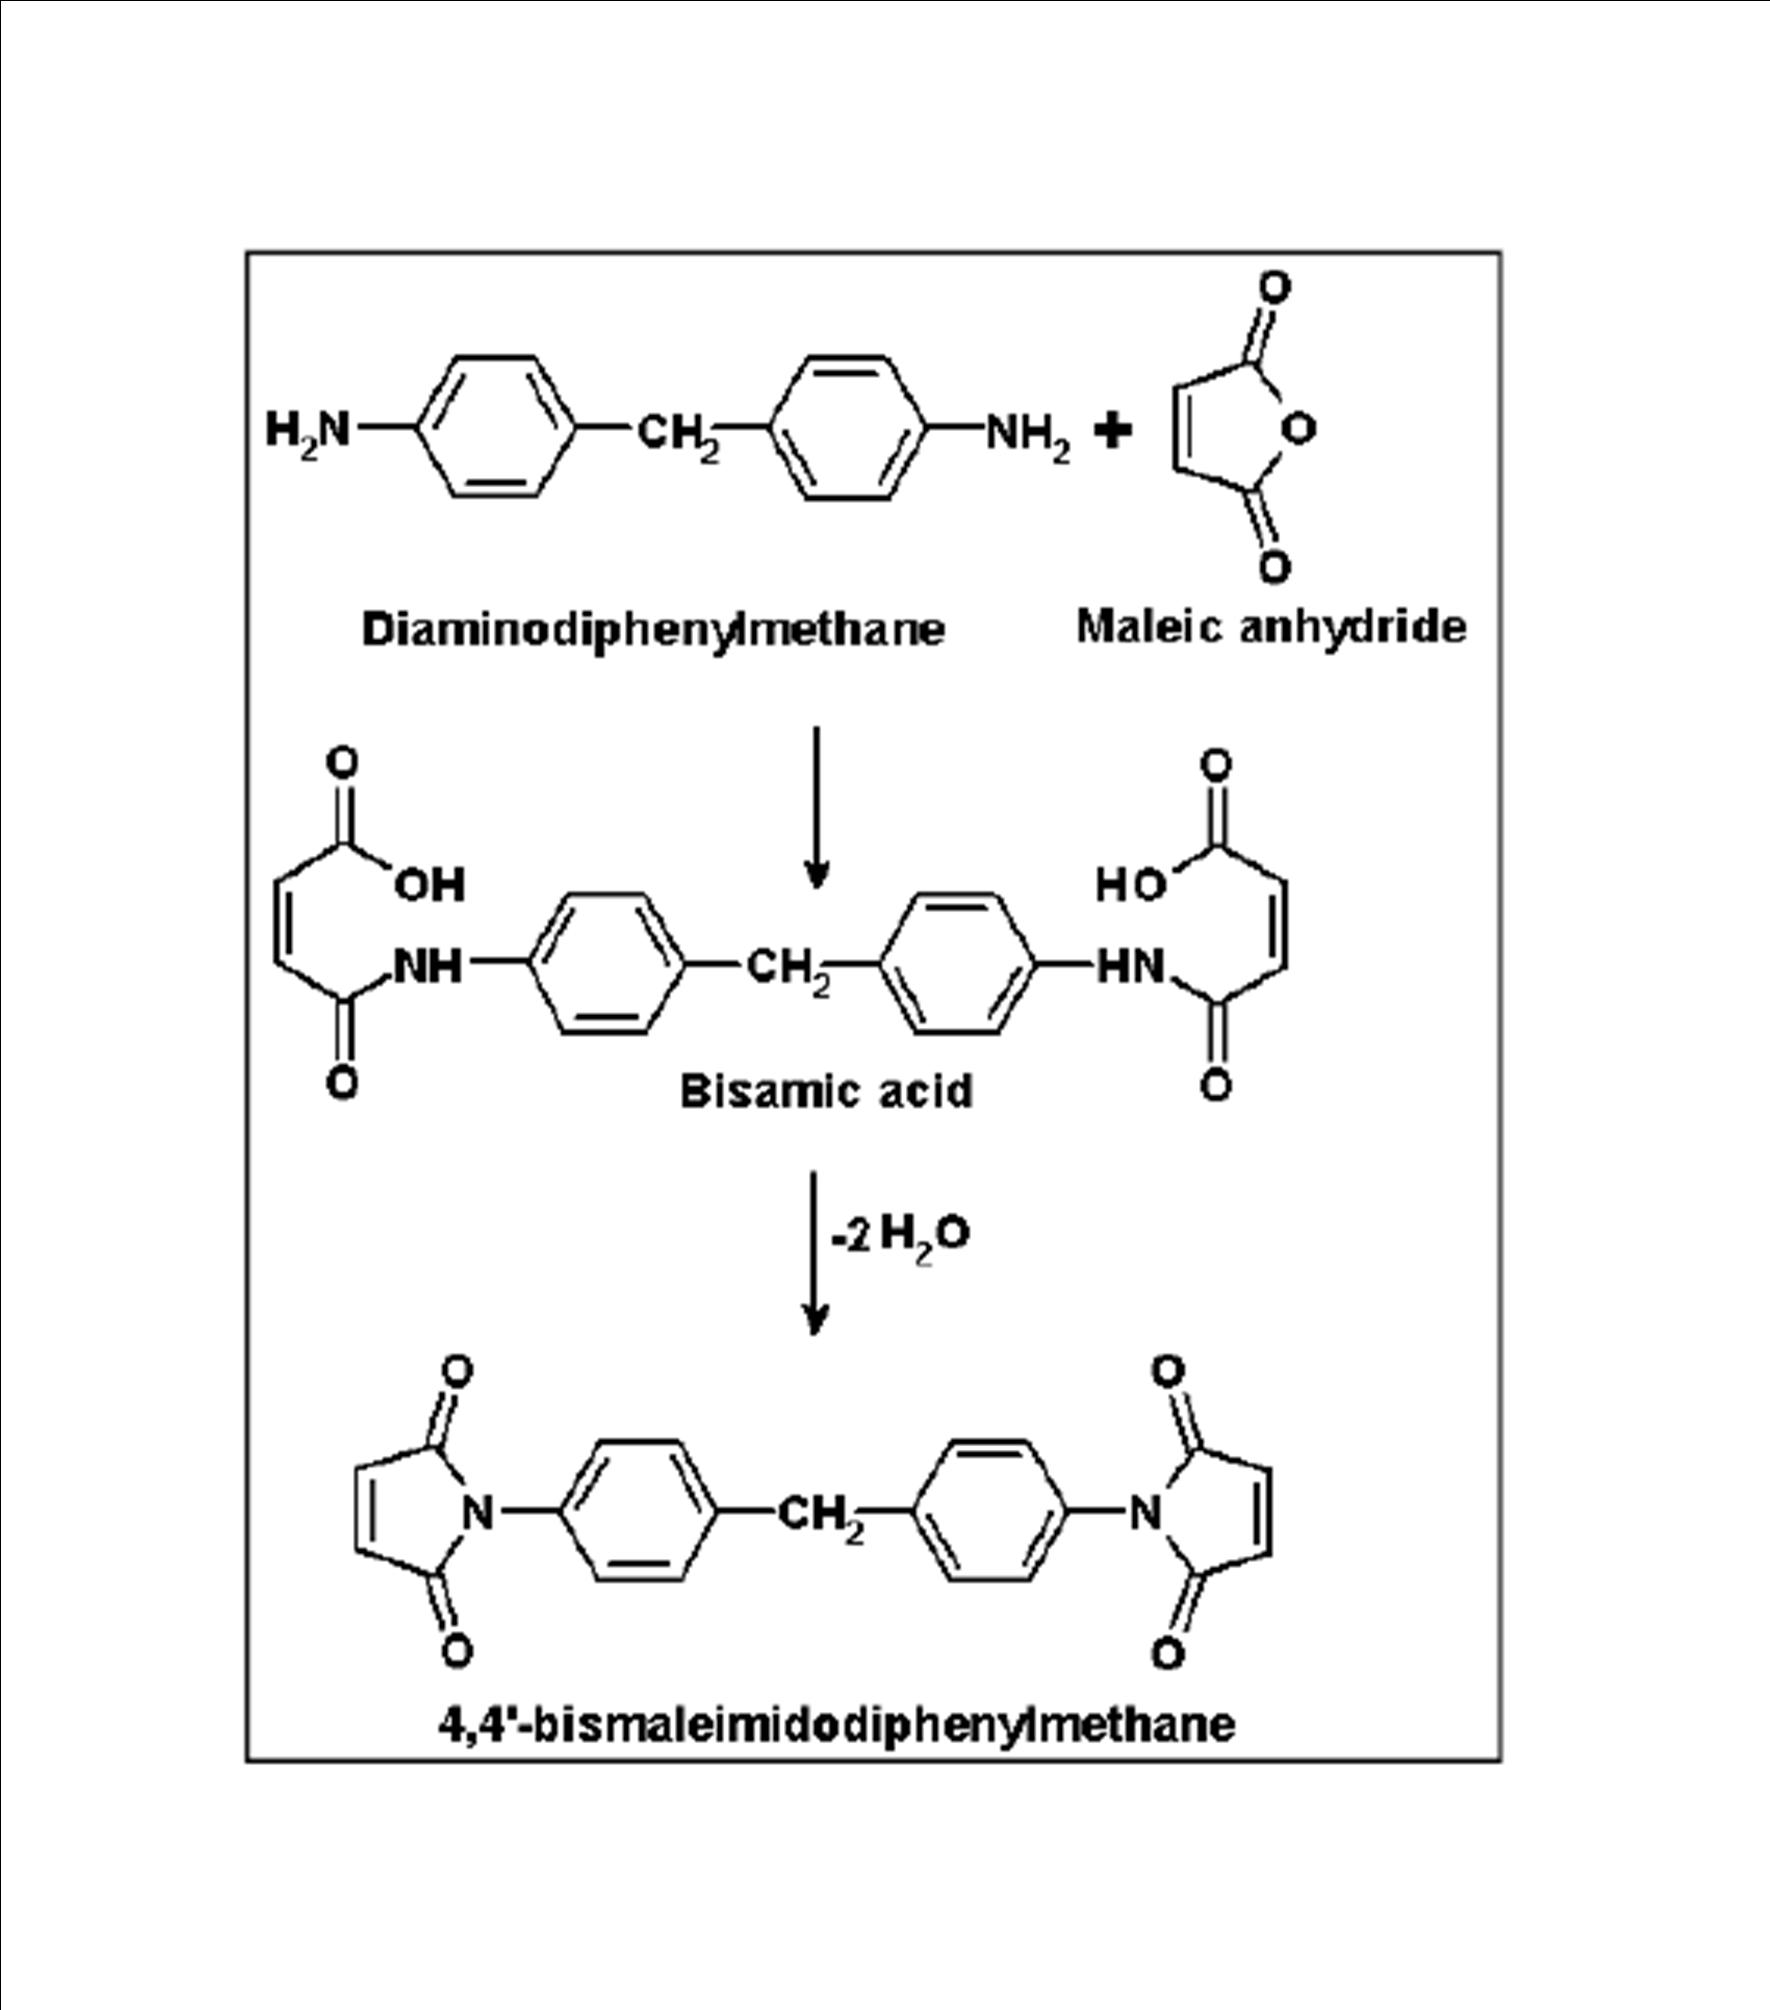
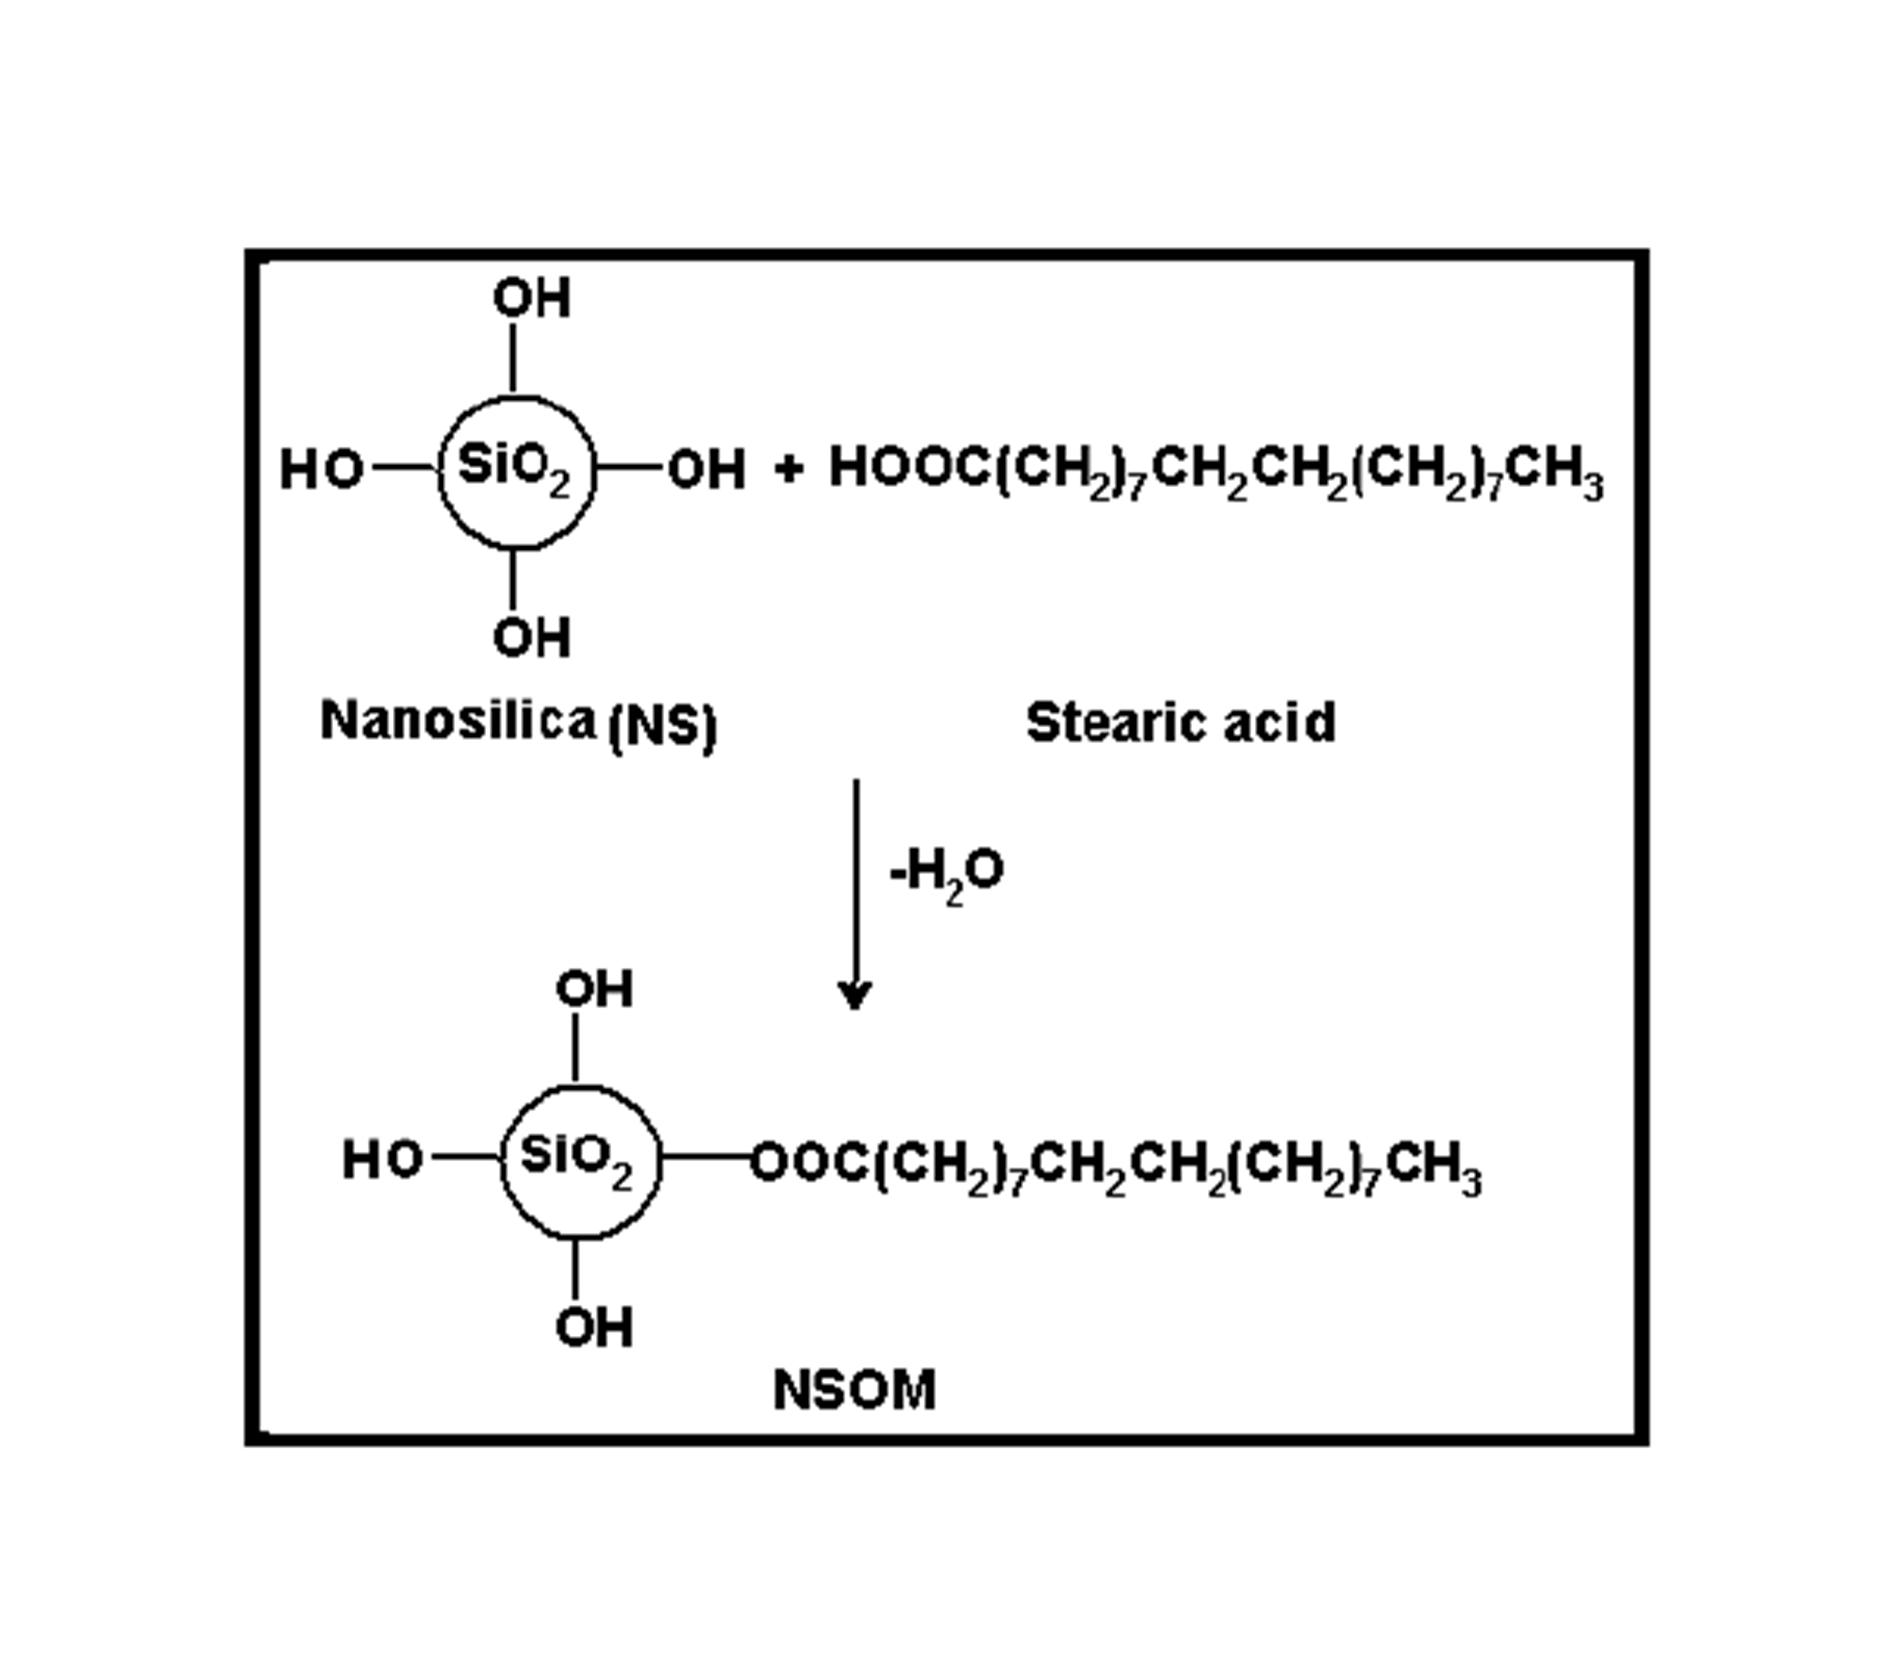
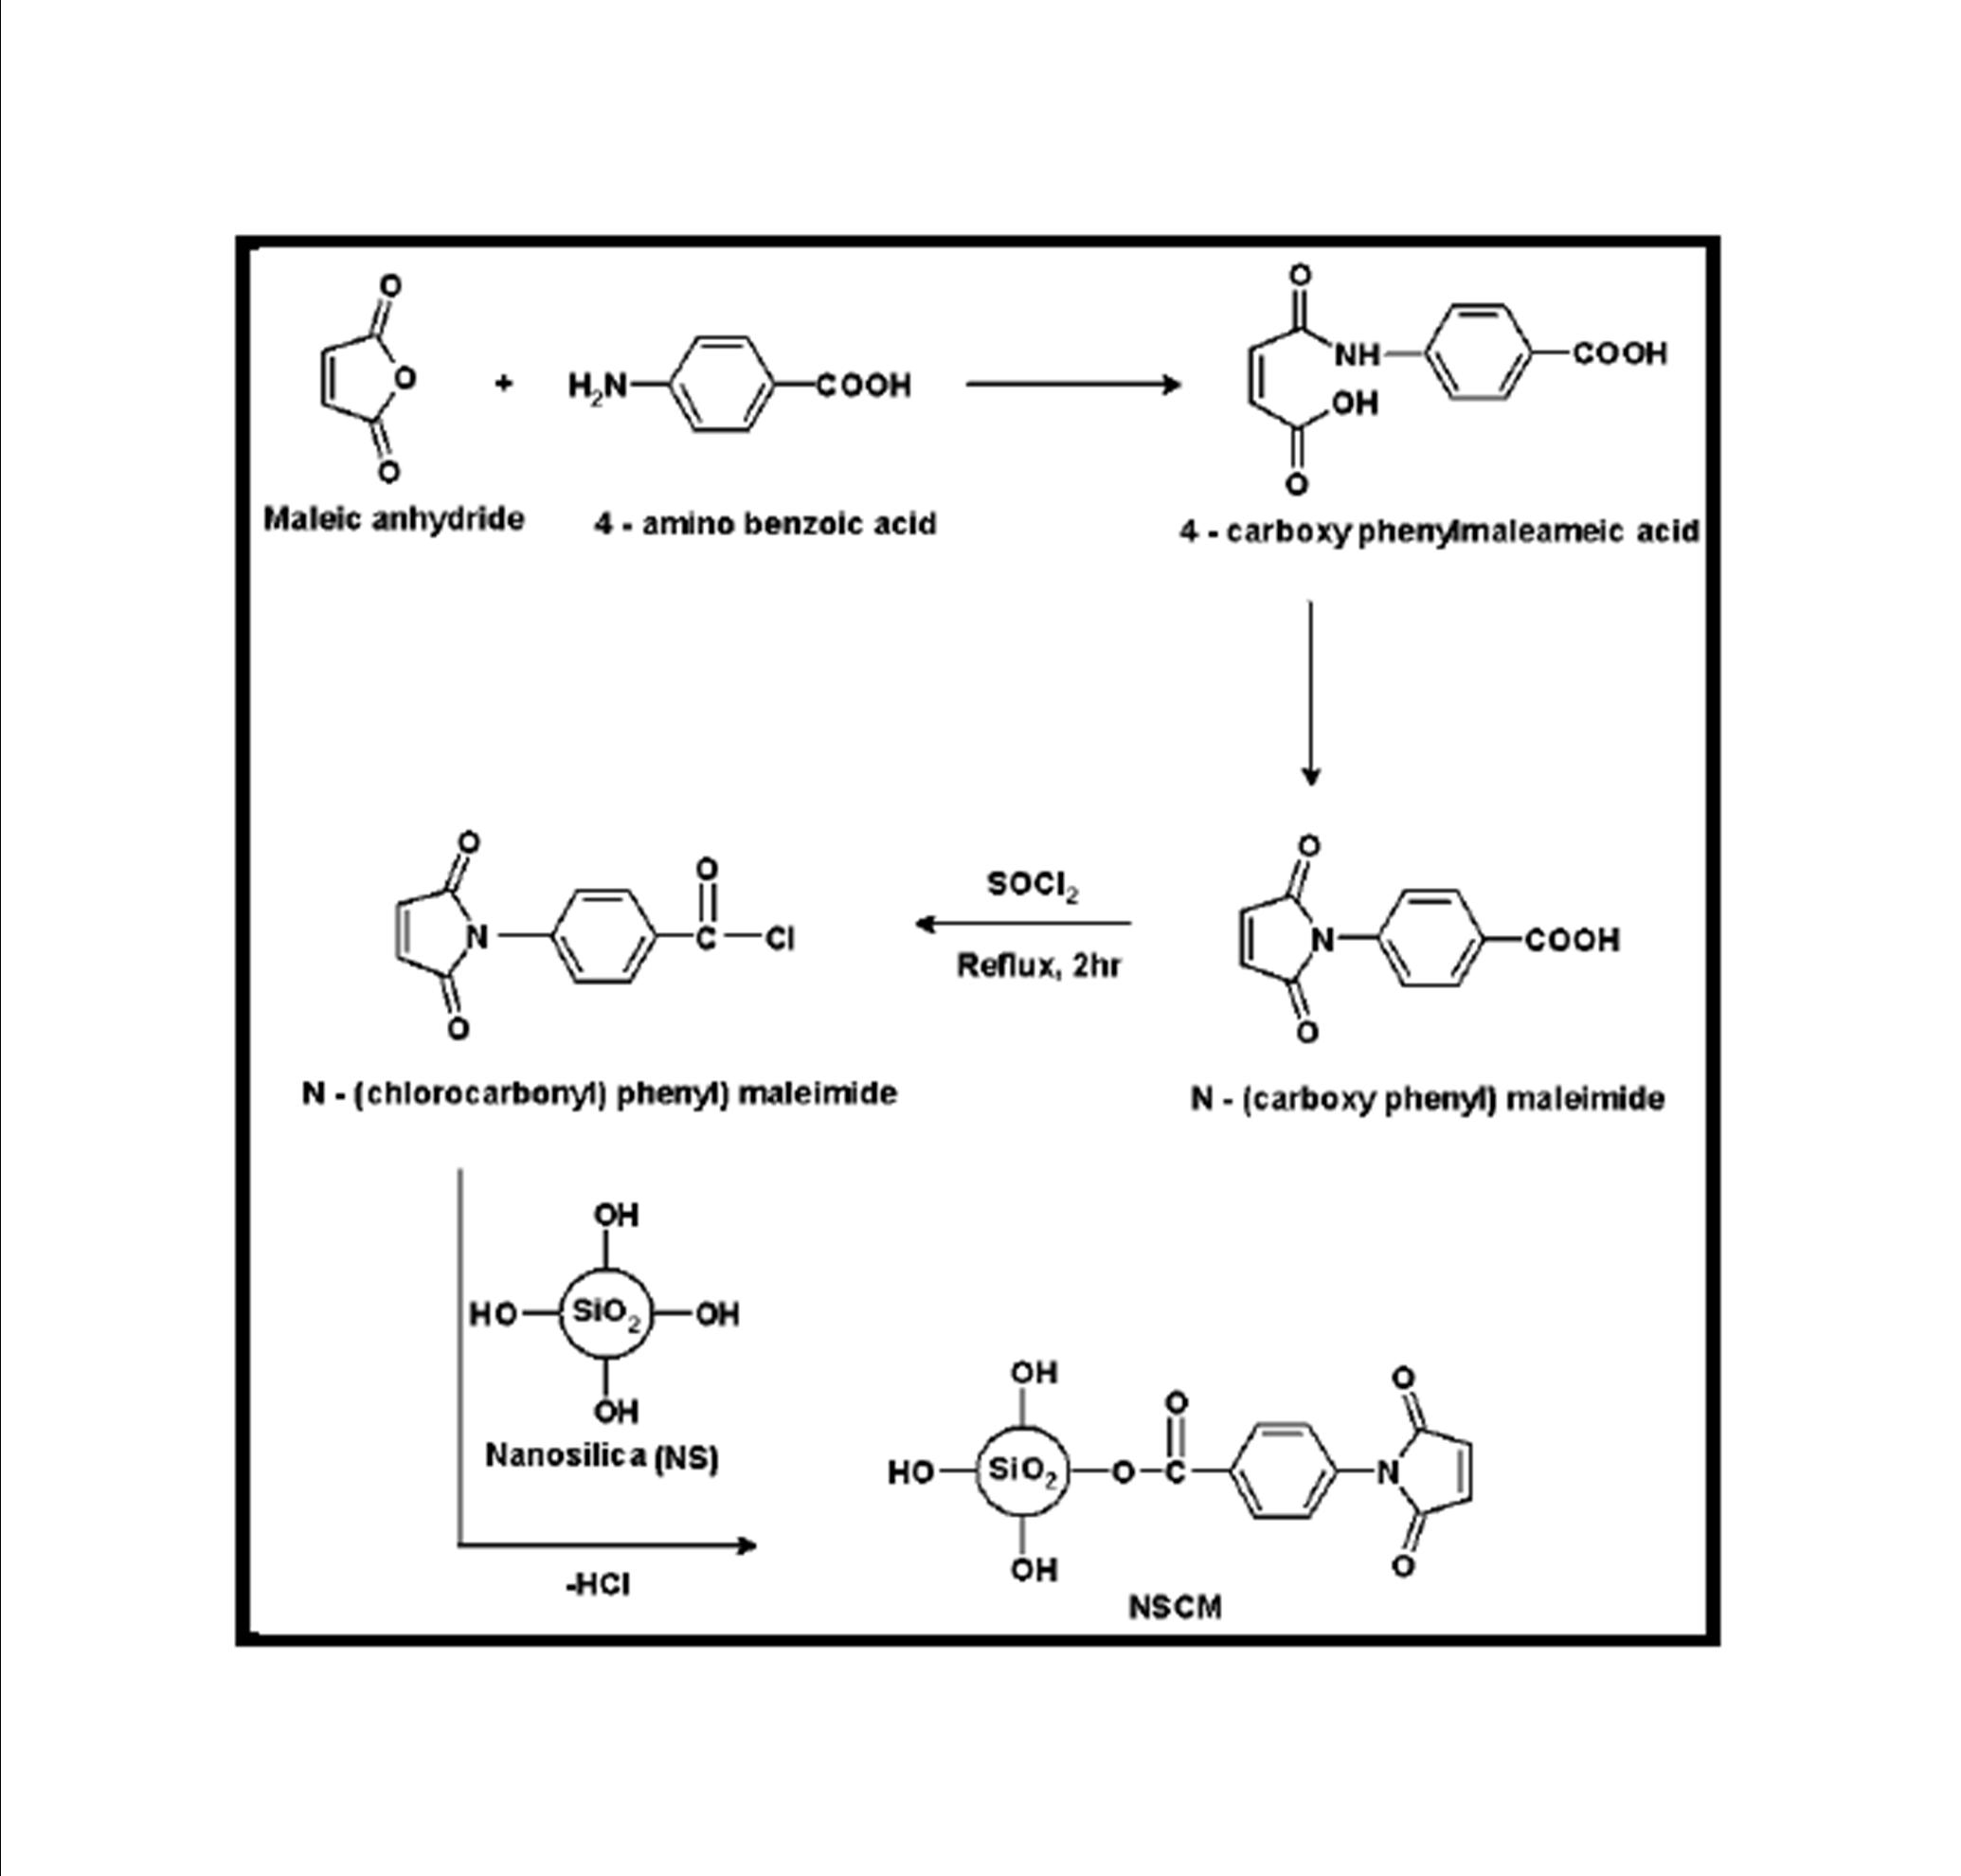
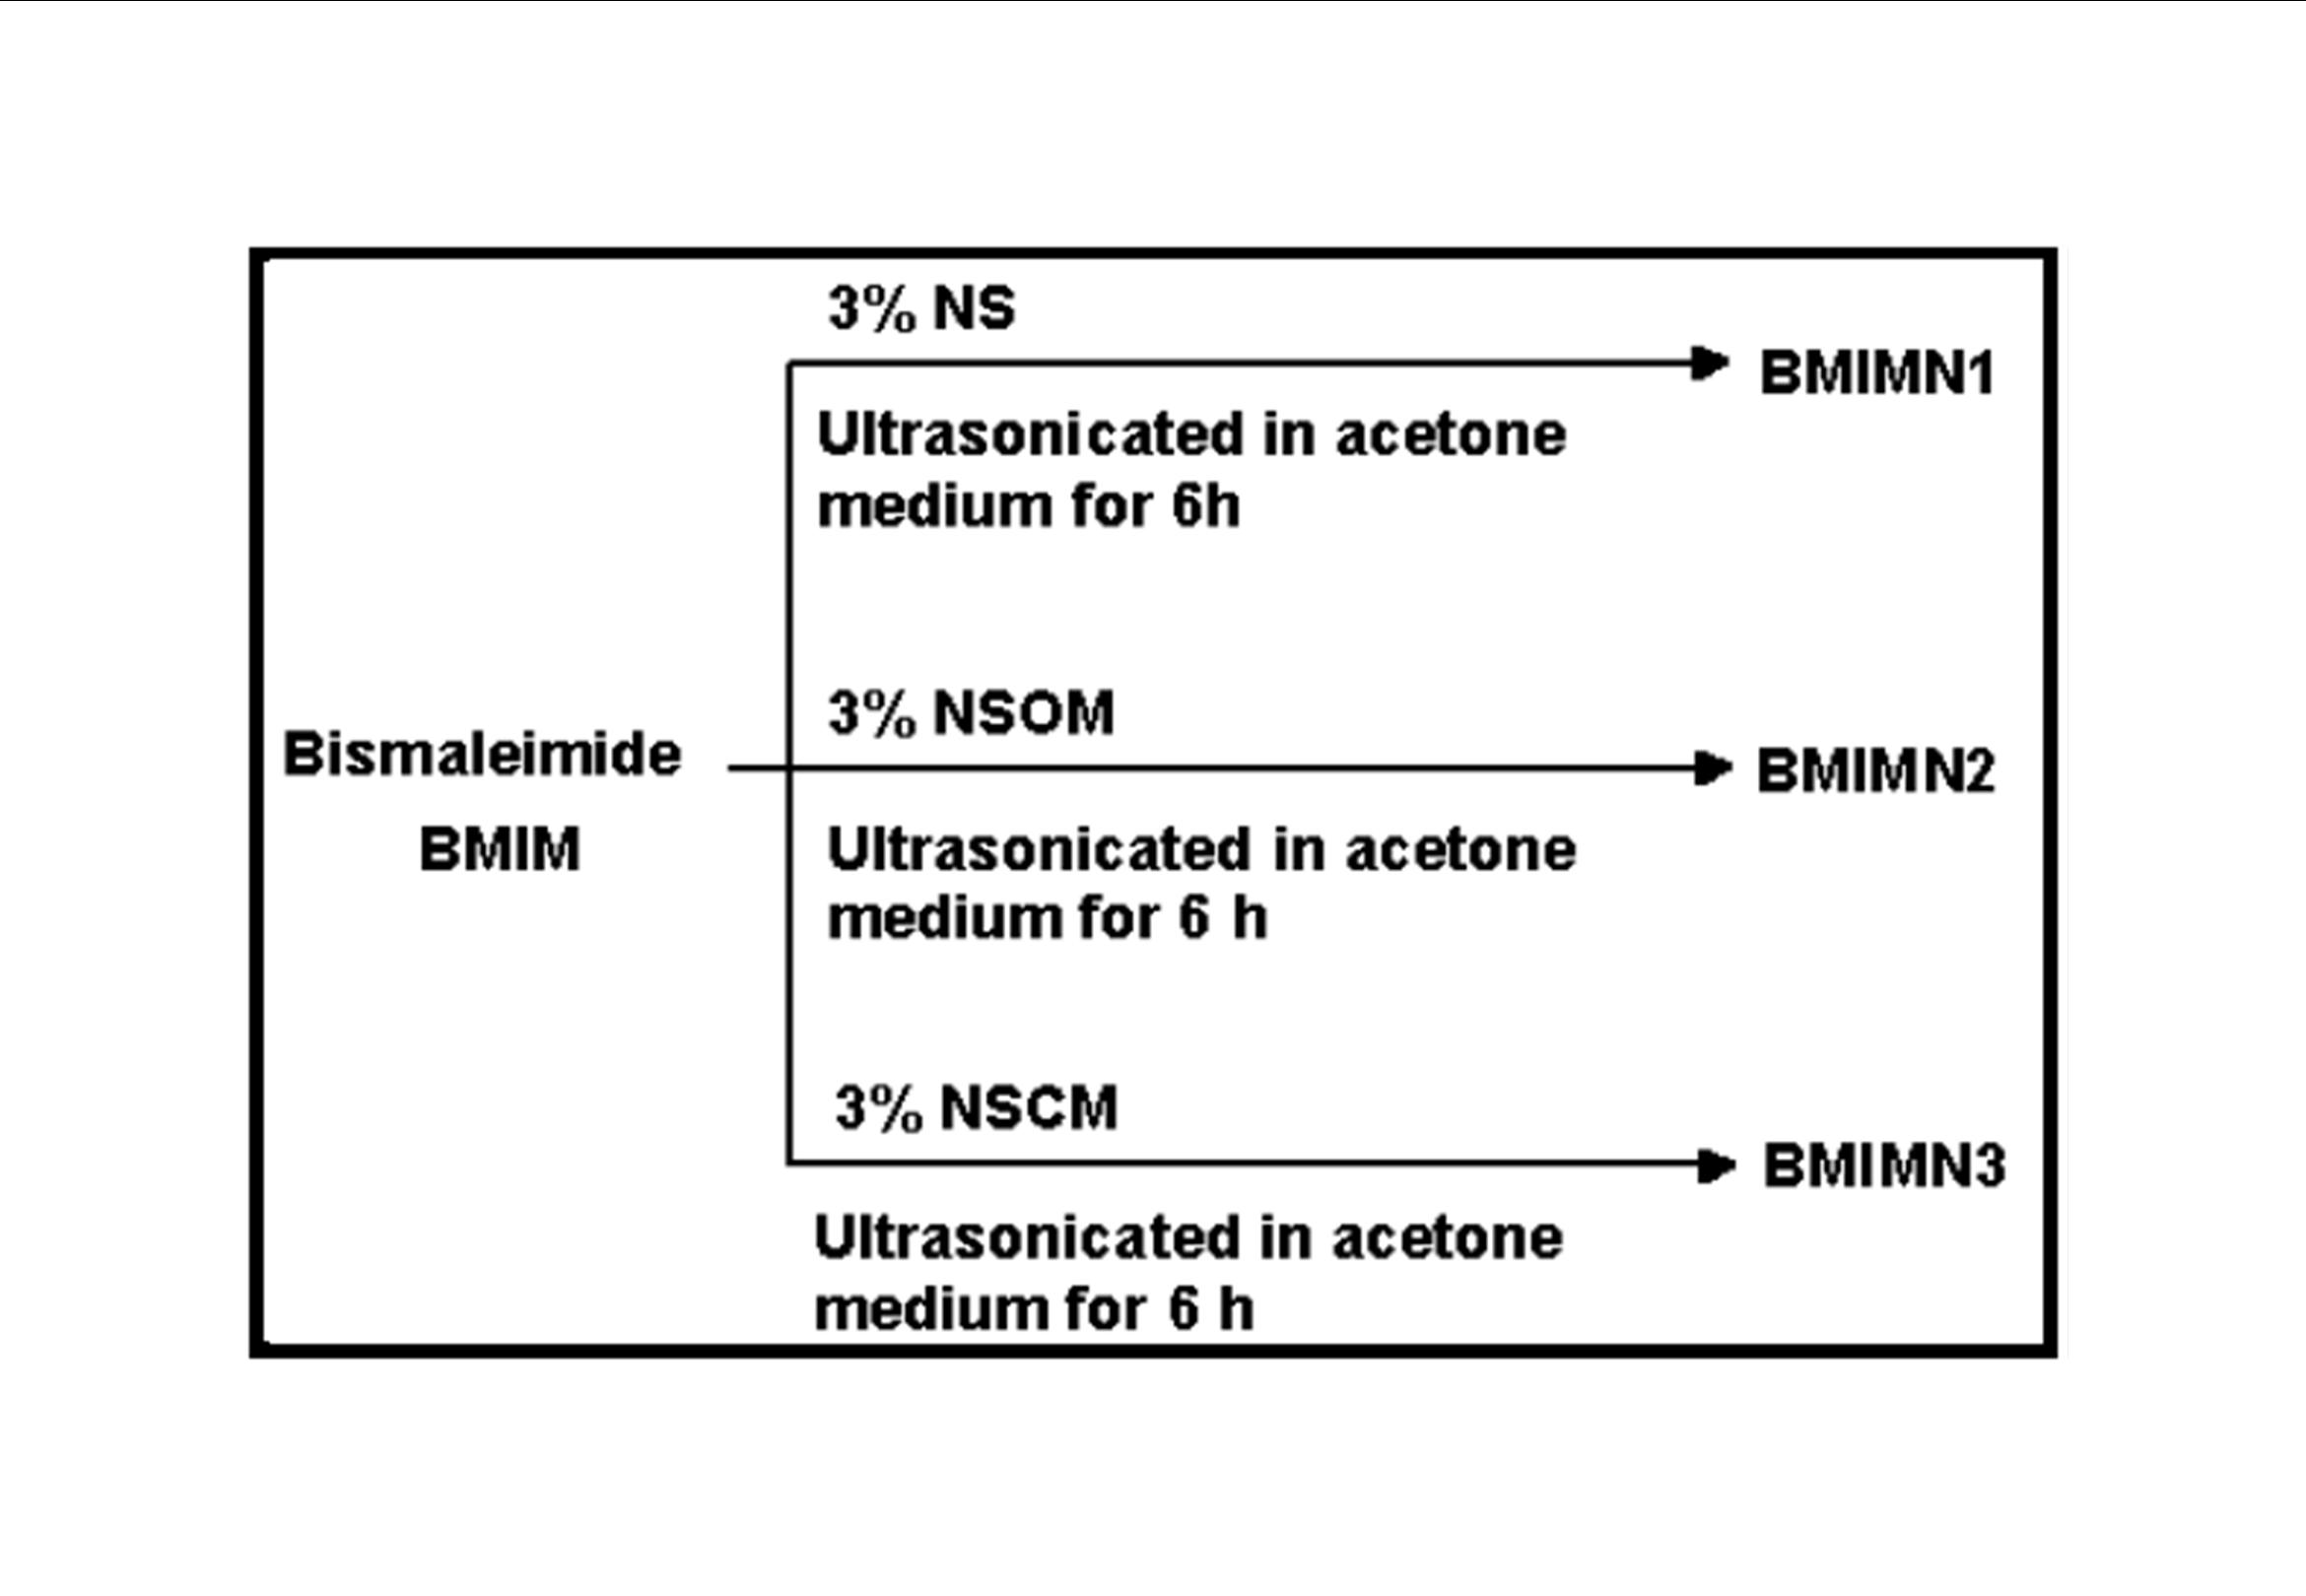
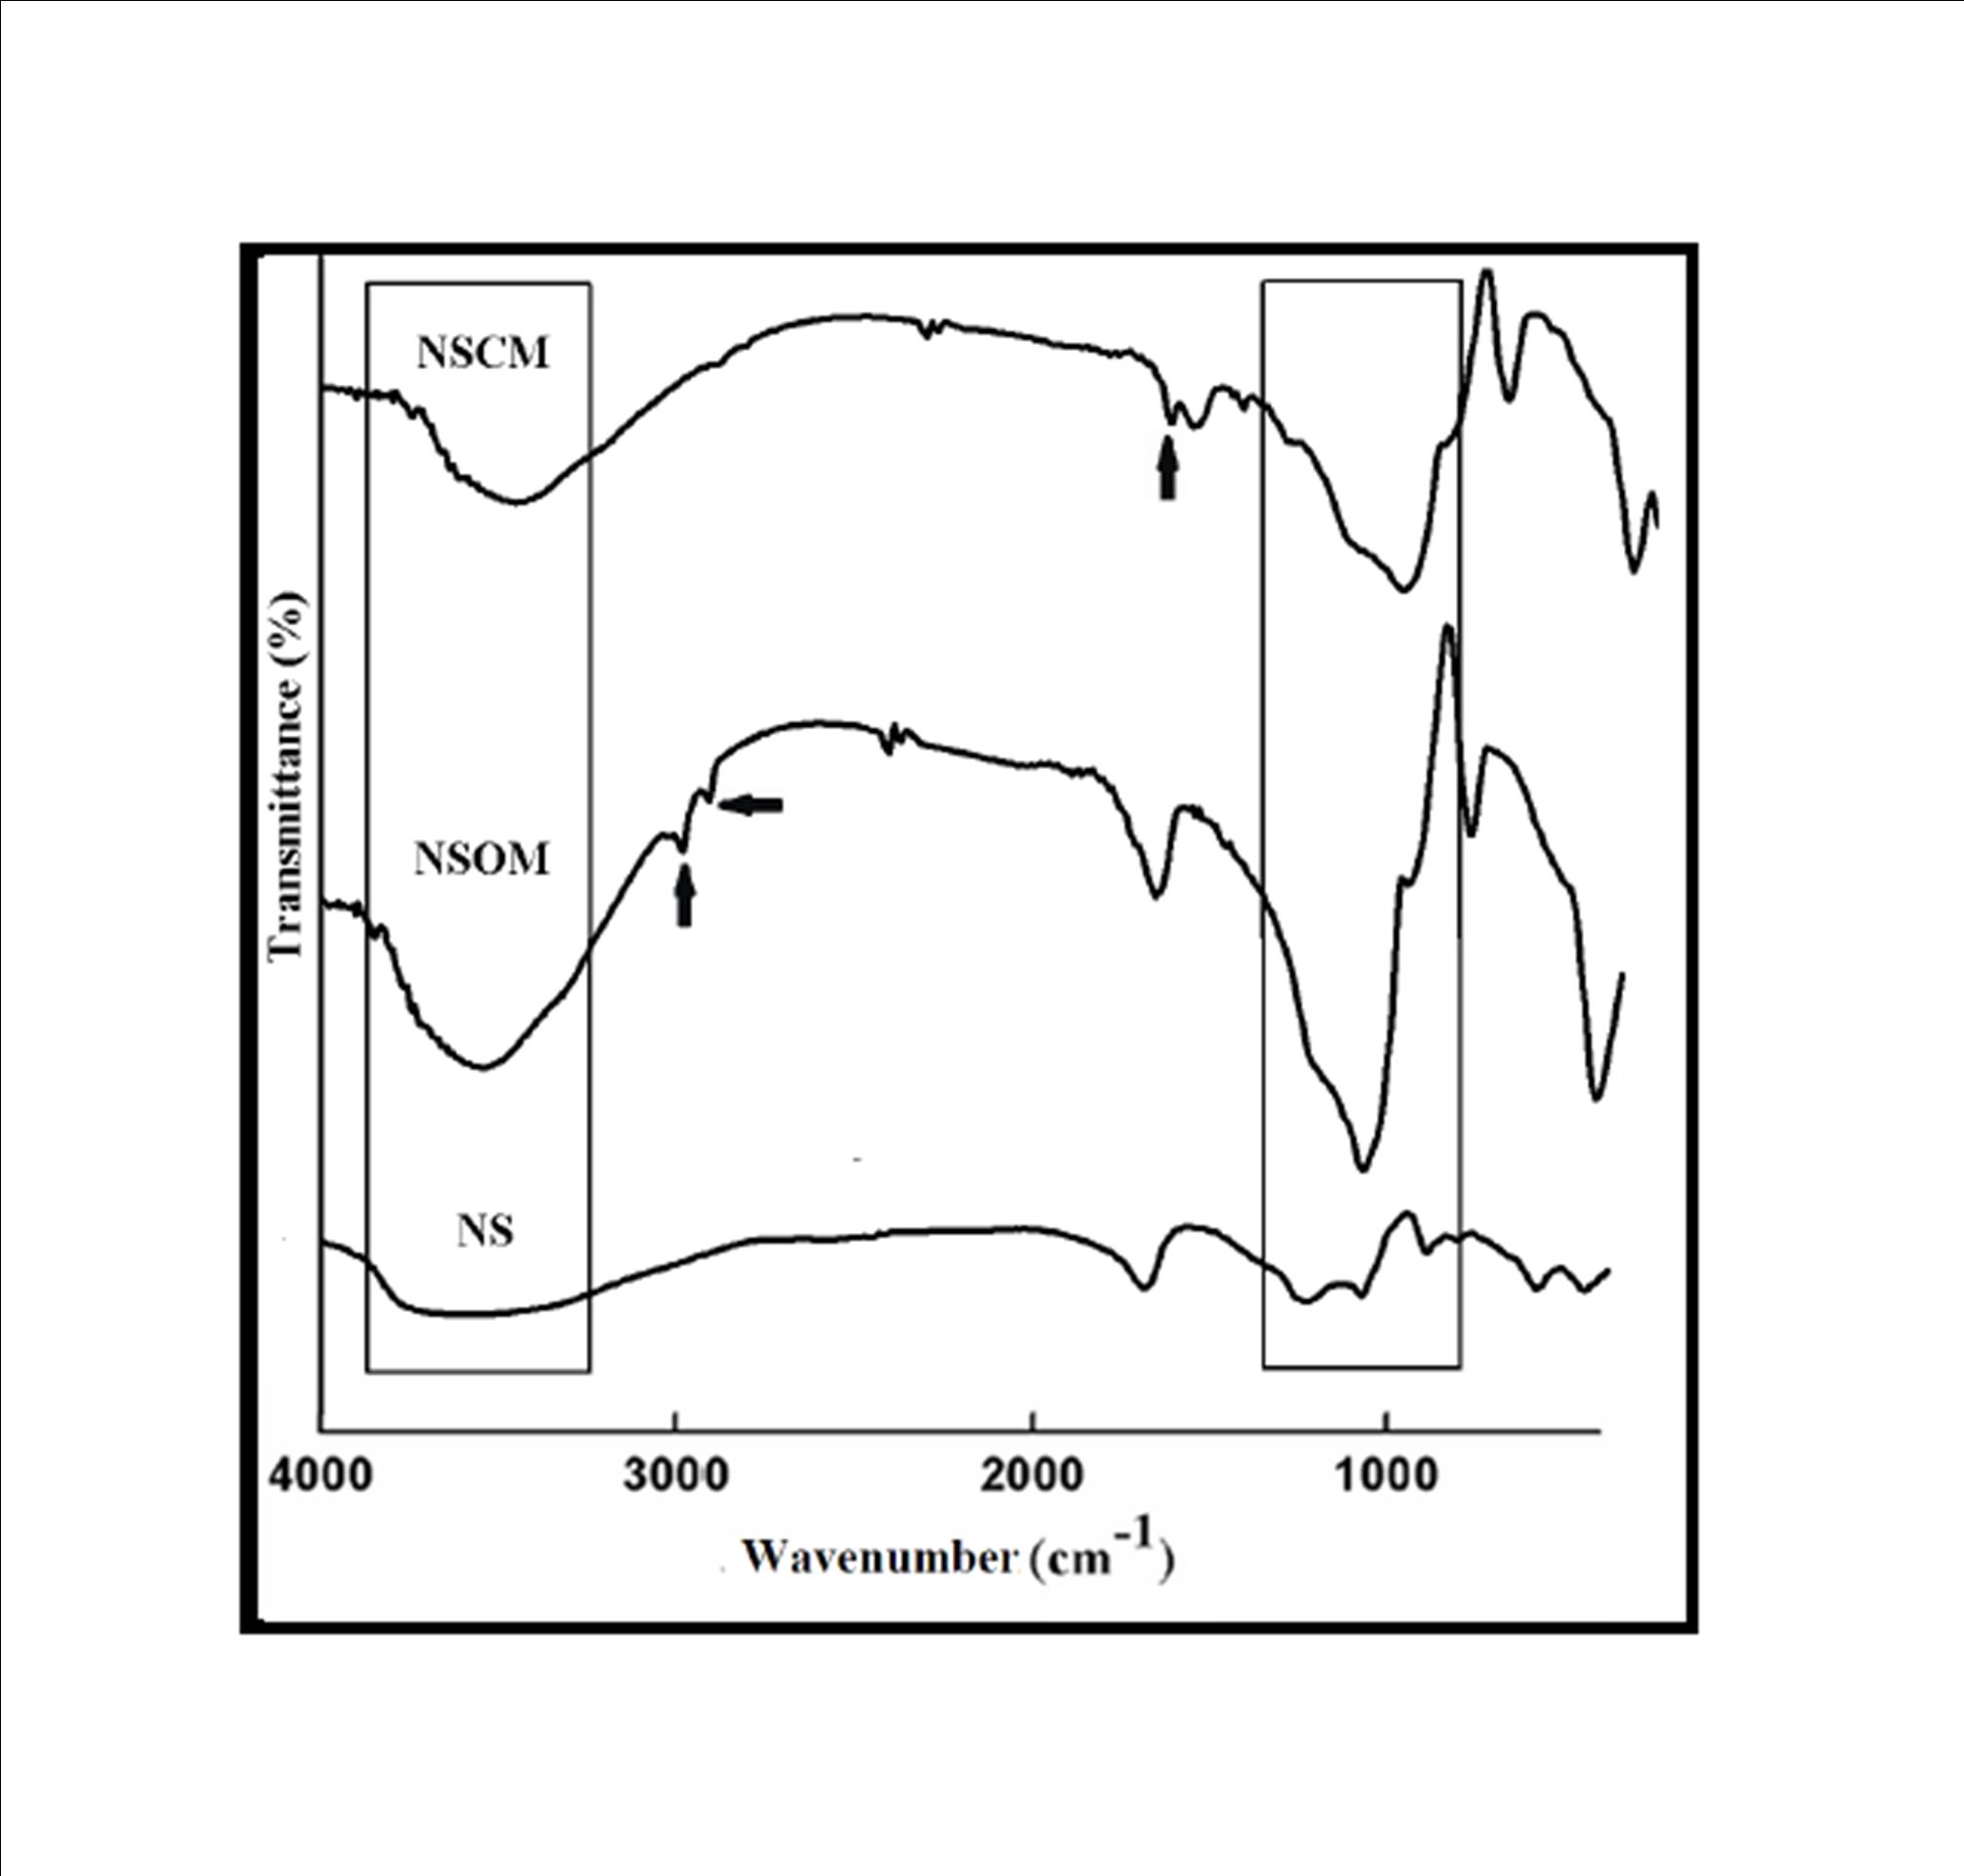
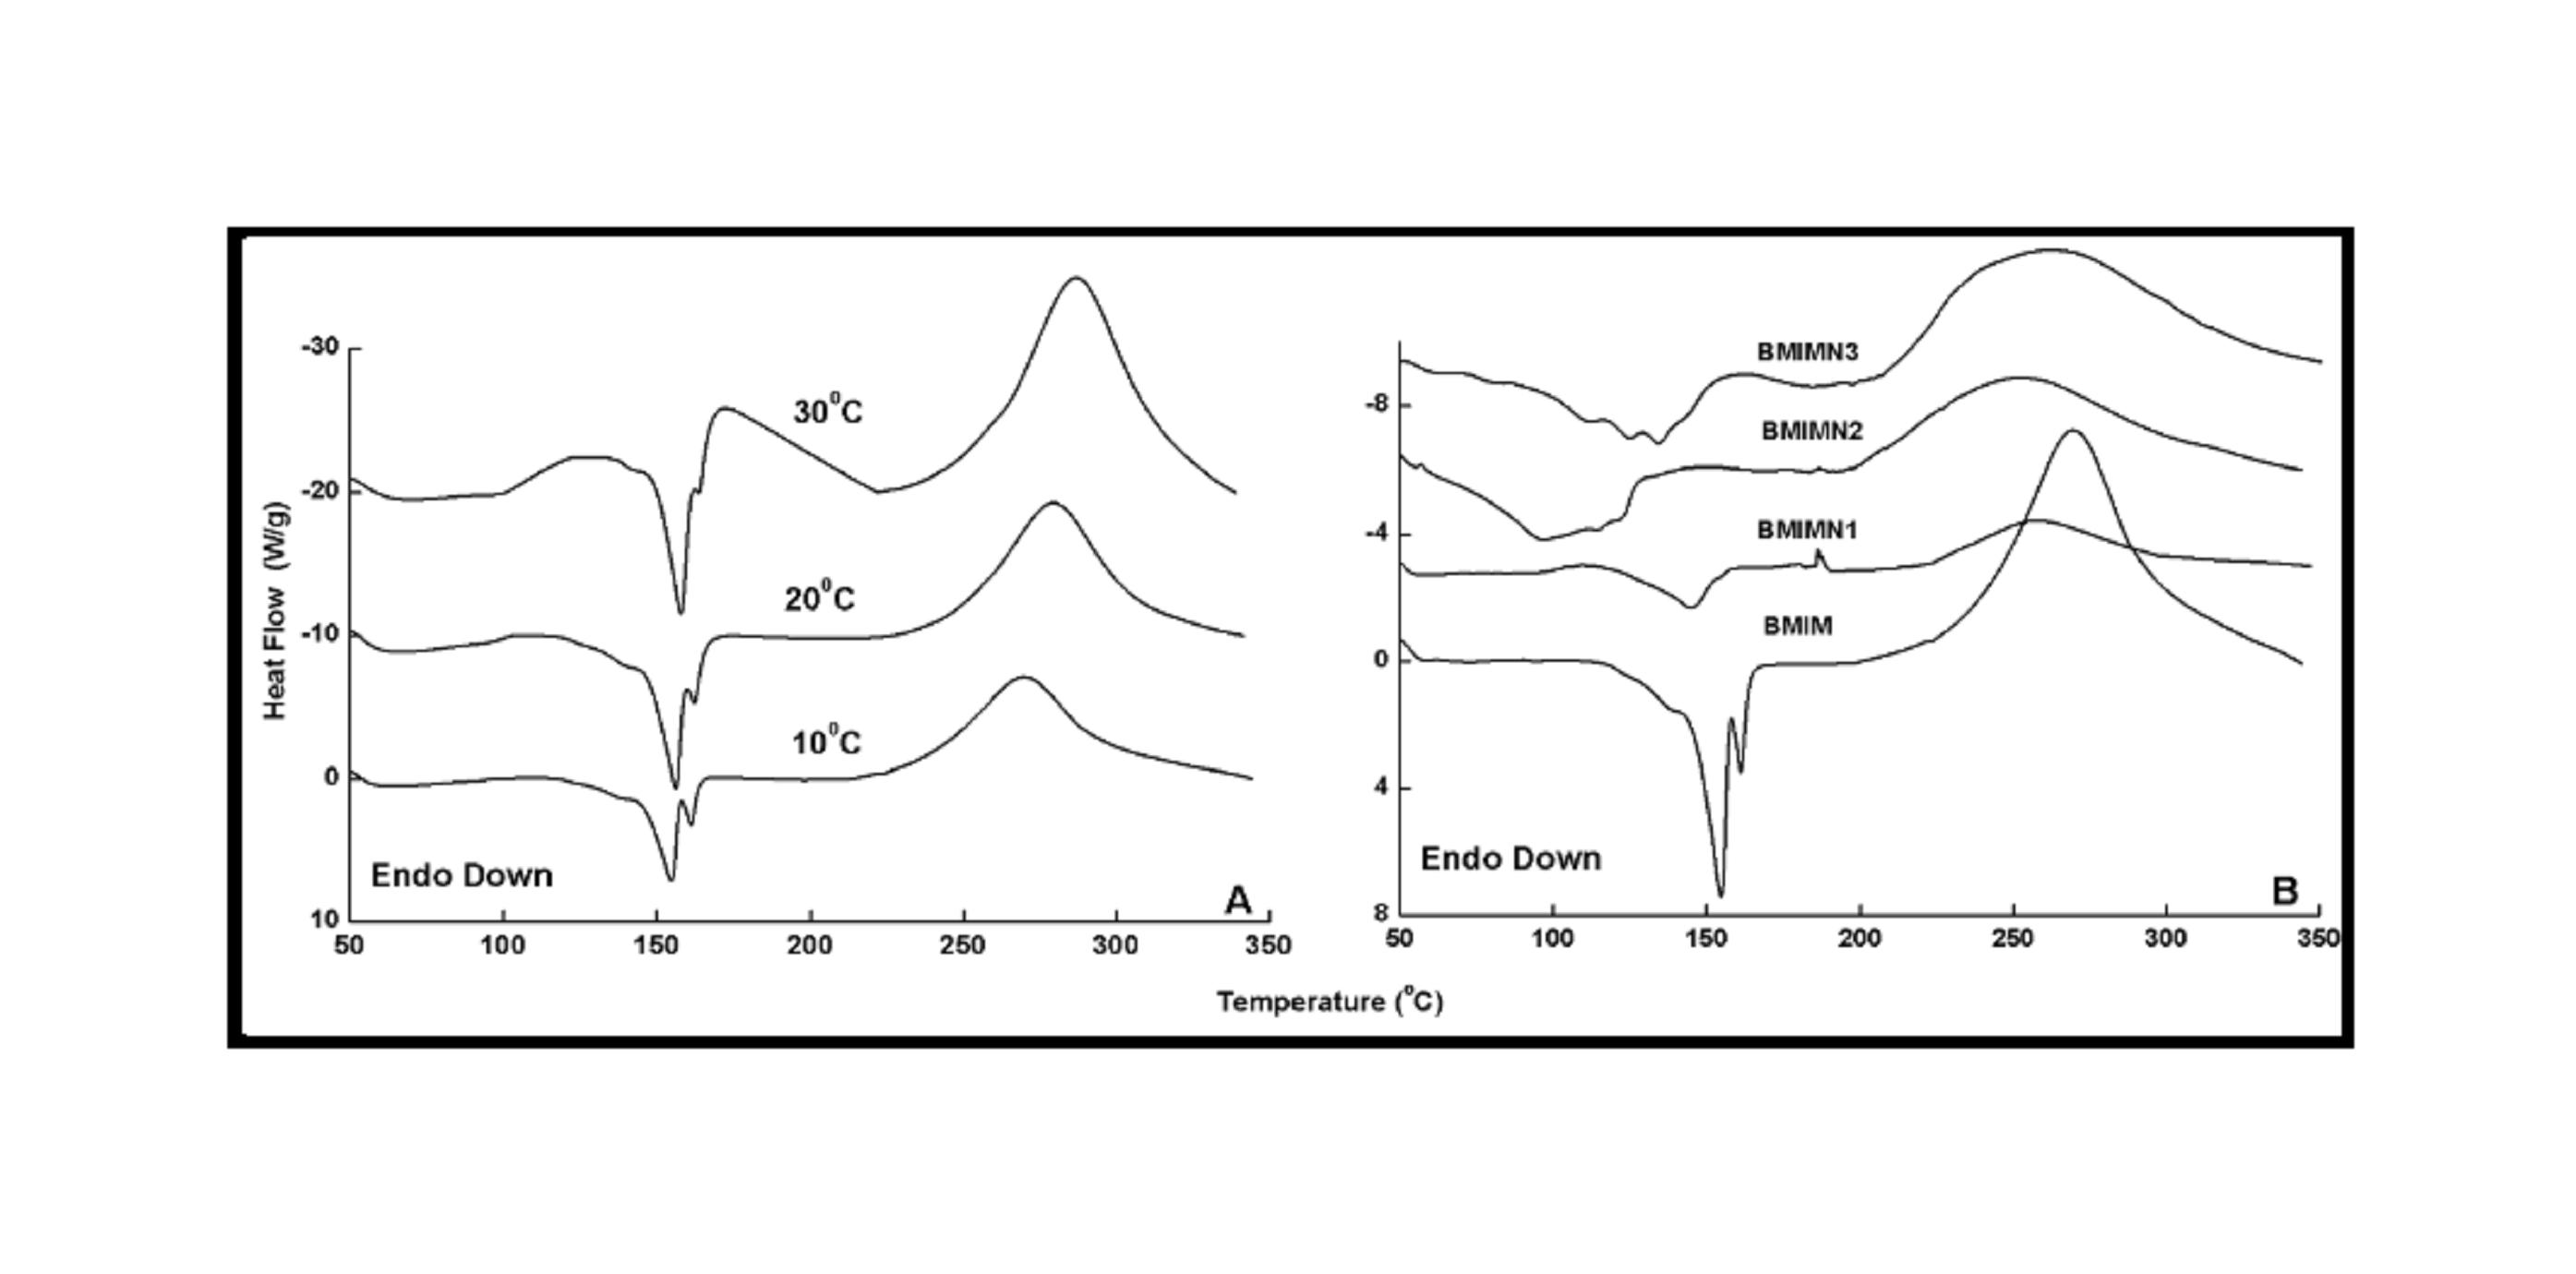
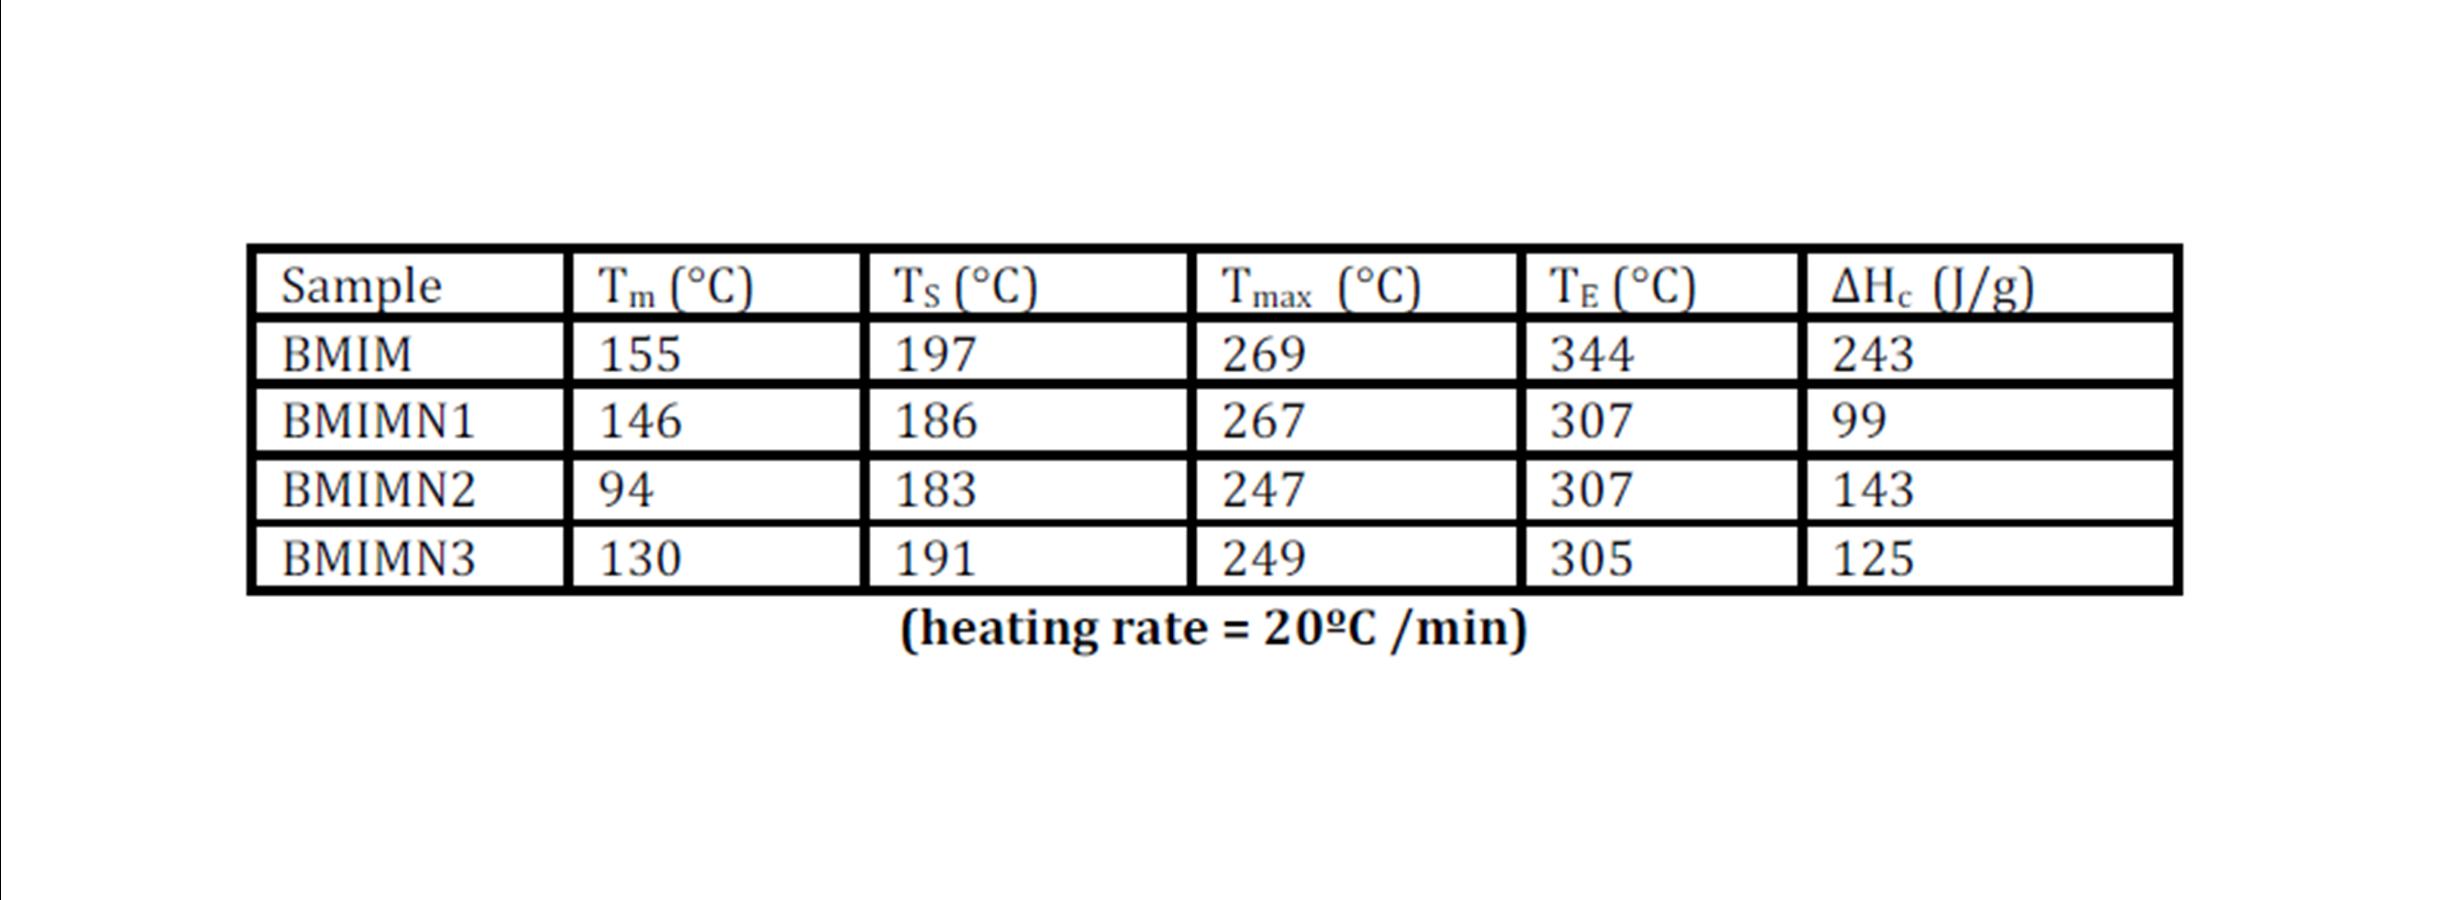
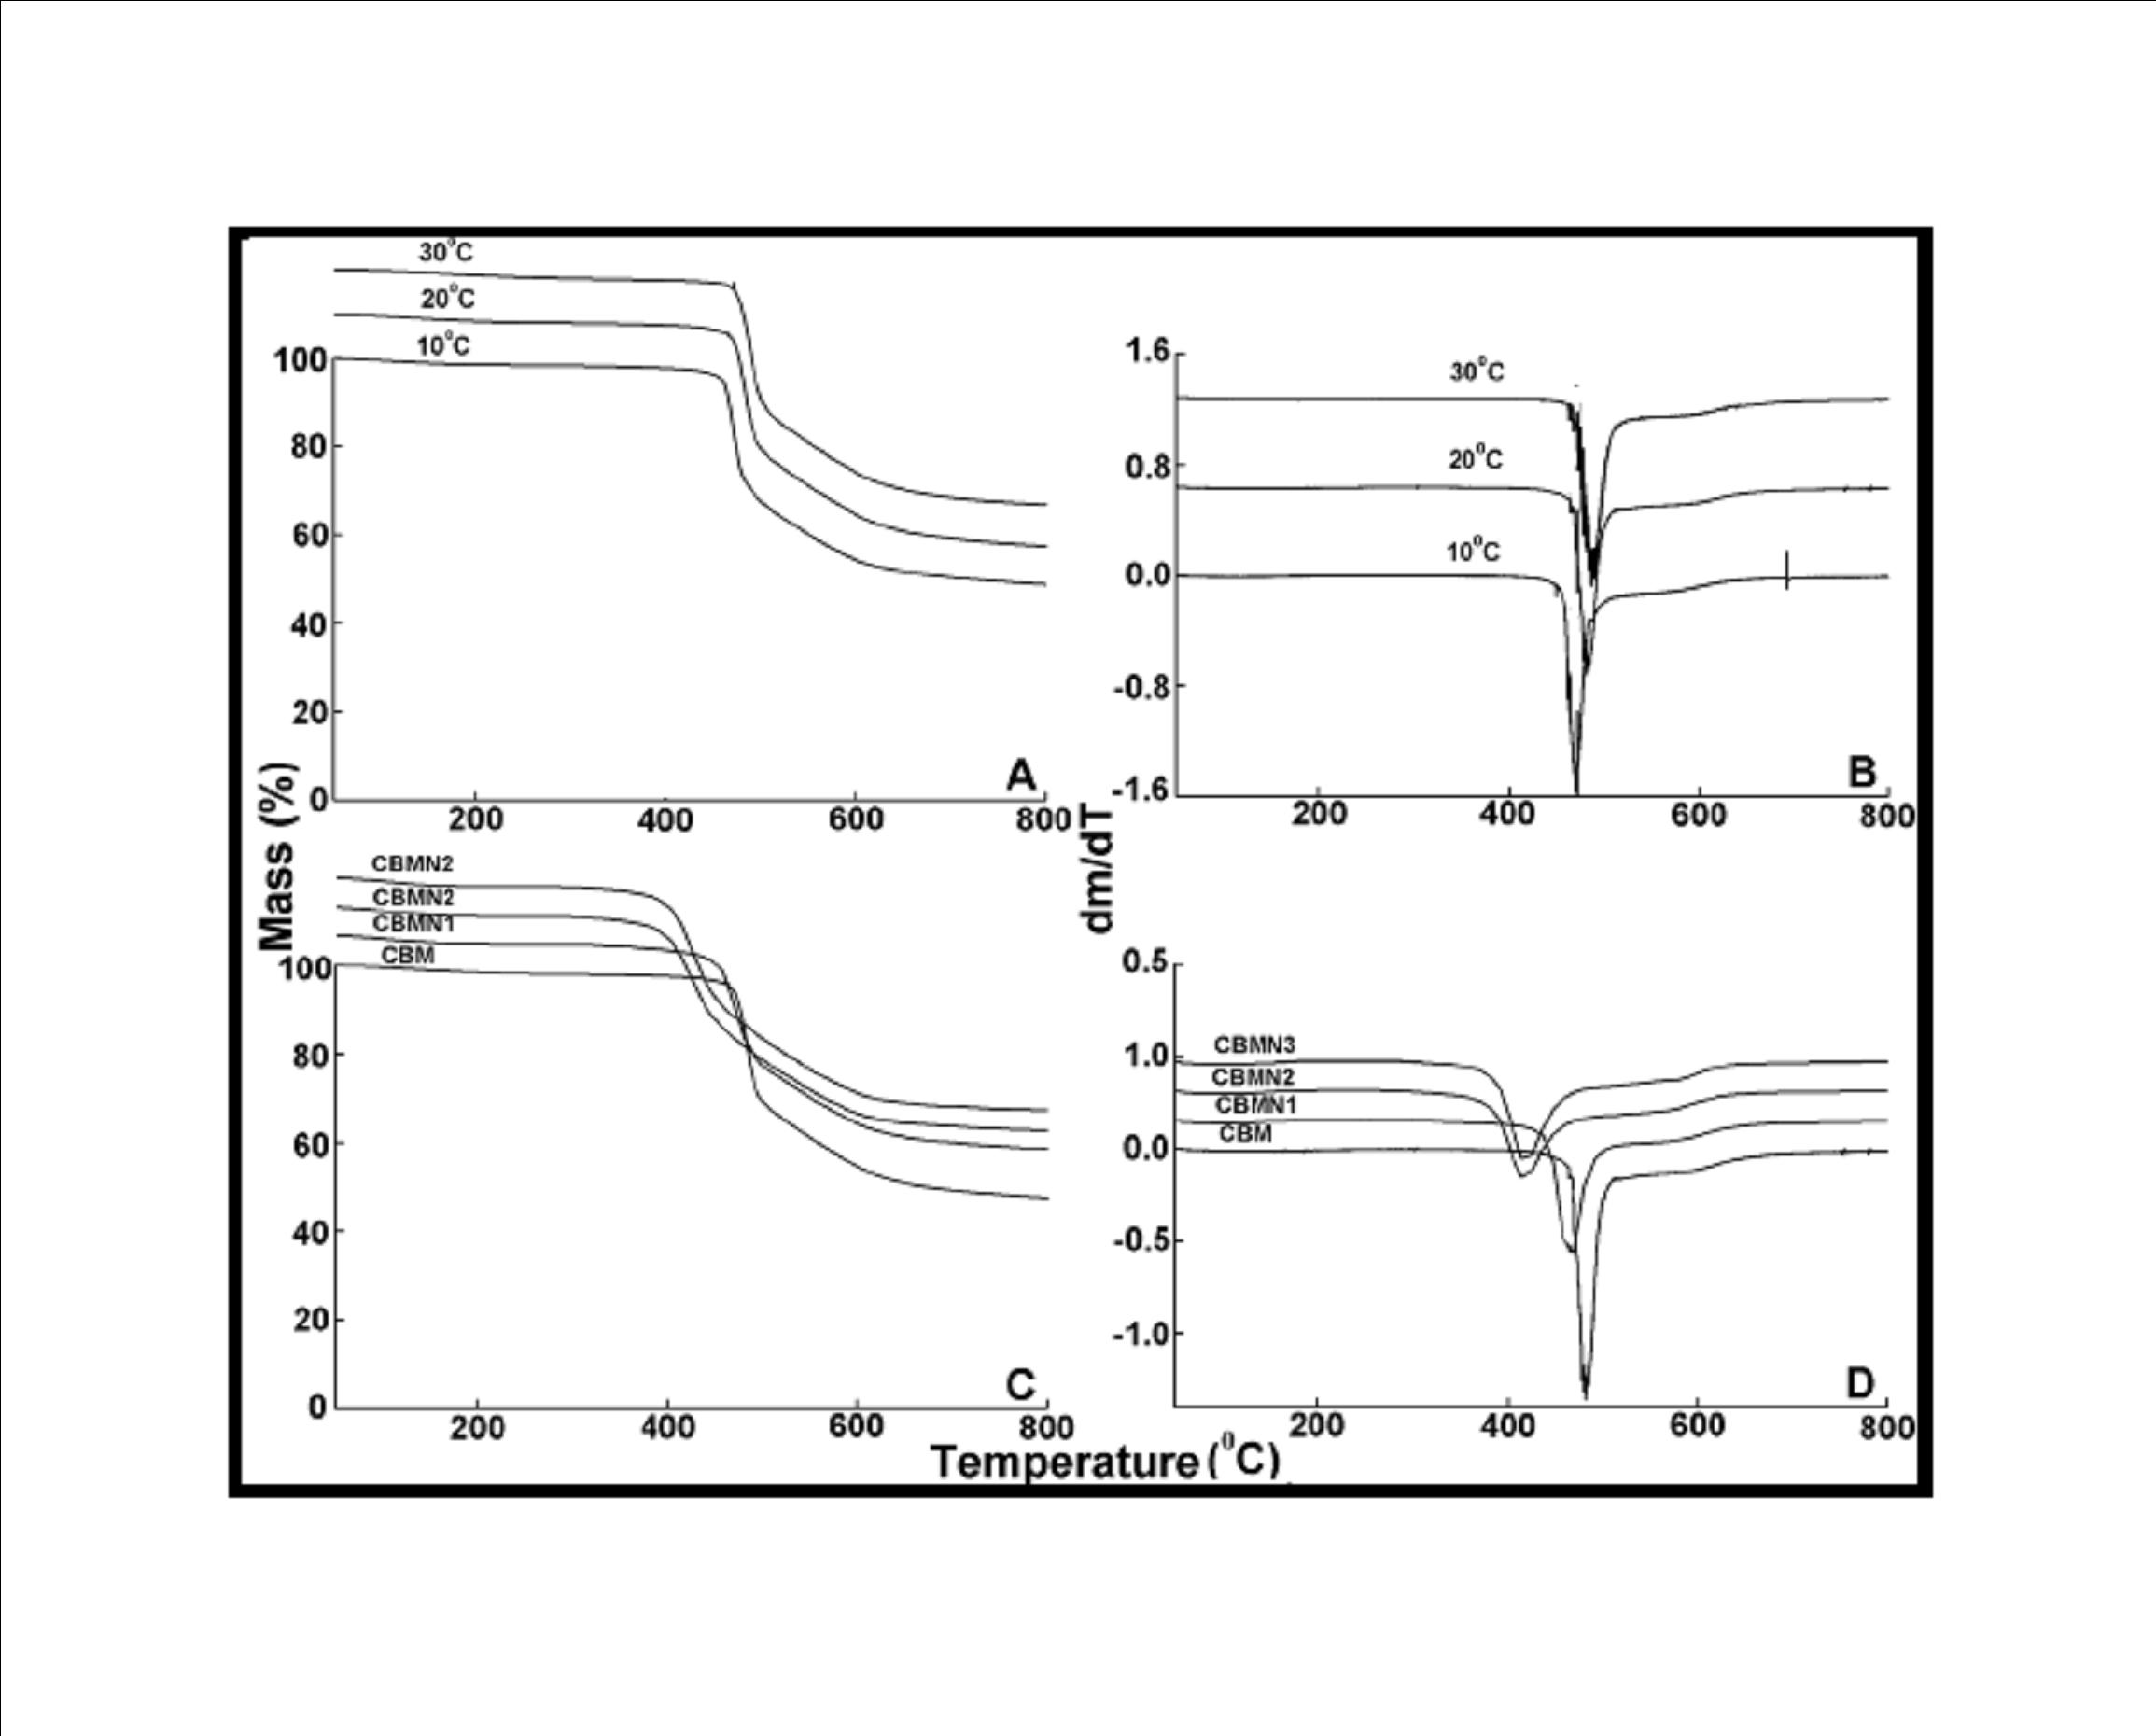
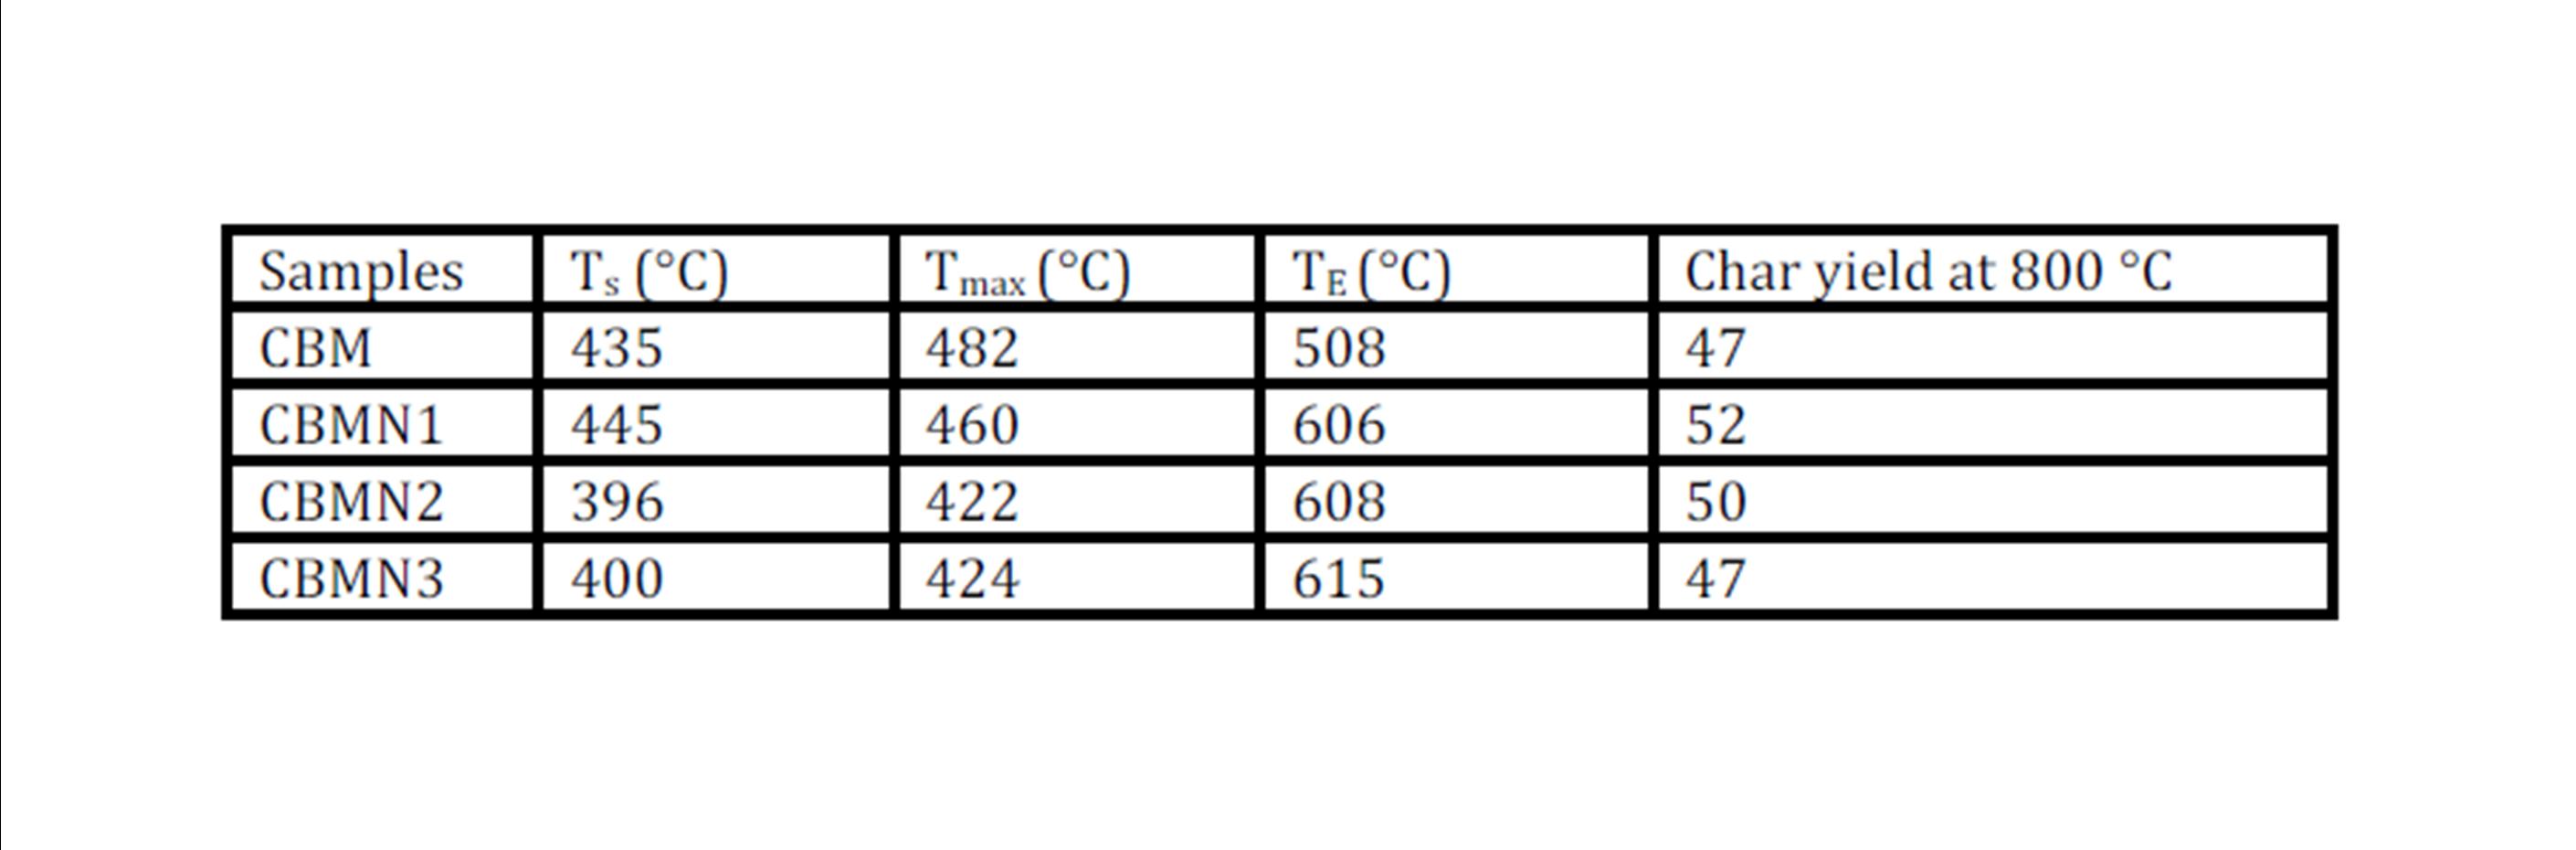
BMIM was prepared by the classic amic acid approach. Nanosilica particles were obtained in a very economical way from the largest available agricultural waste rice husk, and organic and chemical modifications were done in the nanosilica particles. The interaction existing between the nanosilica particles and BMIM was confirmed by FTIR studies. The curing studies of BMIM and its nanosilica blends were done by DSC analysis.  Nanosilica and modified nanosilica particles decrease the melting point, curing temperatures and enthalpy of curing of BMIM. This decrease in curing parameters may be due to the catalytic activity exhibited by the NS and modified NS particles, which can accelerate the curing process. The degradation temperatures of BMIM/nanosilica nanocomposites determined by TGA were lower than that of pure polyBMIM matrix. The thermal degradation products produced from the modified NS particles induced catalytic activity on the thermal degradation of polyBMIM matrix. This leads to decrease in the degradation temperature. The curing kinetics of BMIM and its nanosilica blends and the degradation kinetics of polyBMIM and its nanosilica nanocomposites were calculated using three model free kinetic methods KAS, FWO and FRD methods. The Ea values for the curing of NS reinforced BMIM increased as the extent of polymerization increased, but NSOM and NSCM reinforced BMIM show  higher Ea values at the initial stages of curing  but as the curing proceeds the Ea values decreased because of the catalytic activity exhibited by NSOM and NSCM particles. The trend in the variation of Ea values for the degradation of BMIM/nanosilica nanocomposites was more or less similar up to the reaction extent value 0.45.

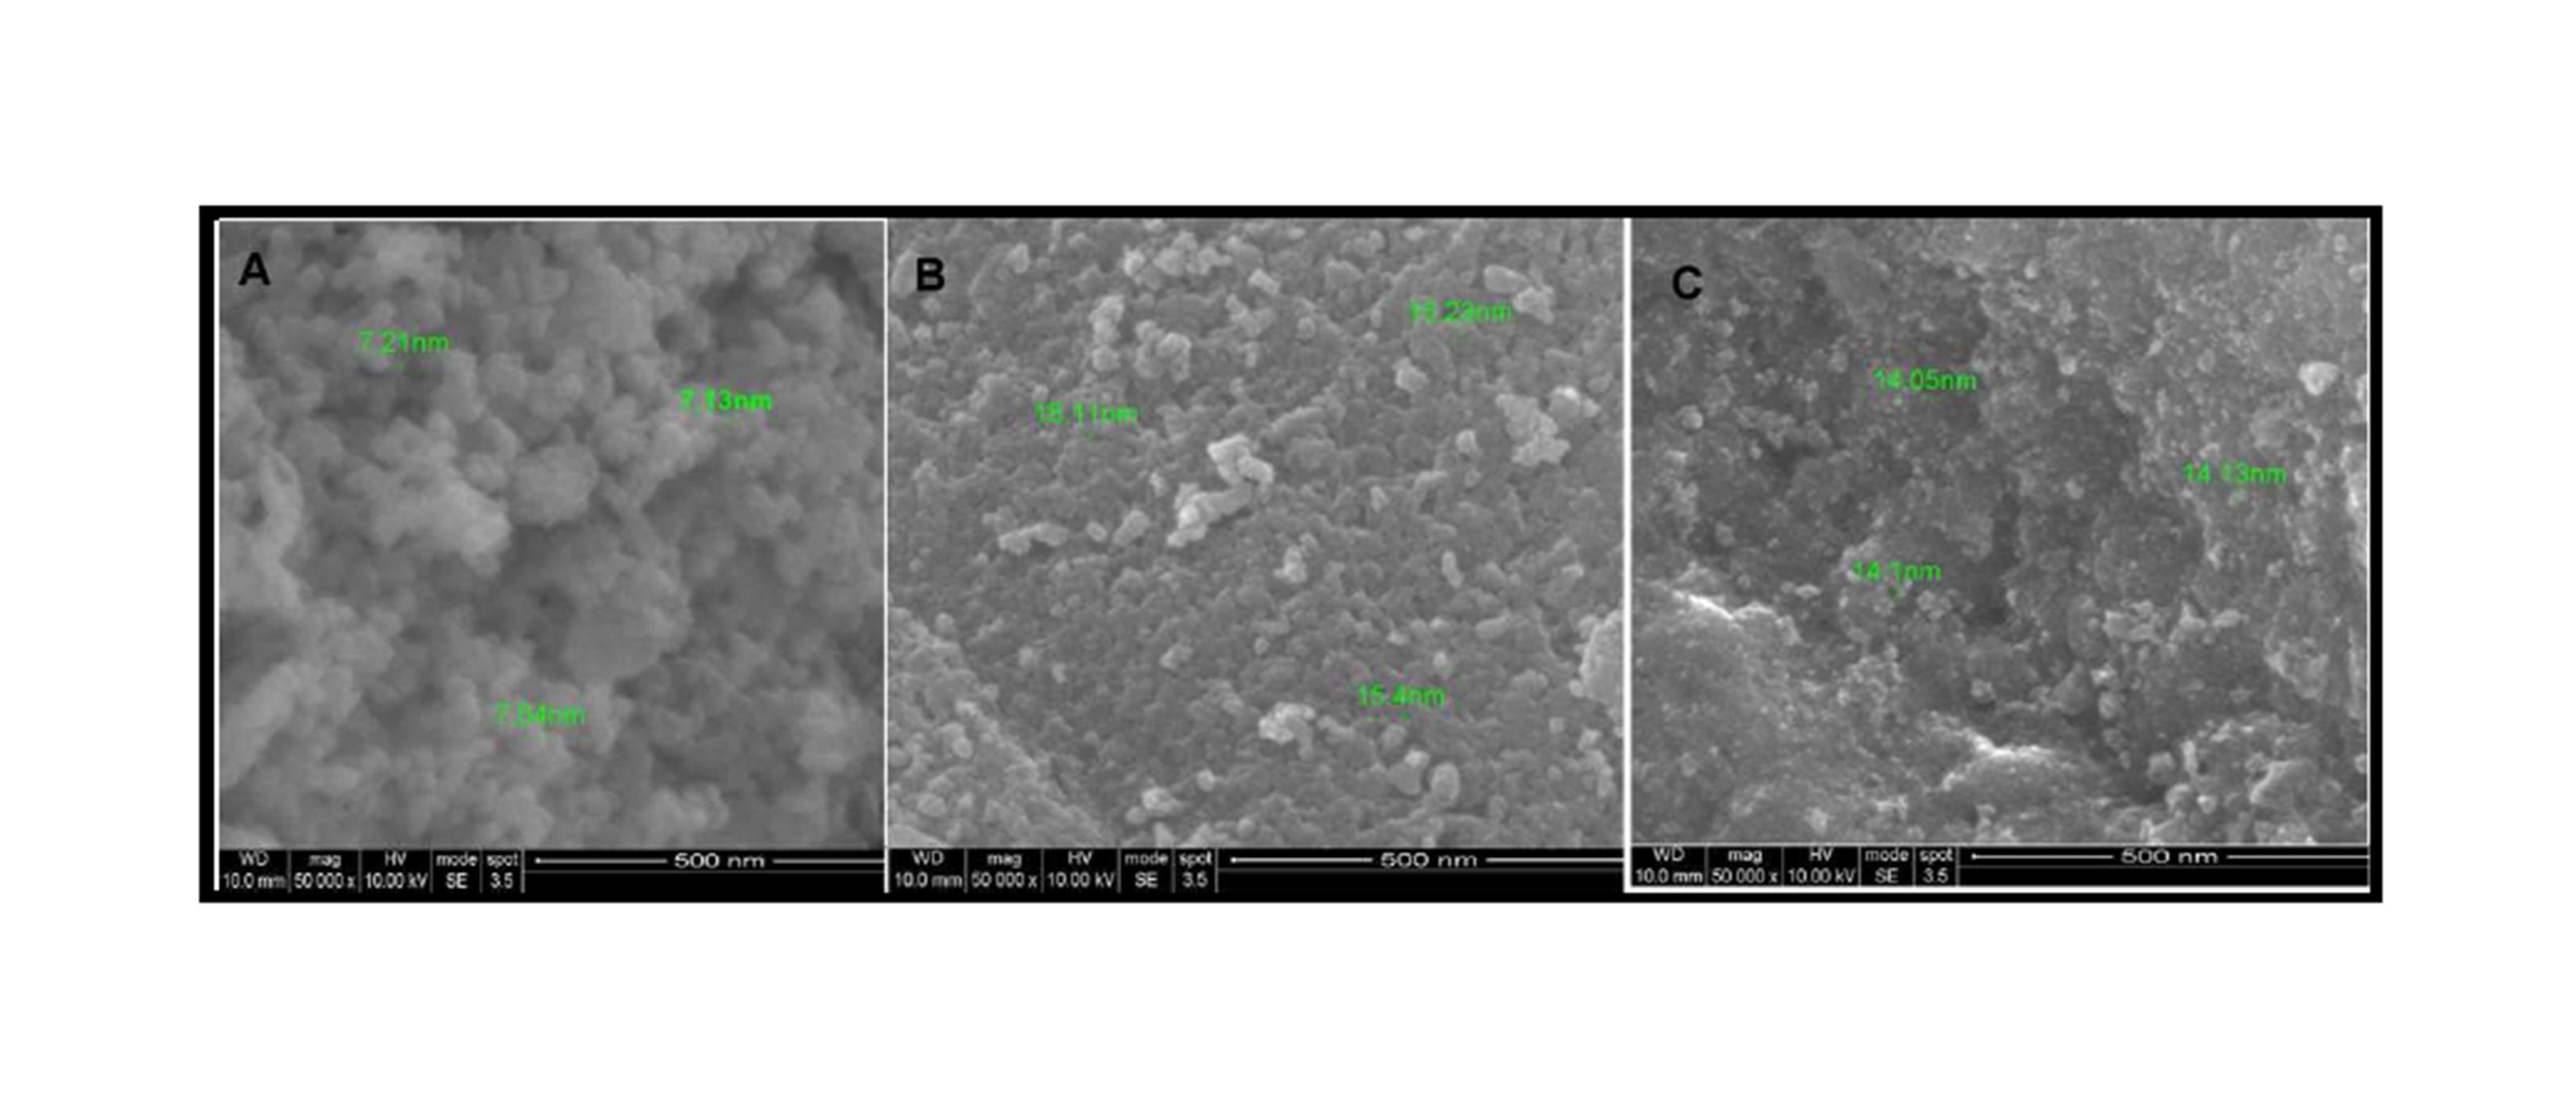
Afterwards, NS, NSOM particles restrict the molecular segmental movement of polyBMIM, leading the increase in Ea values. For NSCM reinforced system, the Ea values decreased because of physical and chemical changes took place in the chemical moieties present it. The SEM images of modified nanosilica particles reinforced BMIM matrix show broken surfaces and rough fractured strips indicating the improvement in the toughness of the nanocomposites.

Acknowledgements

The authors wish to express sincere thanks to the management and principal of the respective colleges for providing all facilities to do the work. The authors would like to thank the Directorate of Extramural Research & Intellectual Property Rights (ER&IPR), Defence Research & Development Organization, Ministry of Defence, Government of India, New Delhi-110 105 for financially supporting this work under the grant ERIP/ER/0704359/M/01/1101 dated 12-12-2008.

References

1.  Niasari,M.S. and  Ghanbari,D. (2009) ‘Polymeric nanaocompoaite materials,’ Inorganic Chimica Acta, 10(3), 351- 362.

2.  Vlasveld,D.P.N., Parlevliet,P.P., Berse,H.E.N. and Picken,S.J. (2005) ‘Fibre-matrix adhesion in glass-fibre reinforced polyamide-6 silicate nanocomposites,’ Composites, 36 (1), 1-11.

3. Legashetty, A.and Venkatraman, A. (2005) ‘Polymer nanocomposites,’ Resonance, 10 (7),   49-60.

4. Azeredo, H.M.C., Mattoso, L.H.C. and McHugh, T.H. (2009) ‘Nanocomposite edible films from mango puree reinforced with cellulose nanofibers,’ Journal of Food Science, 74 (5), N31-N35.

5. Hussain, F., Hojjati, M., Okamoto, M. and Gorga, R.E. (2006) ‘Review article: Polymer-matrix nanocomposites, processing, manufacturing and application: An overview,’ Journal of Composite Materials, 40 (17), 1511-1575.

6. Sarkawi, S.S. and Aziz, Y. (2003) ‘Ground rice husk as filler in rubber compounding,’ Journa Teknologi, 39(A), 135-148.

7. Habeeb, G.A. and Mahmud, H.B. (2010) ‘Study on properties of rice husk ash and its use as cement replacement material,’ Materials research, 13 (2), 185-190.

8. Yalcin, N. and Sevind, V. (2001) ‘Studies on silica obtained from rice husk,’ Ceramics International, 27 (2), 219-224.

9. De Sousa, A.M., Visconte, L., Mansur, C. and Furtado, C. (2009) ‘Silica sol obtained from rice husk ash,’ Chemical Techonology, 3(4), 371.

10. Sivaprasad, D. and Ramakrishna, A. (2010) ‘Fabrication and characterization of A356.2-rice husk ash composite using stir casting technique,’ Interanational Journal of Engineering  Science  and Technology, 2  (12), 7603-7608.

11. Tang, J.C., Yang, H.C., Chen, S.Y. and Chen-Yang, Y.W. (2007) ‘Preparation and properties of polyimide/silica hybrid nanocmoposites,’ Polymer Composites, 28(5), 575-581.

12. Chrissafis, K. (2009) ‘Kinetics of thermal degradation of polymers-complementary use of isoconversional and model fitting methods,’ J. Therm. Anal. Calorim., 95 (1), 273-283.

13. Kissinger, H.E. (1957) ‘Reaction kinetics in differential thermal analysis,’ Analytical Chemistry, 29(11),  1702-1706.

14. Akahira, T. and Sunose, T. (1971) ‘Method of determining activation deterioration constant of electrical insulating materials,’ Res.Report, Chiba.Inst.Technol. (Sci.Technol.), 16, 22-31.

15. Ozawa, T. (1965) ‘A new method of analyzing thermogravimetric data,’ Bull. of the Chemical Society of Japan,  38(11), 1881-1886.

16. Flynn J.H. and Wall, L.A. (1966) ‘A quick, direct method for the determination of activation energy from thermogravimetric data,’ Polymer Letters, 4(5), 323-328.

17. Flynn, J.H. and  Wall, L.A. (1966) ‘General treatment of the thermogravimetry of polymers,’  Journal of Research of the National Bureau of Standards Physical Chemistry, 70A(6), 487-523.

18. Friedman, H.L. (1964). ‘Kinetics of thermal degradation of char-forming plastics from thermogravimetry. Application to a phenolic plastic,’ Journal of Polymer Science Part C-Polym.Symp., 6(1), 183-195.

19. Yao, F., Wu, Q., Lei, Y., Guo, W. and Xu, Y. (2008) ‘Thermal decomposition kinetics of natural fibres: Activation energy with dynamic thermogravimetric analysis,’ Polymer Degradation Stability, 93(1), 90-98.

20. Thuadij, N. and Nuntiya, A. (2008) ‘Preparation of nanosilica powder from rice husk ash by precipitation method,’ Chiang Mai.Journal of Science, 35(1), 206-211.

21. Awizar, D.A., Othman, N.K., Jalar, A., Daud, A.R., Rahman I.A. and Harden, N.H.A. (2013) ‘Nanosilicate extraction from rice husk ash as green corrosion inhibitor,’ International Journal of Electrochemical Science, 8(2), 1759-1769.

22. Rafiee, E., Shahebrahimi, S., Feyzi, M. and Shaterzadeh, M. (2012) ‘Optimization of synthesis and characterization of nanosilica produced from rice husk ( a common waste material),’  International Nanoletters, 2(29), 1-5.

23. Theivasanthi, T. and Alagar, M. (2010) ‘X-ray diffraction studies of copper nanopowder,’ Archives of Physics Research, 1(2),  112-117.

24. Liu, W., Wu, L., Tian, X., Zheng, J., Cui, P., He, A. and Zhu, C. (2010) ‘Morphology studies of poly(ethylene terephthalate)/ silica nanocomposites,’ Polymer Bulletin, 65(2), 133-143.

25. Hussain, M.F., Chen, J. and  Hojjati, M. (2007) ‘Epoxy-silicate nanocomposites: Cure monitoring and characterization,’ Material Science and Engineering-A, 445-446, 467-476.

26. Surender, R., Mahendran, A., Thamaraichelvan, A., Alam, S. and VIjayakumar, C.T. (2013) ‘Curing studies of bisphenol a based bismaleimide and cloisite 15a nanoclay blends using differential scanning calorimetry and model-free kinetics,’ Journal of Applied Polymer Science, 128 (1), 712-724.

27. Surender, R., Mahendran, A.R., Alam, S. and Vijayakumar, C.T. (2013) ‘Indane-based bismaleimide and cloisite 15a nanoclay blends: Kinetics of thermal curing and degradation of particulate nanocomposites,’ Polymer Composites, 34(8), 1279-1297.

28. Ghaemy, M. Bazzar, M. and  Mighani, H. (2011) ‘Effect of nanosilica on the kinetics of cure reaction and thermal degradation of epoxy resin,’ Chinese Journal of Polymer Science, 29 (2), 141-148.

29. Gabilondo, N., Lopez, M., Ramos, J.A., Echeverria, J.M. and Mondragon, I. (2007) ‘Curing kinetics of amine and sodium hydroxide catalyzed phenol-formaldehyde resins,’ Journal of Thermal Analysis and Calorimetry, 90(1),   229-236.

30. Guigo, N., Mija, A., Vincent L. and Sbirrazzuble, N. (2007) ‘Chemorheological analysis and model-free kinetics of acid catalysed furfuryl alcohol polymerization,’ Physical Chemistry Chemical Physics, 9(39), 5359-5366.

31. Jiasheng, Q. and Pingsheng, H.E. (2003) ‘Non-isothermal crystallization of HDPE/nano-SiO2 composite,’ Journal of Materials Science, 38(11), 2299-2304.

32. Sheng, X., Akinc. M. and Kessler, M.R. (2008) ‘Cure kinetics of thermosetting bisphenol E cyanate ester,’ Journal of Thermal Analysis and Calorimetry, 93(1), 77-85.

33. Satheesh Chandran, M., Krishna, M., Rai, S., Krupashankara M.S. and Salini, K. (2012). ‘Cure Kinetics and activation energy studies of modified bismaleimide resins,’ ISRN Polymer Science, 2012,   13-21.

34. Zhou, T., Wang, X., H.Liu, X., and Lai, J.Z. (2010) ‘Effect of silane treatment of carboxylic-functionalized multi-walled carbon nanotubes on the thermal properties of epoxy nanocomposites,’ eXPRESS Polyme Latters, 4 (4), 217-226.

35. Rajamani, D., Surender, R., Alam, S., Muthusubramanian S.  and Vijayakumar, C.T. (2013) ‘Bismaleimide/rice husk silica blends-kinetics of curing by DSC,’ Science Jet, 2, 40-44.

36. Surender, R., Mahendran, A., Thamaraichelvan, A., Alam S. and Vijayakumar, C.T. (2013) ‘Model free kinetics-Thermal degradation of bisphenol A based polybismaleimide-closite 15a nanocomposites,’ Thermochimca Acta, 562(20),   11-21.

37. Vijayakumar, C.T., Thenmozhi, K., Surender, R., Sivasamy, P. and Alam, S. (2012) ‘Degradation kinetics of bismaleimide – natural clay composites,’ Science Jet, 17,  1-6.

38.  Sivasamy, P., Meenakshisundaram, M. and Vijayakumar, C.T.  (2003) ‘A study on the effect of para substitution on the thermal degradation of poly N-arylmaleimides,’ Journal of Analytical and Applied Pyrrolysis, 68-69, 51-59.

39. Torrecillas, R., Regnier, N. and  Mortaigne, B. (1996) ‘Thermal degradation of bismaleimide and bisnadimide networks – products of thermal degradation and type of crosslinking points,’ Polymer Degradation and Stability, 51(3), 307-318.

40. Xie, W., Pan, W.P. and  Chung, K.C. (2001) ‘Thermal Characterization of PMR polyimides,’ Thermochimca Acta,  367 -368, 143-153.

41. Chrissafis, K., Paraskevopoulos, K.M., Pavlidou, E. and Bikiaris, D. (2009) ‘Thermal degradation mechanism of HDPE nanocomposites containing fumed silica nanoparticles,’ Thermochimica Acta, 485(1), 65-71.

42. Rajamani, D., Surender, R., Mahendran, A., Muthusubramanian S. and Vijayakumar, C.T. (2013) ‘Bismaleimide rice  husk  silica reinforced composites: Synthesis and thermal degradation studies,’ Journal of Thermal Analysis and Calorimetry, 114(2), 883-893 .


Shares