Introduction
Although obesity has reached epidemic proportions world-wide (WHO, 2003), very few studies have explored the implications of obesity history in older adults. As of now, prospective studies have shown an association between the numbers of years lived with obesity and mortality (Abdullah et al., Janssen and Bacon, 2008, Shimazu et al., 2009), mobility (Stenholm et al., 2007), and risk of type 2 diabetes (Abdullah et al., 2010, Bouchard et al., 2013b) in older adults. Together these results suggest that obesity history is a significant predictor of mortality and morbidity risk. However, the clinical implications of obesity history remain unknown. Precisely for older women, it is unknown if being obese before or after menopause as different impacts on health and physical capacity outcomes.
Menopause (mean age 50) is a critical period for women characterized by an increase in fat mass, central adiposity, and body mass (Panotopoulos et al., 1997, Simkin-Silverman and Wing, 2000). As a consequence, a good majority of women will become obese right after the menopause transition. Newly postmenopausal obese women may present different health risk factors and physical capacity compared to postmenopausal women who have been obese for a much longer period of time. If that is the case, it means that obesity history would have to be considered when implementing strategies to reduce body mass in older women.
We performed this study aiming to determine if women who were obese before menopause present different health risk factors and physical capacity after menopause compared to women who were classified as being obese only after menopause. The second objective was to characterise women with different obesity history.
Methods
Participants
Thirty-seven obese postmenopausal women were recruited through public advertisements including journal placements, billboards in physician waiting rooms, and pharmacies. Statistical power was not generated to determine the number of women recruited as this was a pilot study. Time and budget have determined the number of participants. Criteria for inclusion were: age 60 years or over, currently obese (body mass index ≥ 30 kg/m2), experienced a natural menopause, (≥ 1 year without menses), menopause at age 50 ± 2 years, and not currently using or not having used hormone replacement therapy in the last six months.
Overview of the Protocol
Women were asked to come for a four-hour visit at our facility after fasting for 12 hours. The visit was divided in two parts. During the first part of the visit, the participants read and signed the written consent form approved by the University Research Ethics Board. The research staff took various clinical measures at fasting level including a blood sample, resting metabolic rate, anthropometric measures, blood pressure, and body composition. Thereafter, a continental breakfast was offered to each participant. During the second part of the visit, physical capacity using the Senior Fitness battery test was measured. Subsequently, the participants filled out a series of questionnaires in the presence of a research assistant. These questionnaires aimed at collecting information regarding their menopause (e.g., symptoms), weight loss history (e.g., weight loss attempts). After the visit, women were asked to wear a pedometer for seven consecutive days and record the number of steps each day. Participants were asked to mail the results and the equipment along with their most recent list of medication provided by their pharmacist.
Obesity History
Obesity history was evaluated using the weight history questionnaire, which included three questions of interest for this study (National Health and Nutrition Examination Survey., 2009): 1- How tall were you without shoes at the age of 21? 2- What was your weight at menopause when you were not pregnant? Body Mass Index (BMI) was then calculated at menopause years using the mean height between the self-reported height at age 21 years and the current measured height (kg/m2) to overcome some of the variability in self-reported reported height (McAdams et al., 2007) and adjust for height reduction associated with aging (Dey et al., 1999). If BMI was ≥ 30 kg/m2 at menopause years, women were categorized as being obese before menopause. If BMI was <30kg/m2, women were categorized as obese after menopause. Menopause was used because as the thresholds since it is before the natural menopause period for the majority of women (Belisle et al., 2006) and there is a validated questionnaire to capture weight and height at menopause (National Health and Nutrition Examination Survey., 2009).
Clinical Measures
Blood samples were obtained after an overnight fast (12 h). Fasting total cholesterol, HDL-cholesterol, LDL-cholesterol, triglycerides, and glucose levels were analysed. Resting Metabolic Rate (RMR) was measured following standard procedures as previously described (Compher et al., 2006). Respiratory gases were measured using a canopy and an indirect metabolic cart (VMax Medical Graphics Corporation, St Paul, MN). Daily RMR (kcal/day) based on the Siri equation (Siri, 1993) was recorded. Blood pressure was measured after being in a sitting position for at least five minutes by a validated automatic device (Omron, Model HEM711). The average of two readings was used for analyses. Body composition including fat mass, lean body mass, and bone mass, was performed using dual energy X-ray absorptiometry (DXA, GE Prodigy Lunar Radiation Corp, Madison, WI). When a woman’s body mass exceeded the apparatus size for accurate measurement, a half scan was performed using the right side according to the standard procedure (Rothney et al., 2009). In our laboratory, the correlation between both sides was high (r=0.97) and similar to what is reported in the literature (Rothney et al., 2009). Body mass was measured to the nearest 0.1 kg on a calibrated scale (SECA, Hambourg, Germany), and height was obtained with a standard stadiometer (Takei, Tokyo, Japon). Waist and hip circumferences were measured as suggested by the Canadian Society for Exercise Physiology (US National Institutes of Health., 1998).
Physical capacity was measured with a set of validated physical tasks in postmenopausal adults to estimate aerobic endurance, strength, flexibility, power, and balance. Aerobic endurance was measured with the use of the six-minute walk test (Beriault et al., 2009). Strength was measured by asking women to lift a five-pound free weight as many times as possible in 30 seconds (Rikli and Jones, 2013). Flexibility was measured with the use of the sit-and-reach test (Rikli and Jones, 2013). Power was measured by asking women to stand up from a chair as many times as possible in 30 seconds (Jones et al., 1999). Finally, balance was measured using the one leg stance test (Iverson et al., 1990) that consisted of holding balance on one foot for a maximum of 30 seconds.
Lifestyle Information
Fruit and vegetable portions were reported using the Short Form Food Frequency Questionnaire (Andersen et al., 2002). The specific question was: On average, how many portions of fruit and vegetable do you eat a day? Hours of sleep were reported by asking: How many hours you normally sleep per night? Smoking history and alcohol intake were reported using the same questions used in the National Health and Nutrition Examination Survey (National Center for Health Statistics). Women were categorized as former smokers if they were not currently smoking, but had smoked more than 100 cigarettes in their life, and non-smokers if they smoked less than this amount. Alcohol intake was calculated based on mean number of reported alcoholic drinks per day. Finally, participants were asked to monitor seven consecutive days of physical activity with the use of a pedometer (Stepcounts, Ontario). Subjects were also instructed to log all physical activities lasting 10 minutes or more in duration. No instructions regarding the type, duration, or intensity were given. The pedometer was worn on the waist, while they were awake, and number of steps was recorded each day.
Questionnaires
The menopause experience was reported with the menopause-specific quality of life questionnaire (Hilditch et al., 1996). Part of the questionnaire includes an open question in which women have to indicate the main reason why they think they have accumulated extra body mass over time. The possible answers were physical activity, stress, medication, menopause, pregnancy, or others. Women were also asked to report at what age they clinically reached menopause, whether either 12 consecutive months without menses or were medically diagnosed (Gracia et al., 2005). Number and type of medications were recorded based on the copy of the current medications obtained by the participants through their pharmacist. Thereafter, medications were analyzed based on their effects on diabetes, blood pressure, cholesterol, and, depression/anxiety. The total number of medications was also recorded.
Statistical Analyses
Data management and statistical analyses were performed using SPSS version 17.0 (SPSS Inc, Chicago, IL). Normality of variables was tested by the Shapiro Wilk test. Results are reported as mean ± standard deviation (SD) for normally distributed variables, and as median (25th-75th percentiles) for variables not normally distributed. N (%) was used to report categorical variables. The differences on health and physical capacity were evaluated with independent T-tests, Mann-Whitney, or chi-square, as deemed appropriated. General linear model were used to identify if obesity history (0 or 1) was associated to health outcomes and physical capacity. Analyses were adjusted for body mass when evaluating general characteristics and body composition. When evaluating metabolic profile, analyses were additionally adjusted for medication usage. Because body mass and BMI were significantly different between the two obesity history groups and because of the small sample, a sub-sample matched for BMI (±1 kg/m2) was analysed to supplement our findings. It was possible to match 12 participants (six from each group).
Results
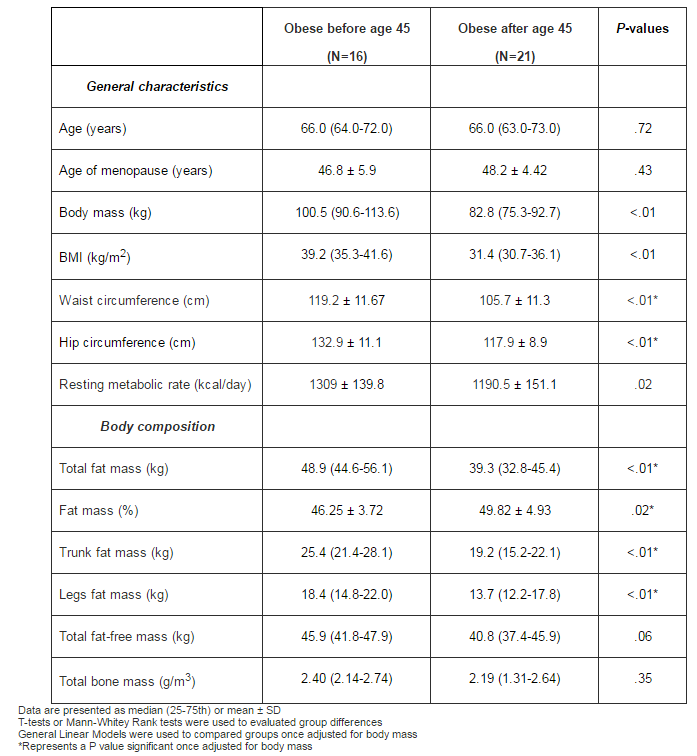
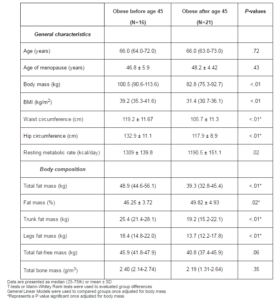
As shown in Table 1, no difference was observed between current age and age of menopause between the two groups. Women obese before menopause were 18% heavier (P<.01), had a waist circumference and a hip circumferences 11% wider (both P<.01), and had a resting metabolism 10% higher (P=.02) compared with women who were obese after menopause. Similarly, women who were obese before menopause presented more absolute and relative fat mass (P<.02), trunk fat mass (P<.01), and leg fat mass (P<.01) while no difference between the groups was observed for fat-free mass and bone mass. Once adjusted for body mass, the observed differences remained significant for waist circumference, hip circumference as well as all fat mass measures (P<.05).
Table 1: Description of the Sample and Body Composition
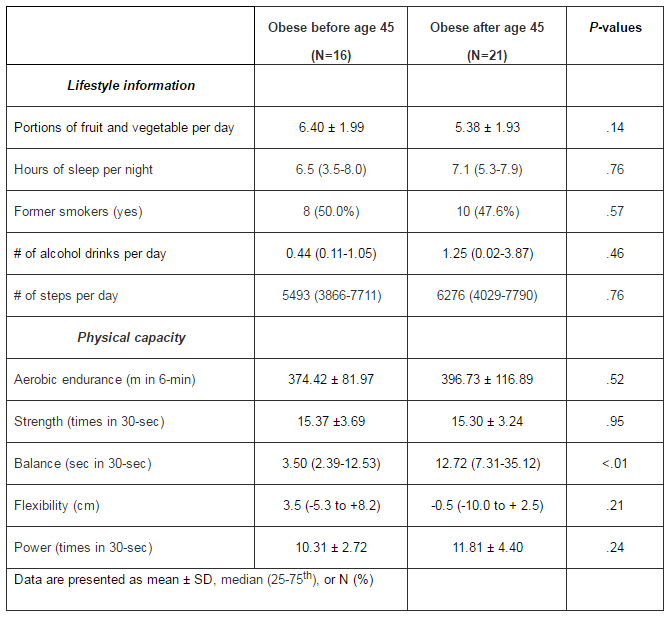
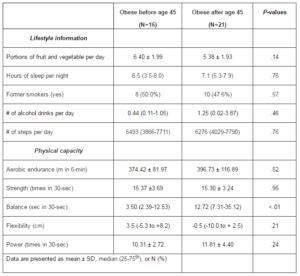
No significant differences were observed between the two groups for nutrition, sleeping behavior, history of smoking, alcohol consumption, and physical activity level (Table 2). However, in terms of physical capacity, the ability to maintain balance on one foot was 4-fold lower in women who were obese before menopause (3.5 seconds) compared to women obese after menopause (12.7 seconds; P<.01). All other physical capacity test results were not significantly different between the two groups.
Table 2: Lifestyle and Physical Capacity
Women obese before menopause reported stress as the main reason of their current obesity level (Figure 1), but not reach significance. On the other hands, women obese after menopause reported exercise as the main reason of their obesity status (P<.01).
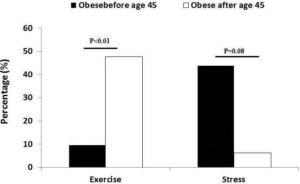
Figure 1. Main Reason Reported Why Currently Obese Difference between Groups Was Measured by Chi-square Tests
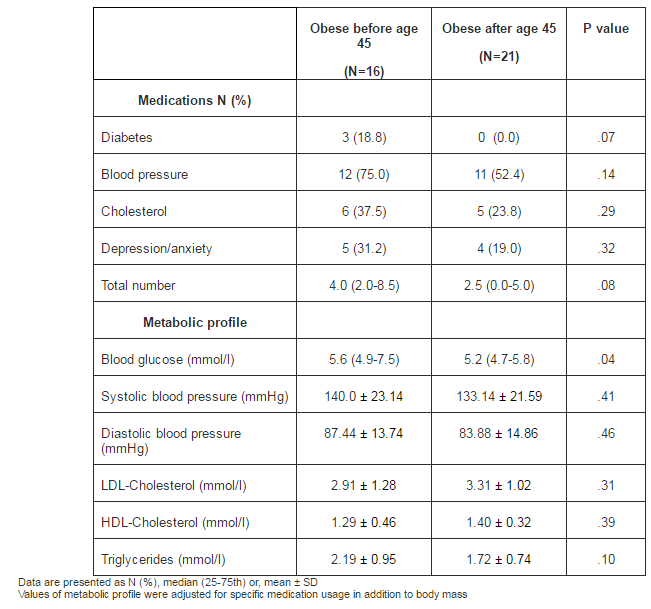
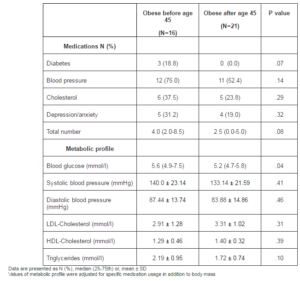
Women obese before menopause reported a greater use of overall medications to treat diabetes, blood pressure, cholesterol, and depression/anxiety (Table 3). However, differences were not significant. In terms of the metabolic profile, with the exception of LDL-cholesterol, women who were obese before menopause presented a lower metabolic profile, but only fasting glucose was significantly (P=.04) different compared with women who were obese after menopause.
Table 3: Medications and Metabolic Profile
A sub-sample of participants (six women obese after menopause and six women obese before menopause) was matched for BMI and similar results were observed. For example, fasting blood glucose was significantly higher in women obese before menopause compared to women obese after menopause (7.2 mmol/l vs. 5.1 mmol/l; P=.01). In addition, a 10 cm greater waist circumference (124.3 cm vs. 114.1 cm; P=.08) and a three-fold lower balance performance (3.8 sec vs. 10.8 sec; P=.07) were observed in women obese before menopause compared to women obese after menopause without reaching significance.
Discussion
The main objective of this study was to determine if health risk factors and physical capacity were different in postmenopausal obese women with different obesity history. The present results show that postmenopausal obese women who were obese for a longer period are heavier, and presented a different profile of body fat distribution. In addition, these women have less balance, and have higher blood glucose level compared with postmenopausal women who only been obese after the menopause transition. In addition, this study bring novel insights for the obesity management of older women by showing that women obese after menopause believe that lack of physical activity is the main reason why they are currently obese. Taken together, our results reinforce the notion that obesity history as an impact on postmenopausal women and should be taken into consideration. However, some health risk factors and physical capacity results were not different between groups. Because of the small sample, it will be important to test the same hypothesis with a large sample to confirm our results.
Postmenopausal women who were obese before menopause presented a greater waist circumference, hip circumference, greater leg and trunk fat mass even once adjusted for body mass difference between the groups. These differences might explain why postmenopausal women obese before menopause presented a higher glucose level, as glucose level is strongly associated with waist circumference (Klein et al., 2007). Since body fat distribution, and, more specifically, trunk fat mass, are strongly associated with metabolic health (Van Pelt et al., 2002), it is suggested that postmenopausal women obese before menopause presented a higher risk for future metabolic disorders. This is supported by a study that reported that weight history may contribute to our understanding why some postmenopausal obese individuals are free from metabolic risk factors, while other display risk factors (Alley and Chang, 2007). While weight loss benefits in older adults are still debated (Witham and Avenell, 2010), exercise on the other hand is promoted regardless of weight loss because it is independently associated with significant changes in body fat distribution (Lee et al., 2005, Ross et al., 2004). This cross-sectional study shows that postmenopausal women who were obese for a longer period were 17.7% heavier than postmenopausal women who were newly obese. The observed difference has important implications in terms of lifestyle modifications in order to lose weight or improve functions and health outcomes. First, it is known that women with a higher level of obesity at baseline will lose more weight during the intervention (Teixeira et al., 2004). Second, women that are heavier at baseline may be less interested in interventions involving exercise as body mass is strongly associated with mobility issues (Bouchard et al., 2009a, Bouchard et al., 2007, Davison et al., 2002), pain (Lake et al., 2000), and osteoarthritis (Coggon et al., 2001).
In general, physical capacity has been negatively associated with body mass (Bouchard et al., 2009b, Bouchard et al., Visser, 2011, Visser et al., 1998). Therefore, it was not surprising to observe low values for all tested physical capacity measures in this study. In fact, for both groups, median values for most measures were below the threshold considered as ‘optimal’ (Briggs et al., 1989, Rikli and Jones, 2013), with the exception of flexibility and muscle strength. These results show that all postmenopausal obese women would benefit from a treatment to improve physical capacity regardless of obesity history. The only difference identified between the two obesity history groups was on the balance test where the postmenopausal women who were obese before menopause were only able to stay on one foot for a median time of three seconds compared to thirteen seconds for the other group. This difference remained even after adjusting for body mass or total reported medications. Again, despite a significant difference between the two groups, our results suggest that postmenopausal obese women would benefit from a program that aimed to improve balance as they were, for the most part, below the suggested threshold of 24 seconds that increases risk of falls (Briggs et al., 1989). However, because postmenopausal obese women who were obese before menopause transition were performing 76% less time on the balance test they might benefit even more from such programs that aim to improve balance. This result is in line with a study that reported in a large sample size (n=4,000) of older adults a greater risk of walking limitations in individuals obese since the age of 30 (nine times more likely) compared to individuals obese since the age of 50 (four times more likely) (Stenholm et al., 2007).
Women who were obese before menopause did not report that lack of exercise was the main reason why they were currently obese. Therefore, these participants might not be interested to participate in an intervention aiming to increasing physical activity level as a strategy to reduce body mass compared with the other group of women. The fact that women who were obese after menopause reported the lack of exercise as the main reason why they were currently obese, even if the number of steps was below recommendation, can be interpreted in at least two ways. First, women who became obese after menopause are conscious that exercise might be part of the reason why they became obese and realize that they should be more active because of a shift in physical activity level since menopause (Evans and Racette, 2006). However, because of the cross-sectional nature of this study, it is possible that women who were obese before menopause do not see lack of exercise as a major cause of their obesity because they were inactive before and after the menopause period. Second, it is possible that women who were obese before menopause have been inactive before menopause and do not feel that exercise is part of the reason why they became obese.
Potential Clinical Implications
Because obesity history seems to have an impact on the characteristics of post-menopausal women, it means that 57% of postmenopausal women who are currently trying to lose weight (Serdula et al., 1999, Weiss et al., 2007) may respond differently to a conventional weight loss strategies. Future studies will need to determine if obesity history has an impact on the response to a lifestyle modification program aiming to reduce body weight.
Study Limitations
Despite the novel results arising from this study, an important limitation requires mention. Obesity history was based on self-reported BMI at menopause. First, obesity history was based on self-reported height and weight has and it is known that a large variation exists when compared with objective measure (Gorber et al., 2007).Second, because an arbitrary cut-off of menopause was used to determine obesity history, it might not represent specific duration of obesity, but with the average age of menopause around 50, it seems like the optimal age to determine obesity history in women without the influence that menopause has on body mass changes. Third, the small sample precludes adjustments for confounder variables and it restricted the number of women to be paired in the sub-group analyses matched for BMI. Finally, Information regarding diet and physical activity could be strengthened by using valid measures such as three-day diary log and accelerometers. However, the present study addresses an important public health concern, and is strengthened by valid and reliable methods to evaluate body composition, metabolic health, and physical capacity.
Conclusion
Our study suggests that obesity history affects some health factors and physical capacity of postmenopausal obese women. In addition, this study shows that lack of exercise is report as the main reason why older women feel they became obese after menopause. Further studies may want to investigate the impact of obesity history on the response to a weight loss program.
References
Abdullah, A., Stoelwinder, J., Shortreed, S., Wolfe, R., Stevenson, C., Walls, H., de Courten, M. & Peeters, A. (2010). “The Duration of Obesity and the Risk of Type 2 Diabetes,” Public Health Nutrition, 14, 119-26.
Publisher – Google Scholar
Abdullah, A., Wolfe, R., Stoelwinder, J. U., de Courten, M., Stevenson, C., Walls, H. L. & Peeters, A. (2013). ”The Number of Years Lived with Obesity and the Risk of All-Cause and Cause-Specific Mortality,” The International Journal of Epidemiology, 40, 985-96.
Publisher – Google Scholar
Alley, D. E. & Chang, V. W. (2007). “The Changing Relationship of Obesity and Disability,1988-2004,” JAMA, 298, 2020-7.
Publisher – Google Scholar
Andersen, L. F., Johansson, L. & Solvoll, K. (2002). “Usefulness of a Short Food Frequency Questionnaire for Screening of Low Intake of Fruit and Vegetable and for Intake of Fat,” European Journal of Public Health, 12, 208-13.
Publisher – Google Scholar
Belisle, S., Blake, J., Basson, R., Desindes, S., Graves, G., Grigoriadis, S., Johnston, S., Lalonde, A., Mills, C., Nash, L., Reid, R., Rowe, T., Senikas, V., Senikas, V. & Turek, M. (2006). “Canadian Consensus Conference on Menopause, 2006 Update,” Journal of Obstetrics and Gynaecology Canada, 28, S7-S94.
Publisher – Google Scholar
Beriault, K., Carpentier, A. C., Gagnon, C., Menard, J., Baillargeon, J. P., Ardilouze, J. L. & Langlois, M. F. (2009). “Reproducibility of the 6-Minute Walk Test in Obese Adults,” International Journal of Sports Medicine, 30, 725-7.
Publisher – Google Scholar
Bouchard, D. R., Beliaeff, S., Dionne, I. J. & Brochu, M. (2007). “Fat Mass but not Fat-Free Mass is Related to Physical Capacity in Well-Functioning Older Individuals: Nutrition as a Determinant of Successful Aging (NuAge)–the Quebec Longitudinal Study,” The Journals of Gerontology Series A: Biological Sciences and Medical Sciences, 62, 1382-8.
Publisher – Google Scholar
Bouchard, D. R., Dionne, I. J. & Brochu, M. (2009). “Sarcopenic/Obesity and Physical Capacity in Older Men and Women: Data from the Nutrition as a Determinant of Successful Aging (NuAge)-the Quebec Longitudinal Study,” Obesity(Silver Spring), 17, 2082-2088.
Publisher – Google Scholar
Bouchard, D. R., Dionne, I. J., Payette, H. & Brochu, M. (2009). “Is There a BMI Treshold Value Associated with a Lower Physical Capacity in Well-Functioning Older Adults? The Quebec Longitudinal Study,” The Open Obesity Journal, 1 15-22.
Publisher – Google Scholar
Bouchard, D. R., Langlois, M. F., Boivert-Vigneault, K., Farand, P., Paulin, M. & Baillargeon, J. P. (2013). “Pilot Study: Can Older Inactive Adults Learn How to Reach the Required Intensity of Physical Activity Guidelines?,” Clinical Interventions in Aging, submitted.
Publisher – Google Scholar
Bouchard, D. R., Porneala, B., Janssen, I., Langlois, M. F., Baillargeon, J. P., Fox, C. S., Meigs, J. B., D’Agostino, R. B., Sr., Pencina, M. & Hivert, M. F. (2013). “Risk of Type 2 Diabetes and Cumulative Excess Weight Exposure in the Framingham Offspring Study,” Journal of Diabetes and its Complications.
Publisher – Google Scholar
Briggs, R. C., Gossman, M. R., Birch, R., Drews, J. E. & Shaddeau, S. A. (1989). “Balance Performance among Noninstitutionalized Elderly Women,” Physical Therapy, 69, 748-56.
Publisher – Google Scholar
Coggon, D., Reading, I., Croft, P., McLaren, M., Barrett, D. & Cooper, C. (2001). “Knee Osteoarthritis and Obesity,”International Journal of Obesity and Related Metabolic Disorders, 25, 622-7.
Publisher – Google Scholar
Compher, C., Frankenfield, D., Keim, N. & Roth-Yousey, L. (2006). “Best Practice Methods to Apply to Measurement of Resting Metabolic Rate in Adults: A Systematic Review,” Journal of the American Dietetic Association, 106, 881-903.
Publisher – Google Scholar
Davison, K. K., Ford, E. S., Cogswell, M. E. & Dietz, W. H. (2002). “Percentage of Body Fat and Body Mass Index are Associated with Mobility Limitations in People Aged 70 and Older from NHANES III,” Journal of the American Geriatrics Society , 50, 1802-9.
Publisher – Google Scholar
Dey, D. K., Rothenberg, E., Sundh, V., Bosaeus, I. & Steen, B. (1999). “Height and Body Weight in the Elderly. I. A 25-Year Longitudinal Study of a Population Aged 70 to 95 Years,” European Journal of Clinical Nutrition, 53, 905-14.
Publisher – Google Scholar
Evans, E. M. & Racette, S. B. (2006). “Menopause and Risk for Obesity: How Important is Physical Activity?,” Journal of Women’s Health (Larchmt), 15, 211-3.
Publisher – Google Scholar
Gorber, S. C., Tremblay, M., Moher, D. & Gorber, B. (2007). “A Comparison of Direct vs. Self-Report Measures for Assessing Height, Weight and Body Mass Index: A Systematic Review,” Obesity Reviews, 8, 307-26.
Publisher – Google Scholar
Gracia, C. R., Sammel, M. D., Freeman, E. W., Lin, H., Langan, E., Kapoor, S. & Nelson, D. B. (2005). “Defining Menopause Status: Creation of a New Definition to Identify the Early Changes of the Menopausal Transition,”Menopause, 12, 128-35.
Publisher – Google Scholar
Hilditch, J. R., Lewis, J., Peter, A., van Maris, B., Ross, A., Franssen, E., Guyatt, G. H., Norton, P. G. & Dunn, E. (1996). “A Menopause-Specific Quality of Life Questionnaire: Development and Psychometric Properties,” Maturitas, 24, 161-75.
Publisher – Google Scholar
Iverson, B. D., Gossman, M. R., Shaddeau, S. A. & Turner, M. E., Jr. (1990). “Balance Performance, Force Production, and Activity Levels in Noninstitutionalized Men 60 to 90 Years of Age,” Physical Therapy, 70, 348-55.
Publisher – Google Scholar
Janssen, I. & Bacon, E. (2008). “Effect of Current and Midlife Obesity Status on Mortality Risk in the Elderly,” Obesity(Silver Spring), 16, 2504-9.
Publisher – Google Scholar
Jones, C. J., Rikli, R. E. & Beam, W. C. (1999). “A 30-s Chair-Stand Test as a Measure of Lower Body Strength in Community-Residing Older Adults,” Research Quarterly for Exercise and Sport, 70, 113-9.
Publisher – Google Scholar
Klein, S., Allison, D. B., Heymsfield, S. B., Kelley, D. E., Leibel, R. L., Nonas, C. & Kahn, R. (2007). “Waist Circumference and Cardiometabolic Risk: A Consensus Statement from Shaping America’s Health: Association for Weight Management and Obesity Prevention; NAASO, the Obesity Society; the American Society for Nutrition; and the American Diabetes Association,” Diabetes Care, 30, 1647-52.
Publisher – Google Scholar
Lake, J. K., Power, C. & Cole, T. J. (2000). “Back Pain and Obesity in the 1958 British Birth Cohort. Cause or Effect?,”Journal of Clinical Epidemiology, 53, 245-50.
Publisher – Google Scholar
Lee, S., Kuk, J. L., Davidson, L. E., Hudson, R., Kilpatrick, K., Graham, T. E. & Ross, R. (2005). “Exercise without Weight Loss is an Effective Strategy for Obesity Reduction in Obese Individuals with and without Type 2 Diabetes,”Journal of Applied Physiology, 99, 1220-5.
Publisher – Google Scholar
McAdams, M. A., Van Dam, R. M. & Hu, F. B. (2007). “Comparison of Self-Reported and Measured BMI as Correlates of Disease Markers in US Adults,” Obesity (Silver Spring), 15, 188-96.
Publisher – Google Scholar
National Center for Health Statistics.( 2001-2002). National Health and Nutrition Examination Survey (NHANES). [Online]. Hyattsville, MD. Available: http://www.cdc.gov/nchs/about/major/nhanes/currentnhanes.htm.
Publisher
National Health and Nutrition Examination Survey. (2009). Weight History Questionnaire [Online]. Available:http://www.cdc.gov/nchs/data/nhanes/nhanes_09_10/whq_f.pdf.
Publisher
Panotopoulos, G., Raison, J., Ruiz, J. C., Guy-Grand, B. & Basdevant, A. (1997). “Weight Gain at the Time of Menopause,” Human Reproduction, 12 Suppl 1, 126-33.
Publisher – Google Scholar
Rikli, R. E. & Jones, C. J. (2013). Senior Fitness Test Manual, 2nd edition, Chaimpaign, Human Kinetics, Ilinois, USA.
Publisher – Google Scholar
Ross, R., Janssen, I., Dawson, J., Kungl, A.- M., Kuk, J. L., Wong, S. L., Nguyen-Duy, T.- B., Lee, S., Kilpatrick, K. & Hudson, R. (2004). “Exercise-Induced Reduction in Obesity and Insulin Resistance in Women: A Randomized Controlled Trial,” Obesity Research, 12, 789-98.
Publisher – Google Scholar
Rothney, M. P., Brychta, R. J., Schaefer, E. V., Chen, K. Y. & Skarulis, M. C. (2009). “Body Composition Measured by Dual-Energy X-Ray Absorptiometry Half-Body Scans in Obese Adults,” Obesity (Silver Spring), 17, 1281-6.
Publisher – Google Scholar
Serdula, M. K., Mokdad, A. H., Williamson, D. F., Galuska, D. A., Mendlein, J. M. & Heath, G. W. (1999). “Prevalence of Attempting Weight Loss and Strategies for Controlling Weight,” JAMA, 282, 1353-8.
Publisher – Google Scholar
Shimazu, T., Kuriyama, S., Ohmori-Matsuda, K., Kikuchi, N., Nakaya, N. & Tsuji, I. (2009). “Increase in Body Mass Index Category Since Age 20 Years and All-Cause Mortality: A Prospective Cohort Study (the Ohsaki Study),”International Journal of Obesity (Lond), 33, 490-6.
Publisher – Google Scholar
Simkin-Silverman, L. R. & Wing, R. R. (2000). “Weight Gain During Menopause. Is it Inevitable or Can it Be Prevented?,”Postgraduate Medicine, 108, 47-50, 53-6.
Publisher – Google Scholar
Siri, W. E. (1993). “Body composition from Fluid Spaces and Density: Analysis of Methods. 1961,” Nutrition, 9, 480-91; discussion 480, 492.
Publisher – Google Scholar
Stenholm, S., Rantanen, T., Alanen, E., Reunanen, A., Sainio, P. & Koskinen, S. (2007). “Obesity History as a Predictor of Walking Limitation at Old Age,” Obesity (Silver Spring), 15, 929-38.
Publisher – Google Scholar
Teixeira, P. J., Going, S. B., Houtkooper, L. B., Cussler, E. C., Metcalfe, L. L., Blew, R. M., Sardinha, L. B. & Lohman, T. G. (2004). “Pretreatment Predictors of Attrition and Successful Weight Management in Women,” International Journal of Obesity and Related Metabolic Disorders, 28, 1124-33.
Publisher – Google Scholar
US National Institutes of Health. (1998). “Clinical Guidelines on the Identification, Evaluation, and Treatment of Overweight and Obesity in Adults: Executive Summary. Expert Panel on the Identification, Evaluation, and Treatment of Overweight in Adults,” The American Journal of Clinical Nutrition, 68, 899-917.
Publisher – Google Scholar
Van Pelt, R. E., Evans, E. M., Schechtman, K. B., Ehsani, A. A. & Kohrt, W. M. (2002). “Contributions of Total and Regional fat Mass to Risk for Cardiovascular Disease in Older Women,” American Journal of Physiology – Endocrinology and Metabolism, 282, E1023-8.
Publisher – Google Scholar
Visser, M. (2011). “Obesity, Sarcopenia and their Functional Consequences in Old Age,” Proceedings of the Nutrition Society, 70, 114-8.
Publisher – Google Scholar
Visser, M., Langlois, J., Guralnik, J. M., Cauley, J. A., Kronmal, R. A., Robbins, J., Williamson, J. D. & Harris, T. B. (1998). “High Body Fatness, but not Low Fat-Free Mass, Predicts Disability in Older Men and Women: The Cardiovascular Health Study,” The American Society for Clinical Nutrition, 68, 584-90.
Publisher – Google Scholar
Weiss, E. P., Racette, S. B., Villareal, D. T., Fontana, L., Steger-May, K., Schechtman, K. B., Klein, S., Ehsani, A. A. & Holloszy, J. O. (2007). “Lower Extremity Muscle Size and Strength and Aerobic Capacity Decrease with Caloric Restriction but not with Exercise-Induced Weight Loss,” Journal of Applied Physiology, 102, 634-40.
Publisher – Google Scholar
WHO (2003). ‘Obesity: Prevention and Management of the Global Epidemic Geneve,’
Witham, M. D. & Avenell, A. (2010). “Interventions to Achieve Long-Term Weight Loss in Obese Older People: A Systematic Review and Meta-Analysis,” Age Ageing, 39, 176-84.
Publisher – Google Scholar