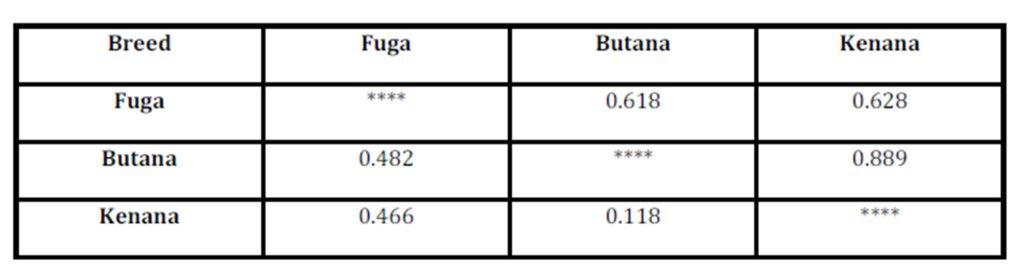
High values for genetic identity means low values for genetic distance and vice versa. The Dendrogram is based on Nei’s (1972) using Genetic distance: Method = UPGMA (computer software), modified from NEIGHBOR procedure of PHYLIP Version 3.5 was used to draw the phylogeny tree between the three breeds understudy. The dendrogram showed that the Butana and Kenana are within one cluster while Fuga is in another cluster, (Fig 1).
Discussion
The sustainability of species and populations in the future is affected by the genetic diversity which shaped the past populations process (Soule, 1987). Maintaining of genetic diversity is a key to the long-term survival of most species including cattle (Hall and Bradley 1995). Many studies proved that farm animal genetic diversity is needed to meet current production requirements to allow sustained genetic improvement and to facilitate the rapid adaptation to changing breeding goals (Hall and Bradley 1995; Kumar et al. 2006). Diversity can be defined as the genetic variation between and within different breeds, so it is essential to characterize a breed for its conservation. Microsatellites markers are the best genetic marker have been used successfully to define genetic structures and genetic relationships among different breeds. Microsatellites usually show higher numbers of alleles and subsequently polymorphism. Consequently, they enable population differentiation to be found more efficiently. Microsatellites markers especially autosomal had been the most used genetic markers to estimate genetic diversity and to investigate different breed relationships moreover to define conservation priorities (Lenstra et al., 2012).
Neutral genetic diversity preservation is expected to contribute to maintaining specific breed traits due to natural and manmade selection.
Indeed, some microsatellites can be present in genes associated with important quantitative traits loci (QTLs) including adaptation (Hall et al., 2012).
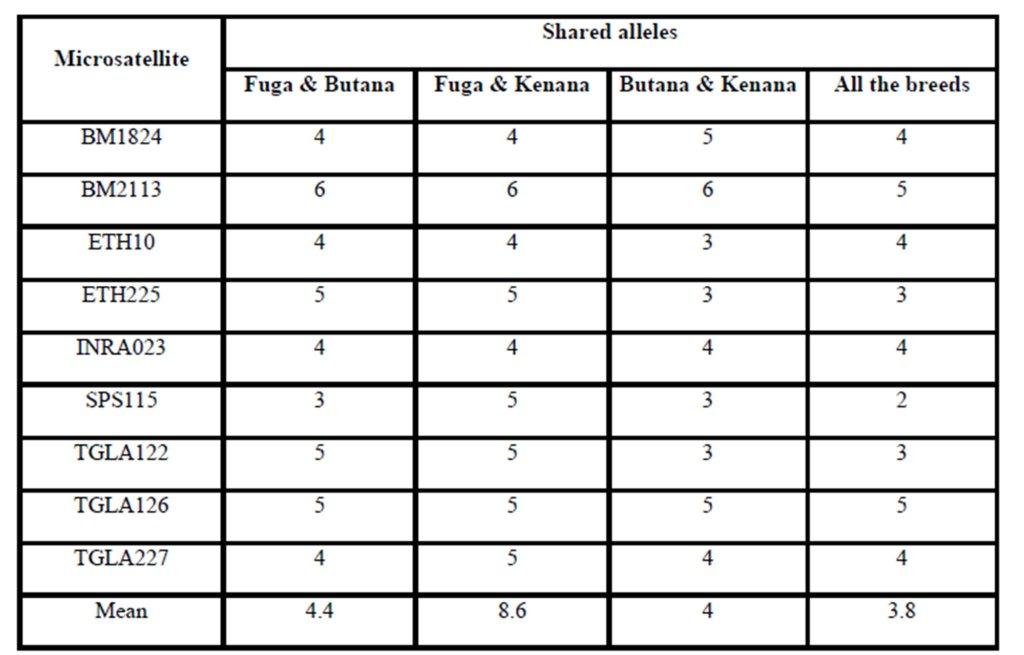
Previous studies have been performed concerning genetic diversity and relationship between three local cattle populations (Gangatiri, Shahabadi and Purnea) and two established cattle breeds (Bachaur and Siri) of eastern India by using 21 FAO and ISAG recommended microsatellite markers (Sharma et al., 2013). In a study conducted by Rehman and Khan (2009) for identification the genetic diversity of Hariana and Hissar Pakistani cattle breeds using 30 bovine microsatellite markers suggested by a joint committee of the Food and Agriculture Organization and the International Society for Animal Genetics. However, no information is available on gene differentiation among different cattle breeds raised in Sudan. In the present study, genetic variation within and between three Sudanese cattle breeds named: Fuga, Butana, and Kenana were estimated using genotypic data of 9 microsatellite markers recommended by ISAG (2012) for such studies. The total numbers of animals genotyped were 75 animals, 25 animals from each breed. Out of the 9 microsatellite loci, 74 loci amplified successfully and produced definite banding patterns. Since it is observed a large numbers of alleles for these microsatellite markers, these markers could be fruitfully used in further studies on quantitative trait loci (QTL) detection and subsequently marker assisted selection (MAS). However, the allele sharing results did not show any obvious unique or specific alleles for specific breed. This is may come from the lack of breeding programs or in another words the absence of selection for genetic improvement.
The average of observed allele number was 8 alleles; this number lies within the range of 6-9 alleles, which was reported in many cattle breeds from Europe (MacHugh et al., 1997, 1998), Africa (MacHugh et al., 1997; Ibeagha-Awemu et al., 2004); Brazil (Egito et al., 2007). From another side, the observed average allele number is less than that reported for Indian zebu cattle, which is ranging from 4-16 (Mukesh et al., 2004; Chaudhari et al., 2009, Sodhi et al., 2011). This may be due to the large number of cattle breeds raised in India and the microsatellite used in the study, some microsatellites can produce more allele than others. The observed number of alleles demonstrated that almost all the microsatellite loci utilized in the present study were sufficiently polymorphic. All breeds showed that by the increase of number of alleles at different loci, there was an increase in mean genetic diversity in population and supported by Moioli et al. (2001). This is an indication for the high ratio of heterozygosity which arises from the absence or weak selection or organized breeding programs for the Sudanese cattle. The effective number of alleles (Ne) can be identified as an estimate for the number of alleles with equal frequencies corresponding to a particular PIC value. Fuga cattle have the highest mean effective number of alleles (3.963) when compared with the Butana (3.307) and Kenana (3.123) breeds. The observed mean (Ho) and expected (He) heterozygosity were 0.778 and 0.725 in Fuga vs. 0.737 and 0.695 in Butana and 0.693 and 0.651 in Kenana cattle, respectively. In all the three breeds studied and for all the markers used, there were few individuals carrying homozygous alleles. Accordingly the values of the expected heterozygosity were very high for all the markers and populations under study. The values of observed heterozygosity were higher than the expected heterozygosity indicates much of variability.
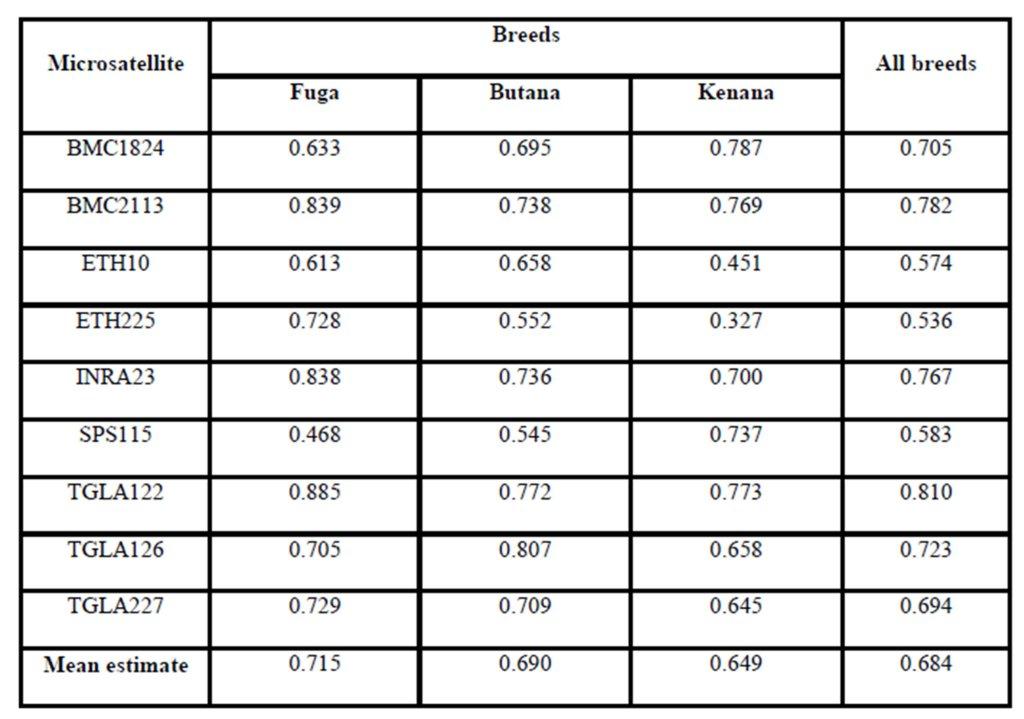
The Polymorphism Information Content (PIC) is an expected heterozygosity derived from allele frequencies in random mating populations. PIC is an indicator of how many alleles a certain marker has how much these alleles divided evenly. For example if a marker has many alleles but only one of them is frequent, the PIC will be low. The overall mean values of (PIC) obtained in the present study were 0.664 in Fuga, 0.630 in Butana and 0.596 in Kenana. While The average gene diversity over all loci were 0.684 that is almost similar to the previously reported by Loftus et al. (2002), which was 0.78 during their study concerning the identification of zebu alleles in some cattle breeds. There was a significant positive relationship between averages within population gene diversity for each locus. Kalinowski (2002) observed high values of (PIC) and attributed it to the large number of alleles or heterozygosity. The observed high number of alleles may be attributed to the absence of selection pressure used for the improvement of draught characters. These findings are in agreement with Muralidhar (2003), who used ten microsatellite markers and obtained PIC values in Indian cattle which ranged from 0.150 to 0.790 in Ongole cattle breed and from 0.13 to 0.80 in Deoni cattle breed. Moreover, Rehman and Khan (2009) demonstrated that the value of PIC was 0.749 in Hariana and 0.719 in Hissar cattle. Higher PIC values were also seen in the Brazilian and Indian zebu cattle investigated earlier using microsatellite markers (Egito et al., 2007; Pandey et al., 2006; Kale et al., 2010 and Sodhi et al., 2011).
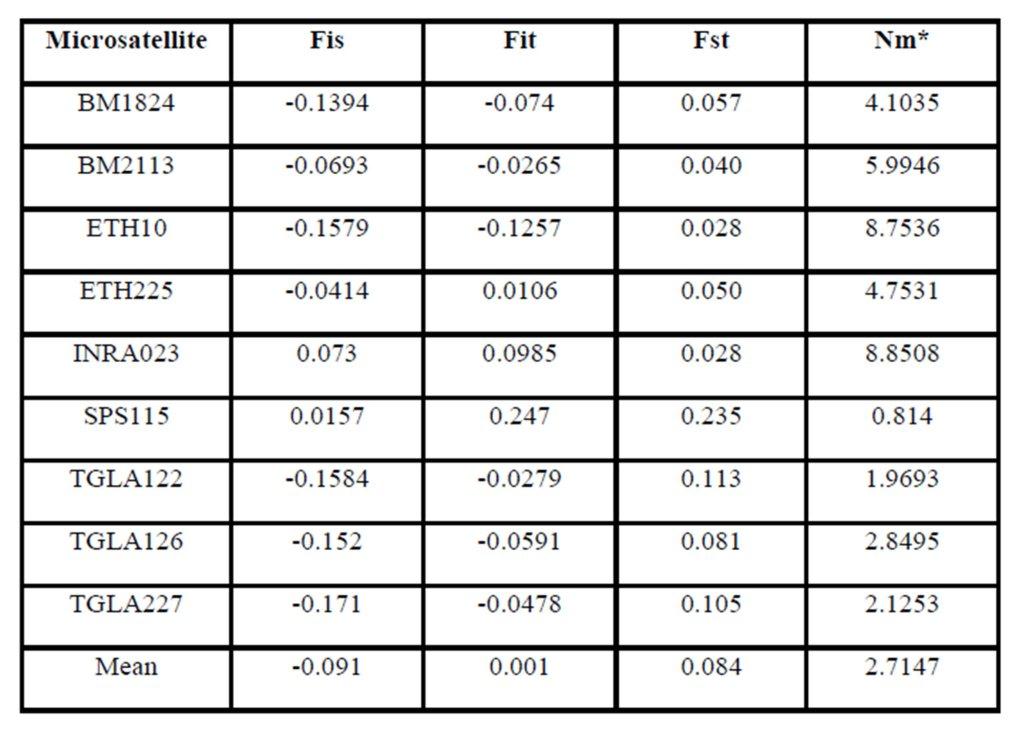
According to Holsinger and Weir (2009), Wright’s F-statistics provide important insights into evolutionary processes that influence the structure of genetic variation within and between populations, for that they are most widely used descriptive statistics in population and evolutionary genetics. Hart and Clark (1997), measures the heterozygote deficit relative to its expectation under HWE (Fst). Regarding the interpretation of fixation index (Fst), it had been accepted that a value ranging between 0 to 0.05 indicates low genetic differentiation; a value ranging between 0.05 and 0.15, medium differentiation; a value ranging between 0.15 and 0.25 big differentiation; and a value above 0.25, very big genetic differentiation (Wright, 1978; Balloux and Lugon-Moulin, 2002). Accordingly in our study Moderate genetic differentiation (Fst) among breeds (8.4%) implies that 91.6% of the total genetic variation corresponds to differences among individuals. In addition, a very low inbreeding rates (Fit= 0.1%) between the three breeds was detected that means absence of inbreeding between the populations under study.
Genetic differentiation of similar magnitude has been reported among 12 African Bos indicus and Bos taurus cattle breeds (Ibeagha-Awemu and Erhardt, 2005). However, Figures is higher than the 7 % of the total genetic variability (mean FST=0.07) reported by Canon et al. (2001) among local European cattle breeds and much more higher than the 1.6% given by Ibeagha-Awemu and Erhardt (2006) among Red Bororo and White Fulani cattle breeds of Nigeria and Cameroon. However, the same value was found among 12 African Bos indicus and Bos taurus cattle breeds (Ibeagha-Awemu and Erhardt, 2005).
In this study Fst value may indicate the presence of gene flow between cattle breeds. The highest gene flow between breeds was found in the marker INRA023 (8.8508), while the lowest gene flow was shown in the marker SPS115 (0.814). On the other hand, the presence of gene flow between these breeds may be due to their common origin (Canon et al., 2000).
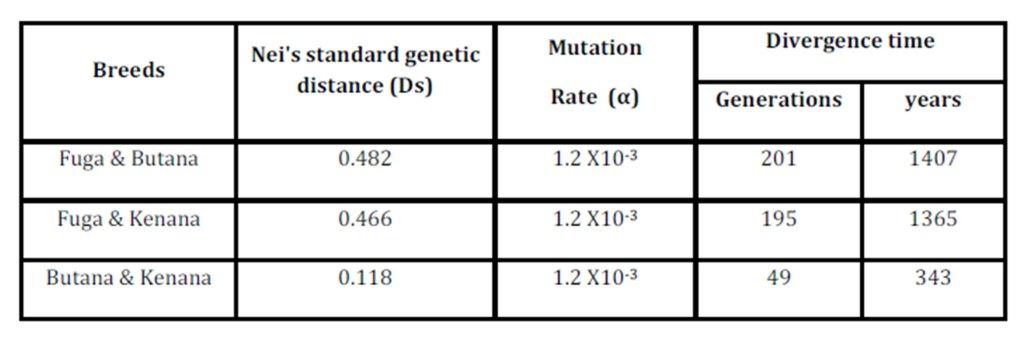
The inbreeding estimates were calculated using the FIS values (Wright’s Fixation Index). This revealed that Sudanese breeds are having wider genetic variability. It is observed that the lowest Fis value was found in Butana (-0.830) as compared with Kenana (-0.195) and Fuga (-0.317) with an overall mean of deficit of heterozygotes (Fis) is (-0.091). This negative mean value 0.091 suggests that 9.1% of heterozygous excess individuals available in the breed and the samples were collected from highly heterozygous breed. This high heterozygosity values are comparable with Umblachery cattle breed (-0.0487) (Karthickeyan et al., 2007). In contrast to our results, Metta (2004) reported in Indian Ongole cattle breed a high Fis values (0.36) and the author attribute this high value to the small sample size studied (n=17). Similar results were obtained by Sharma et al., (2006) in their study on Indian Bachaur cattle breed (Fis=0.22) and Sharma et al., (2007) in Indian Gangatiri cattle breed (Fis=0.31). The estimated time of divergence revealed that the biggest divergence time (1407 years) was between the Fuga and Butana cattle; in contrast the lowest divergence time (343 years) was between Butana and Kenana. These results are confirming the phylogeny dendrogram obtained using UPGMA method that proved that Butana and Kenana are within one cluster while Fuga is in another cluster; the three breeds are then coming from one ancestor. This result could be logic due to raising of both the Kenana and Butana cattle in near or close areas as they raised in north of Sudan while Fog were raised in the North Kordofan (Yousif and Fadl El- Moula, 2006).
In conclusion, this study reports on a comprehensive study of the genetic structure and diversity of three native zebu cattle breeds in Sudan. The genetic analysis data showed that a significant amount of genetic variation is maintained in the three studied Sudanese local zebu cattle breeds and all breeds studied could be considered as distinct genetic content. The three breeds displayed a markedly higher allelic richness most likely as a result of a combination of natural selection in diverse environmental conditions. Several authors declared that the amount and distribution of genetic diversity should be taken into account when dealing with conservation strategies of livestock species. It should be also taken into consideration that cultural, historical, and traditional aspects regarding the use of particular breeds are relevant issues. Moreover, it should be realized the fact that directional selection for genetic improvement achieved by animal breeders has shaped animal genomes in unexpected ways through choosing the good or favorite alleles or genes structures for which the surrogate neutral markers used in diversity surveys are not necessarily fully representative.
References
1. Balloux, F., and Lugon-Moulin, N. (2002) “The estimation of population differentiation with microsatellite markers,” Molecular Ecology, 11: 155—165.
Google Scholar
2. Bennett, S. C. J., John, E. R. and Hewison J W. (1948) “Animal husbandry,” In: J D To thill (ed), Agriculture in The Sudan. Oxford University Press, London, UK.
3. Bostein, D., White, R.L., Skolnick, M., and Davis, R. W. (1980) “Construction of genetic linkage maps in man using restriction fragment length polymorphism,” Am. J. Hum. Genet., 32: 314—331.
Google Scholar
4. Canon, J., Alexandrino, P., Bessa, I., Carleos, C., and Carretero, Y. (2001) “Genetic diversity measures of local European beef cattle breeds for conservation purposes,” Genet. Sel. Evol., 33: 311—332.
Publisher – Google Scholar
5. Canon, J., Checa, M.L., Carleos, C., Vega-Pla, J.L., Vallejo, M., Dunner, S. (2000) “The genetic structure of Spanish Celtic horse breeds inferred from microsatellite data,” Anim. Genet., 31 (1): 39—48.
Publisher – Google Scholar
6. Chaudhari, M.V., Parmar, S.N.S., Joshi, C.G., Bhong, C.D., Fatima, S., Thakur, M.S. and Thakur, S.S. (2009) “Molecular characterization of Kenkatha and Gaolao (Bos indicus) cattle breeds using microsatellite markers,” Anim Biodivers Conserv., 32(2): 71—76.
Google Scholar
7. Edwards, C.J., Gaillard, C., Bradley, D.G. and MacHugh, D.E. (2000) “Y-specific microsatellite in a range of bovid species,” Animal Genetics, 31: 127—130.
Publisher – Google Scholar
8. Egito, A.A., Paiva, S.R., Albuquerque, M.M., Mariante, A.S., Almeida, L.D., Georges, M. and Massey J.M. (1992) “Polymorphic DNA markers in Bovidae,” Patent WO 92/13102 1992.
9. Goudet, J. (2002) “FSTAT Computer Package for PCs,” Institute of Ecology, UNIL, Lausanne, Switzerland.
10. Hall, S.J.G. and Bradley, D.G. (1995) “Conserving livestock breed biodiversity,” Trends Ecol. Evol., 10: 267-270.
Publisher – Google Scholar
11. Hall, S.J.G., Lenstra, J.A., and Deeming, D.C. (2012) “Prioritization based on neutral genetic diversity may fail to conserve important characteristics in cattle breeds,” J. Anim. Breed. Genet., 129: 218-225.
Publisher – Google Scholar
12. Hartl, D.L., and Clark, A.G. (1997) “Principles of Population Genetics”, 3rd edn. Sinauer Associates, Inc, Sunderland, MA.
Google Scholar
13. Hetzel, D.J.S. and Drinkwater, R.D. (1992) “The use of DNA technologies for the conservation and improvement of animal genetic resources,” FAO Expert Consultation on the Management of Global Animal Genetic Resources, Rome.
Google Scholar
14. Holsinger, K.E., and Weir, B.S. (2009) “Genetics in geographically structured populations: defining, estimating and interpreting FST,” Nat Rev Genet., 10 (9): 639—650.
Publisher – Google Scholar
15. Ibeagha-Awemu, E.M., and Erhardt, G. (2005) “Genetic structure and differentiation of 12 African Bos indicus and Bos taurus cattle breeds inferred from protein and microsatellite polymorphisms. J. Anim. Breed. Genet., 122: 12-20.
Publisher – Google Scholar
16. Ibeagha-Awemu, E.M., Jann, O.C., Weimann, C., and Erhardt, G. (2004) “Genetic diversity, introgression and relationships among West/Central African cattle breeds,” Genet. Sel. Evol., 36(6): 673-690.
Publisher – Google Scholar
17. Ibeagha-Awemu, E.M. and Erhardt, G. (2006) “An evaluation of genetic diversity indices of the Red Bororo and White Fulani cattle breeds with different molecular markers and their implications for current and future improvement options,” Trop. Anim. Health Prod., 38(5):431-441.
Publisher – Google Scholar
18. ISAG (2012) “ International Society of Animal Genetics, Recommendations for Cattle Molecular Markers and Parentage Testing Workshop, July 19, Cairns. Australia.
19. Jordana, J., Alexandrino, P., Beja-Pereira, A., Bessa, I., Cañón, J., Carretero, Y., Dunner, S., Laloë, D., Moazami-Goudarzi, K., Sánchez, A., and Ferrand, N. (2003) “ Genetic structure of eighteen local South European beef cattle breeds by comparative F statistic analysis,” J. Anim. Genet., 120: 73-87.
Publisher – Google Scholar
20. Joshi, N.R., McLaughlin, E.A., and Phillips, R.W. (1957) “Types and breeds of. African Cattle,” Food and Agriculture Organization (FAO) Agricultural Study No. 37. FAO. Rome.
Google Scholar
21. Kale, D.S., Rank, D.N., Joshi, C.G., Yadav, B.R., Koringa, P.G., Thakkar, K.M., Tolenkhomba, T.C., and Solanki, J.V. (2010) “ Genetic diversity among Indian Gir, Deoni and Kankrej cattle breeds based on microsatellite markers,” Indian J. Biotechnol., 9: 126-130.
Google Scholar
22. Kalinowski, S.T. (2002) “How many alleles per locus should be used to estimate genetic distances? ,” Heredity, 88: 62-65.
Publisher – Google Scholar
23. Karthickeyan, S.M.K., Kumarasamy, P., Sivaselvam, S.N., Saravanan, R. and Thangaraju, P. (2007) “Analysis of microsatellite markers in Ongole breed of cattle,” Indian J of Biotechnology, 7: 113-116.
24. Kimura, M., and Crow, J.F., (1964) “The number of alleles that can be maintained in a finite population,” Genetics, 68: 47.
Google Scholar
25. Kumar, S., Gupta, J., Kumar, N., Dikshit, K., Navani, N., Jain, P., and Nagarajan, M. (2006) “Genetic variation and relationships among eight Indian reverie buffalo breeds,” Mol. Ecol., 15: 593-600.
Publisher – Google Scholar
26. Kunene, N., Nesamvuni, E.A., and Fossey, A. (2007) “Characterization of Zulu (Nguni) sheep using linear body measurements and some environmental factors affecting these measurements,” S. Afr. J. Anim. Sci., 37: 11-20.
27. Lenstra, J.A., Groeneveld, L.F., Eding, H., Kantanen, J., Williams, J.L., Taberlet, P., Nicolazzi, E.L., Solkner, J., Simianer, H., Ciani, E.; Garcia, J.F., Bruford, M.W., Ajmone-Marsan, P., and Weigend, S. (2012) “Molecular tools and analytical approaches for the characterization of farm animal genetic diversity,” Anim. Genet., 43: 483-502.
Publisher – Google Scholar
28. Loftus, R.T., Ertugrul, O., Harba, A.H., El-Barody, M.A., MacHugh, D.E., Park, S.D., and Bradley, D.G. (2002) “A microsatellite survey of cattle from a centre of origin: the Near East,” Mol. Ecol., 8(12): 2015-2022.
29. Marshall, F. (2000) “The Origins and Development of African Livestock: Archaeology, Genetics,” Linguistics and Ethnography, R. M. Blench, K. C.
30. MacHugh, D.E., Shriver, M.D., Loftus, R.T., Cunningham, P. and Bradley, D.G. (1997) “Microsatellite DNA variation and the evolution, domestication and phylogeography of taurine and zebu cattle (Bos taurus and Bos indicus) ,” Genetics, 146(3): 1071-1086.
Google Scholar
31. McHugh, D.E., Loftus, R.T., Cunningham, P., and Bradley, D.G. (1998) “Genetic structure of seven European cattle breeds assessed using 20 microsatellite markers,” Anim. Genet., 29: 333-340.
Google Scholar
32. Medugorac, I., Medugorac, A., Russ, I., Veit-Kensch, C.E., Taberlet, P., Lunty, B., Mix, H.M., and Forster, M. (2009)“Genetic diversity of European cattle breeds highlights the conservation value of traditional unselected breeds with high effective population size,” Mol. Ecol., 18: 3394-3410.
Publisher – Google Scholar
33. Medugorac, I., Veit-Kensch, C.E., Ramljak, J., Brka, M., Marković, B., Stojanović, S., Bytyqi, H., Kochoski, L., Kume, K., Grünenfelder, H.P., Bennewitz, J., and Förster, M. (2011) “Conservation priorities of genetic diversity in domesticated metapopulations: a study in taurine cattle breeds,” Ecol Evol., 1(3):408-420.
Publisher – Google Scholar
34. Metta, M., Kanginakudru, S., Gudiseva, N., and Nagaraju, J. (2004) “Genetic characterization of the Indian cattle breeds, Ongole and Deoni (Bos indicus), using microsatellite markers-A preliminary study,” BMC Genetics, 5: 5-16.
Publisher – Google Scholar
35. Moioli, B., Georgoudis, A., Napolitano, F., Catillo, G., Giubilei, E., Ligda, Ch., and Hassanane, M. (2001) “Genetic diversity between Italian, Greek and Egyptian buffalo populations,” Livestock Prod. Sci., 7(3): 203-211.
Publisher – Google Scholar
36. Mukesh, M., Sodhi, M., Bhatia, S., and Mishra, B.P. (2004) “Genetic diversity of Indian native cattle breeds as analyzed with 20 microsatellite loci,” J Anim. Breed. Genet., 121: 416—424.
Publisher – Google Scholar
37. Nei, M. (1972) “ Genetic distance between populations,” Am. Nat., 106: 283—292.
Google Scholar
38. Nei, M., Tajima, F., and Tateno, Y. (1983) “Accuracy of estimated phylogenetic trees from molecular data,” J. Mol. Evol., 19: 153—170.
Publisher – Google Scholar
39. Okomo-Adhiambo, M. (2002) “Characterization of genetic diversity in indigenous cattle of East Africa: Use of microsatellite DNA techniques,” ILRI. Nairobi, Kenya.
Google Scholar
40. Pandey, A.K., Sharma, R., Singh, Y., Prakash, B.B. and Ahlawat, S.P.S. (2006) “Genetic diversity studies of Kherigarh cattle based on microsatellite markers,” J. Genet., 85: 117—122.
Publisher – Google Scholar
41. Payne, W.J.A. (1970) “Cattle production in the tropics,” Volume1: Breeds and breeding. London, UK, Longman.
Google Scholar
42. Rehman M.S., and Khan, M.S. (2009) “Genetic Diversity of Hariana And Hissar Cattle From Pakistan Using Microsatellite Analysis,” Pakistan Vet. J., 29(2): 67-71.
Google Scholar
43. Rogić, B., Tomić, L., Važić, B., Jelić, M., Jovanović, S., and Savić, M. (2011) “Assessment Of Genetic Diversity Of Buša Cattle From Bosnia and Herzegovina Using Microsatellite Dna Markers,” Arch. Biol. Sci., Belgrade, 63 (4): 1077-1085.
Publisher – Google Scholar
44. Saeed, A. (2010) “Sudan report: Challenges Facing Sudan after Referendum Day 2011, Persistent and Emerging Conflict in the North-South Borderline States,” Issued by: Chr. Michelsen Institute (CMI), the Institute of Peace Studies at the University of Khartoum and Al Ahfad University for Women.
45. Sambrook, J., Fritsch, E.F., and Maniatis, T. (1989) “Molecular Cloning—A Laboratory Manual,” Cold Spring Harbor Laboratory Press.
46. Slatkin, M. (1985) “Gene flow in natural populations,” Ann. Rev. Ecol. Syst., 16: 393-430.
Publisher – Google Scholar
47. Soule, M. (1987) “Viable populations for conservation,” Cambridge University press, Cambridge.
Publisher – Google Scholar
48. Sodhi, M., Mukesh, M., Mishra, B.P., Ahlawat, S.P.S., Prakash, B., and Sobti, R.C. (2011) “Microsatellite analysis of genetic population structure of Zebu cattle (Bos indicus) breeds from North-Western region of India,” Anim. Biotech., 22: 16—29.
Publisher – Google Scholar
49. Sharma, R, Pandey, A.K., Singh, Y., Prakash, B., and Ahlawat, S.P.S. (2006) “Assessment of genetic variability in Ganagtiri cattle by microsatellite marker,” Korean J of Genet., 28(1) 35-42.
Google Scholar
50. Sharma, R., Pandey, A.K., Singh, S.C.P., Singh, Y., Mishra, B.P., Singh, S.R., Mandal, G.K., Sngh, P.K., Singh, G. and Ahlawat, S.P.S. (2007) “Diversity assessment of Bachaur cattle from India: A draft breeds still relevant in mechanized Era,” Korean J of Genet., 29(3) 369-378.
Google Scholar
51. Takezaki, P.J., and Nei, M. (1996) “Genetic distances and reconstruction of phylogenetic tree from microsatellite DNA,” Genetics, 144: 389-399.
Google Scholar
52. Weir, B.S. (1990) “Genetic Data Analysis: Methods for Discrete Population Genetic Data,” Sinauer Associates, Inc. Sunderland, Massachusetts.
Google Scholar
53. Weir, B.S., and Cockerham, C.C. (1984) “Estimating F-statistics for the analysis of population structure,” Evolution, 38: 1358—1370.
Google Scholar
54. Wright, S. (1951) “The genetic structure of populations,” Ann. Eugen., 15: 323—354.
55. Wright, S. (1978) “Evolution and the genetics of population. Variability Within and Among Natural Population,” vol. 4. University of Chicago Press, Chicago, IL.
56. WSRMP (2011) “Western Sudan Resource Management Program, International Fund for Agricultural Development: Livestock Breed Characterizations Study.
57. Yeh, F.C., Boyle, T., Rongcai, Y., Ye, Z., and Xian, J.M. (1999) “POPGENE, Version 1.31. A Microsoft Window Based Free Ware for Population Genetic Analysis,” University of Alberta, Edmonton.
58. Yousif, I.A. and Fadl El- Moula, A.A. (2006) “Characterization of Kenana cattle breed and its Production Environment,” AGRI, 38: 47-56.