Introduction
Glow discharges generated by microwave power supplies through coupling of electromagnetic radiation of frequency ranging from 300 MHz to 10 GHz are named as microwave induced plasmas. Power supplies operating at a frequency of 2.45 GHz are readily available due to their common use in industry and home heating applications, which makes suitable power source for microwave plasma generation. This kind of plasma may be considered in local thermodynamic equilibrium (LTE) and non-local thermodynamic equilibrium (non-LTE) depending on electron number density and plasma pressure [Bogaerts et al., 2002, Zhan et al., 2003, Fantz et al., 2006]. For low electron density plasma only a few collisions occur and resultantly plasma species are characterized by different temperatures due to insufficient collisional transfer of energy among them. Thus electron number density plays an important role in differentiating the LTE and non-LTE plasma regimes. The potential applications of non-LTE plasmas are etching, cleaning and deposition of thin films [Zhan et al., 2003]. Among the plasma species, electrons have higher thermal velocities due to their lighter mass and therefore can be easily accelerated by the electromagnetic radiation as compared to other plasma species. These energetic electrons in turn may excite or ionize the plasma species having energy of several electron volts above their ground state by inelastic collisions. Therefore, electron temperature [Te] and electron number density [ne] are important parameters for describing the plasma discharges as a function of discharge conditions. Moreover, in many cases, the rare gases are used as a feed gas or added as a trace gas in low pressure discharges, and the intensity of their optical emission is used to determine these parameters intrusively [Fantz et al., 2006, Abrar et al., 2013, Ahmad et al., 2009]. Especially, argon mixed reactive plasmas are widely used in various material processing applications [Zhang et al., 2000, Qayyum et al., 2005, Behringer et al., 1991, Boffard et al., 2004]. In plasma processing, elementary processes such as ionization, dissociation, and excitation as well as ion bombardment are closely related to the plasma parameters and therefore, plasma diagnostics are important in understanding the mechanism of material processing applications [Malyshev et al., 1997, Zhu et al., 2010, Czech et al., 2011, Bibinov et al., 2008, Zhu et al., 2008].
Argon plasma has been widely used for many kinds of material processing and surface modification applications, because argon is a kind of inert gas and has an appropriate atomic mass amongst noble gases. Knowledge of plasma parameters, such as electron temperature, electron number density and EEDF play a key role in the understanding of physics and chemistry of argon plasma for better optimization of processing reactor [Ahmad et al., 2009]. A lot of research work on microwave induced plasmas has been carried out so far to establish correlation between the plasma parameters and discharge conditions [Konjevi et al., 2009, Mattei et al., 2011, Zhu et al., 2008]. However, a little investigation is carried out on correlation of plasma parameters with discharge conditions in microwave induced argon plasma via spectroscopy diagnostics.
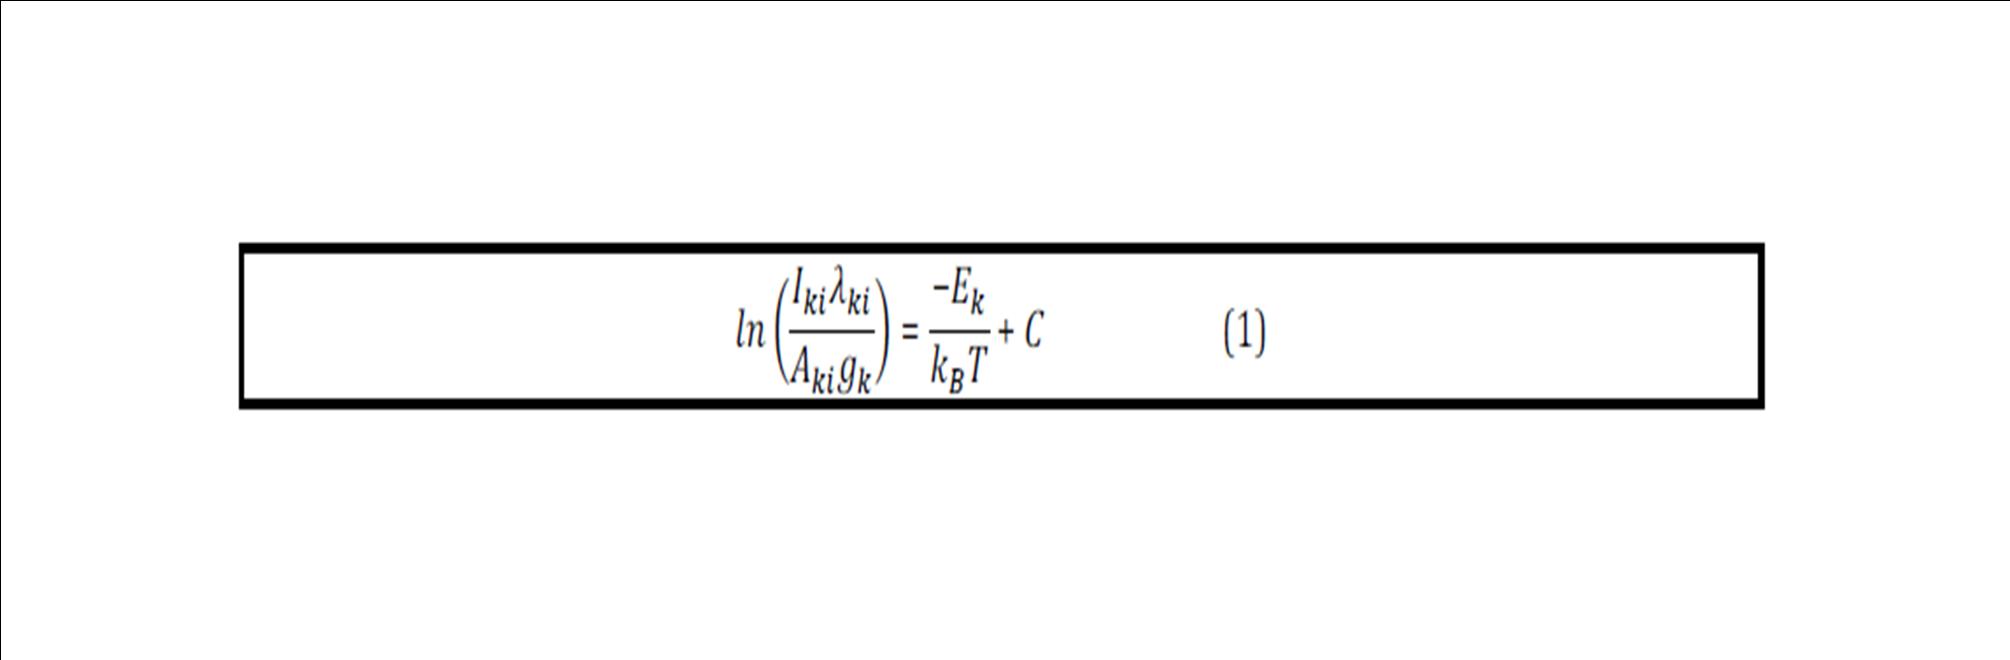
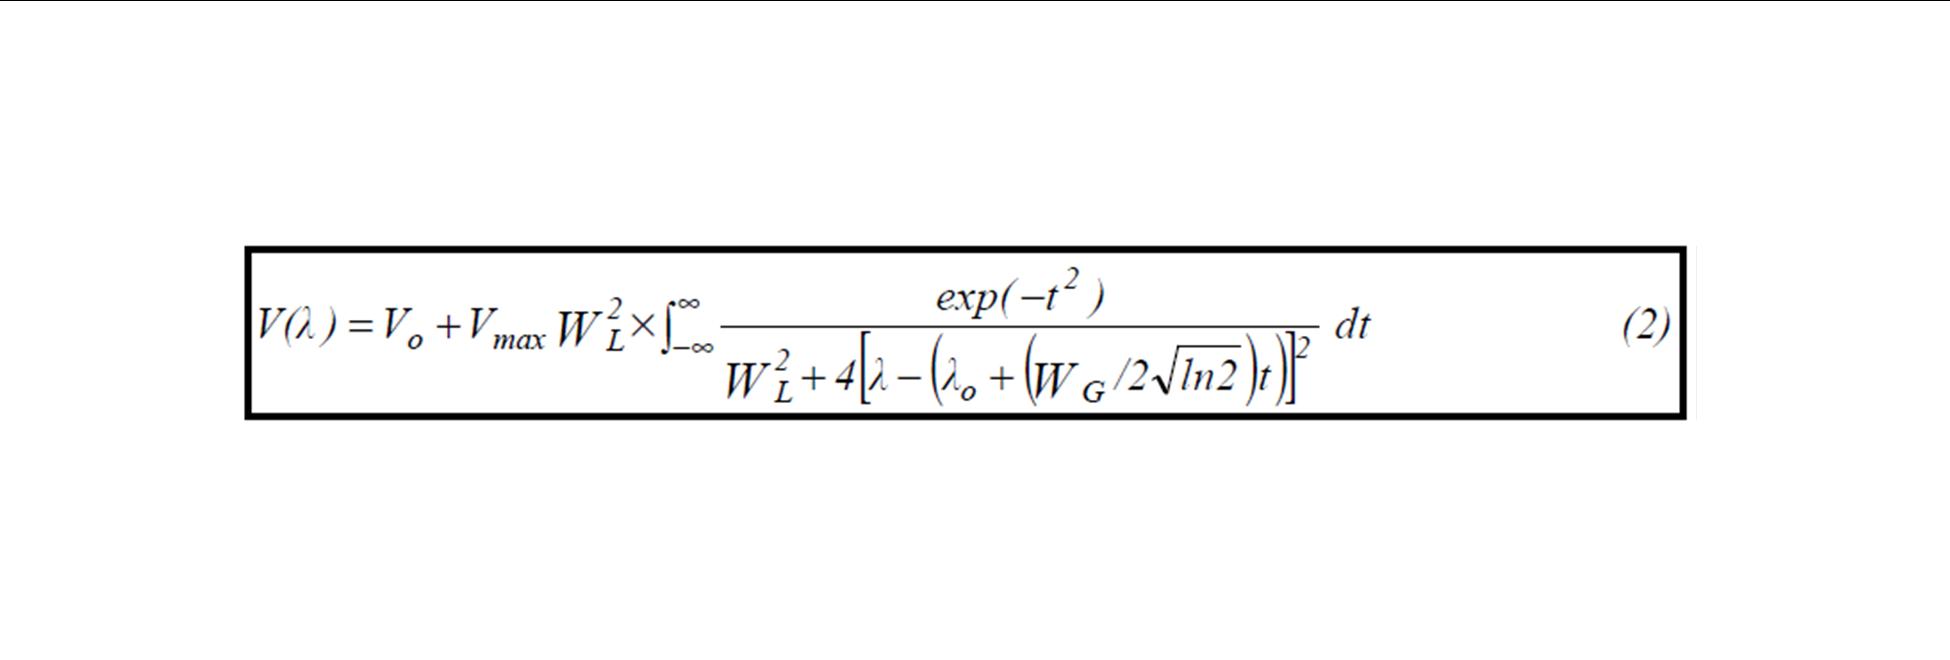
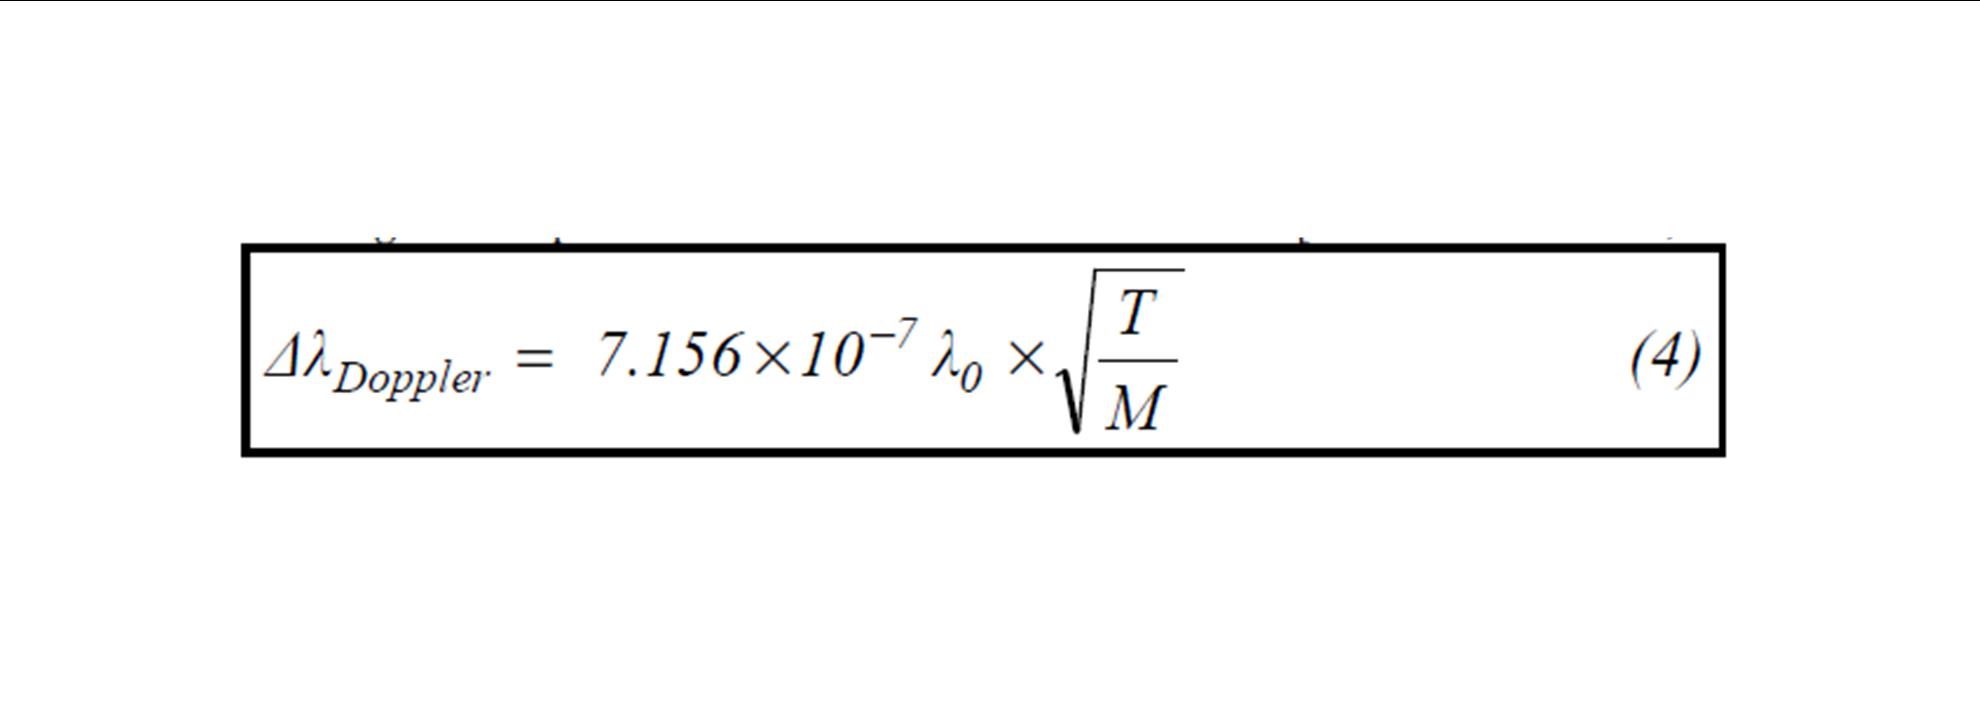
Optical emission spectroscopy is an appropriate and inventive technique to determine the plasma parameters such as electron temperature, electron number density and EEDF [Qayyum et al., 2005, Czech et al., 2011]. The electron temperature and the electron number density in low pressure plasma may be extracted from the emission spectrum of atomic and molecular species that are excited by direct electron impact process and depopulated by the spontaneous emission of radiation [Bibinov et al., 2008, Zhu et al., 2008]. Several spectroscopic methods are being used to determine the electron temperature [Te] including line-ratio method and Boltzmann’s plot method. However, Boltzmann’s method is preferred because it uses several spectral lines instead of two spectral lines and thus improves the accuracy of the measurements. This method adopted here to determine the electron density [ne] from the recorded single symmetrical profile is the Voigt fit on the shape and may be useful where no other diagnostic methods are available. The fit to Voigt profile is more appropriate, because it includes Doppler broadening as well as the Lorentzian profile. The Lorentzian profile has its roots in the Stark effect and is a consequence of radiating atoms interaction with free electrons and ions in the neighboring plasma region through local electric fields [Torres et al., 2007]. This profile can be used if the shape of the measured line is symmetric, which is usually the case of ionized emitters, where it is normally possible to neglect the interactions between the emitter and perturbing ions. In addition, in case of astrophysical plasmas, where no other diagnostic method is available, this method can be extremely helpful [Milosavljevic et al., 2001].
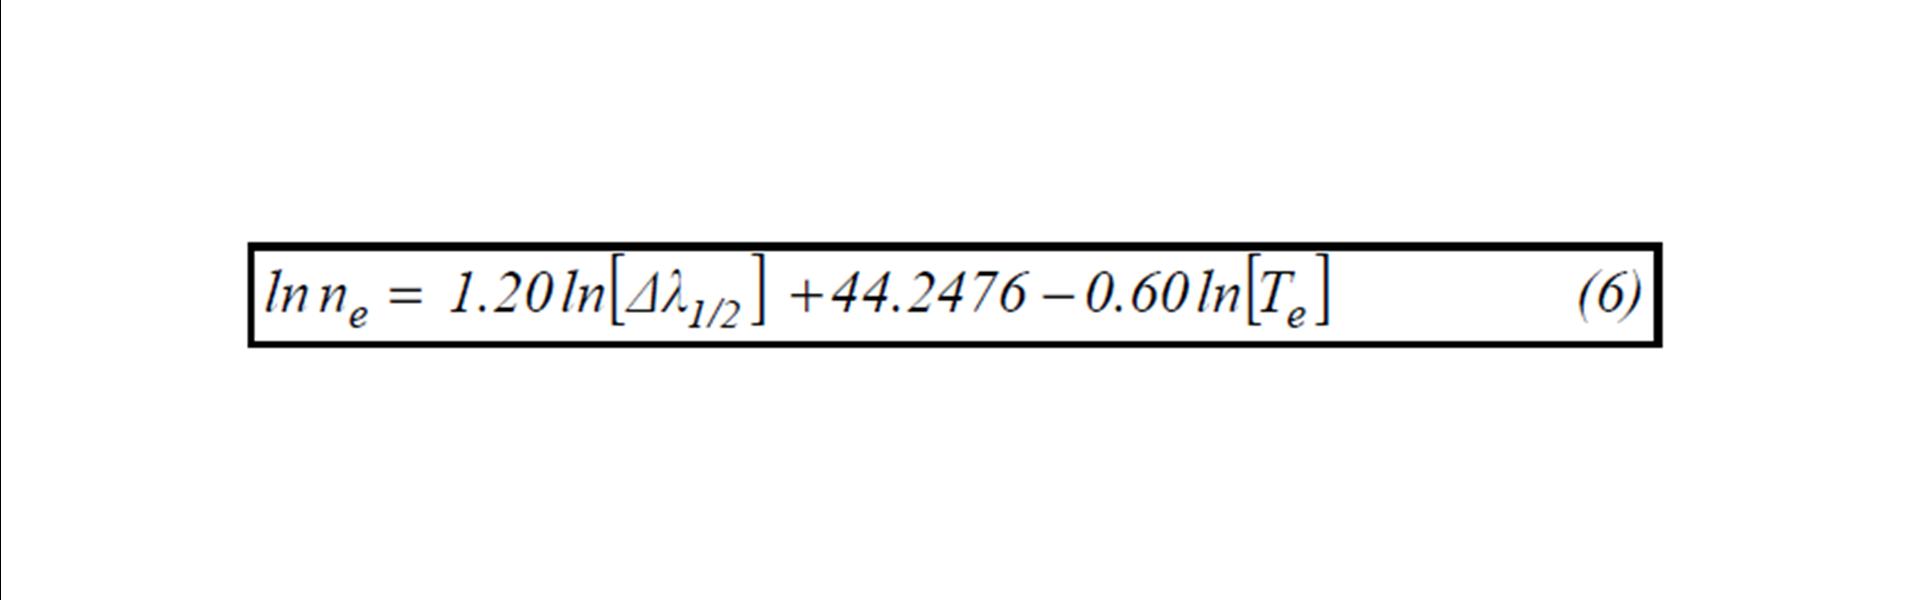
This paper reports the axial and radial measurements of the electron temperature and electron number density of argon plasma in 2.45 GHz discharge versus filling pressure at fixed input power and gas flow rate. Boltzmann’s plot method is used to determine the electron temperature of the argon plasma. The electron number density is calculated from the Stark broadening of Ar-I (696.54 nm) spectral line through Voigt profile fit after subtracting contribution of other broadening mechanisms. The measured electron temperature and electron number density are also discussed with reference to different electron and ionization processes involved in optical emission at different filling pressures.
Experiment
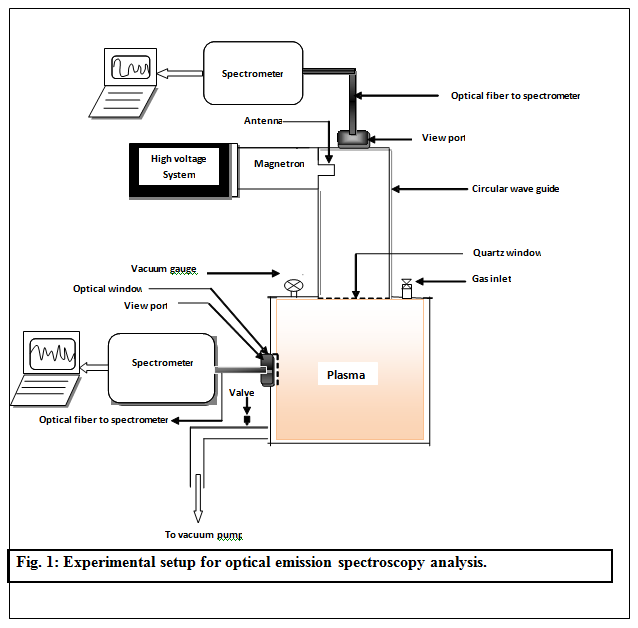
The schematic of the experimental arrangement is shown in figure 1. It consists of a cylindrical stainless steel vacuum chamber having diameter of 26 cm and height of 60 cm with several multi-purpose ports. One port of the vacuum chamber is coupled to pumping system that comprises of rotary pump and diffusion pump. After proper evacuation argon is fed as a working gas and plasma is generated at different filling pressures (0.4 – 0.7 mbar) for spectroscopic analysis The microwave discharge is maintained at the frequency of 2.45 GHz by means of 800 watt microwave generator. The main components of the microwave generator are the high voltage system and magnetron tube. The high voltage system consists of step-up transformer and rectifier circuit for increasing input voltage from 220V to 2kV and then converting it from AC to DC. The magnetron operation is mainly based on the motion of electrons under the combined effect of electric and magnetic fields. Therefore, the trajectory of the electrons is governed by two fundamental facts. Firstly, the force exerted by an electric field on an electron is proportional to the strength of the field. Secondly, the force exerted on an electron in a magnetic field is at right angle to the both field itself and the path of the electrons. Consequently, the trajectory of the electron under the Lorentz force from the cathode to the anode is curving rather than straight path. Permanent magnets are added above and below the magnetron tube to produce perpendicular magnetic field and resultantly electrons motion is circular. The electrons are emitted from the heated filament which also serves as the cathode of the magnetron tube. These electrons are accelerated from the cathode towards anode. In this way work is done on the electrons and therefore, energy from the power supply is given to them. As these electrons move toward a point where excess of negative charge already exist due to the presence of resonant cavities. So they are pushed back around the cavity, imparting energy to the oscillations at the natural frequency of the cavity. These driven oscillations of the charges around the cavities leads to radiation of electromagnetic waves: the output of the magnetron. Thus DC power is converted to the RF energy due to resonant cavities that serve as a tuned circuit. The output RF energy is transmitted by an antenna that is connected to the anode and extends into one of the tuned cavities. The antenna is coupled to the waveguide, a hollow metal enclosure; which transmit the RF energy to the plasma column.
Results and Discussion
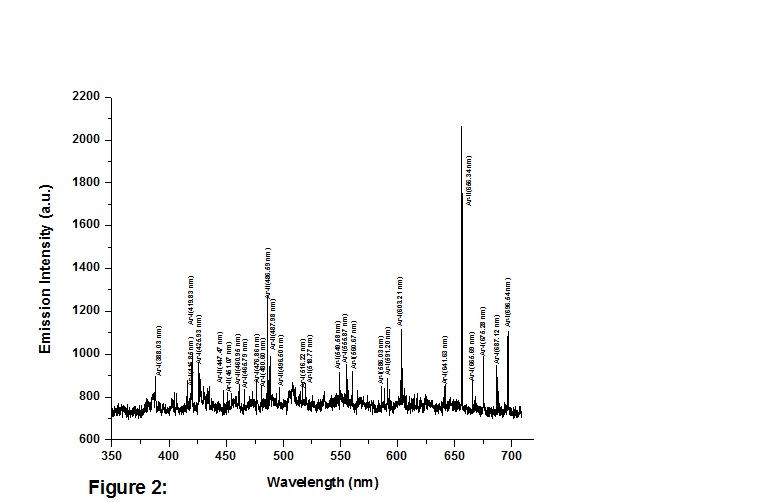
Figure 2 shows the emission spectrum of 2.45 GHz argon plasma at a filling pressure of 0.6 mbar and input power of 800 watt. The prominent spectral lines in the spectrum are identified and labeled using NIST data. The emission lines in the spectrum have different intensity distribution that may be attributed to different population of their respective emitting states. This rises from the fact that emitting states have different threshold excitations and thus involve different group of electrons for their impact excitation.
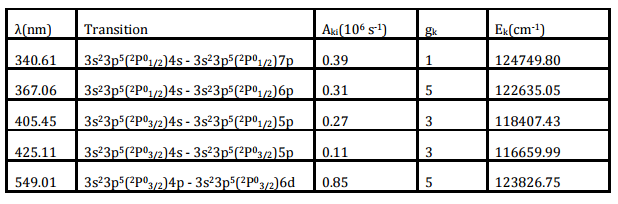
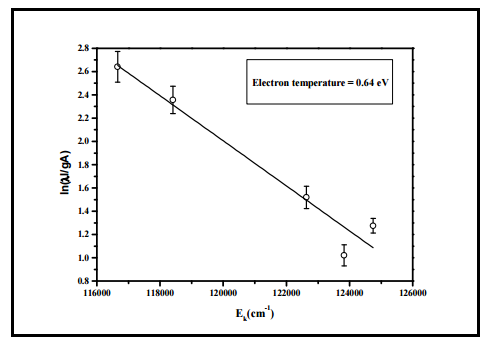
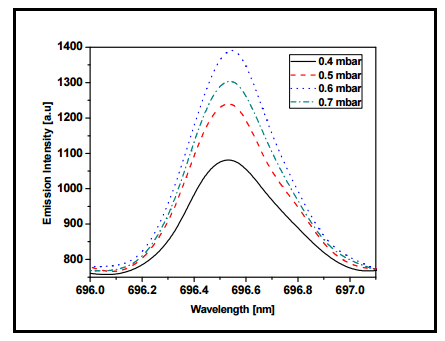
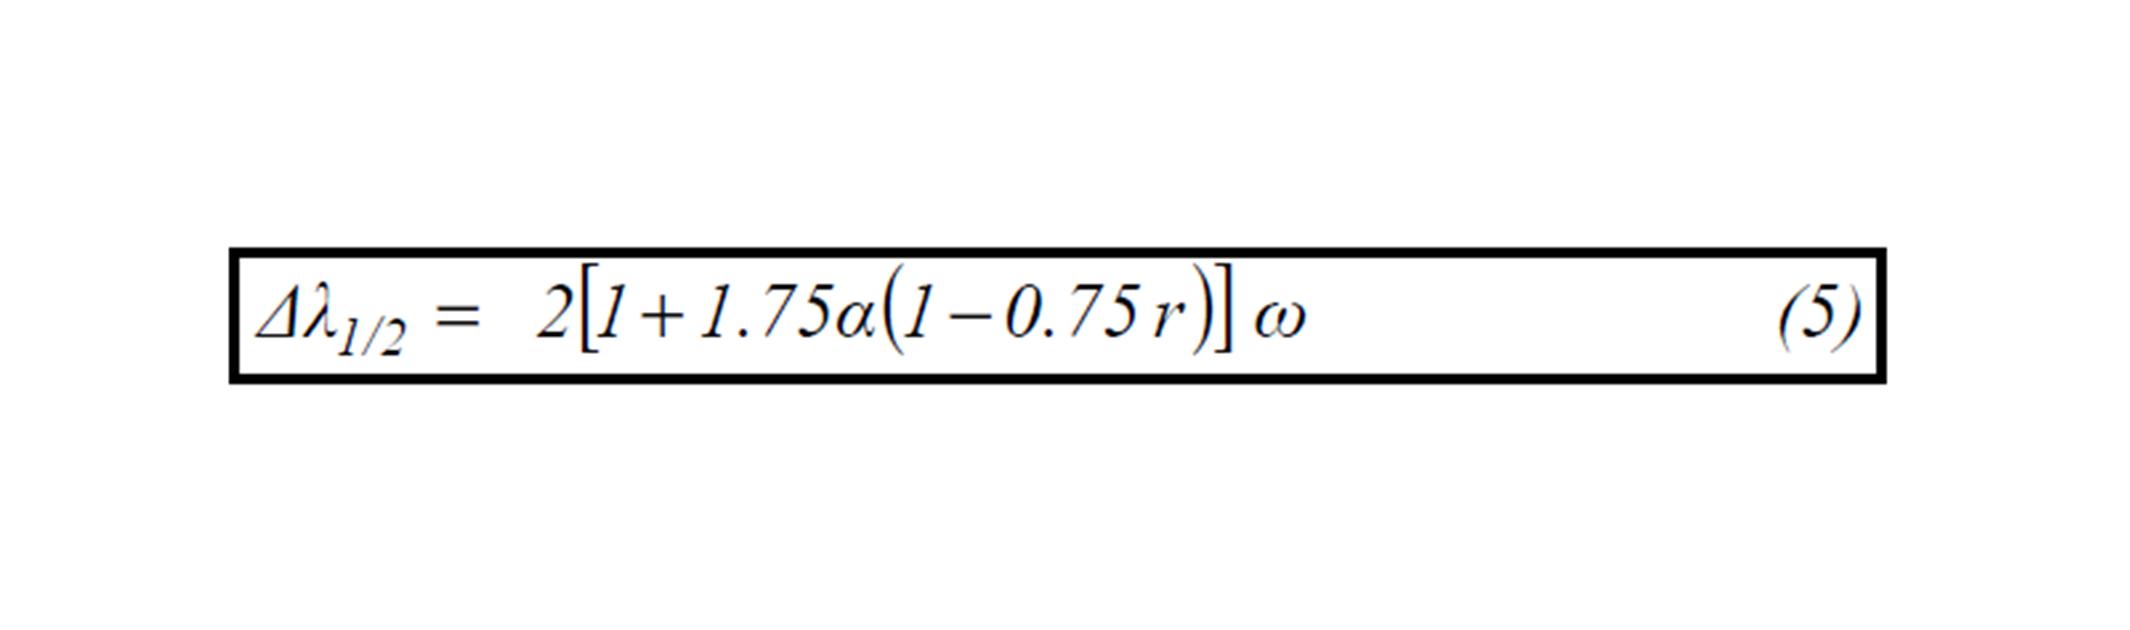
Fig. 3 shows the Boltzmann’s plot that uses the emission intensity of several spectral lines of argon having different threshold excitation energies. The electron temperature is determined from the slope of the Boltzmann’s plot at a filling pressure of 0.6 mbar and it comes to be 0.64 eV. The variation of electron temperature versus filling pressure is presented in Fig. 4 for both measurements, i.e. axial as well as radial directions. It can be seen from the graph that the value of the electron temperature for axial direction is higher than radial direction for all filling pressures. This fact can be explained as follows: The axial region is directly exposed to microwave electric field by waveguide through quartz window and thus field is stronger in this region. Consequently, energy absorbed by electrons and also the collision rate of electrons with other plasma species is higher due to direct heating of electrons by microwave electric field and thus higher electron-impact ionization. The higher electron temperature and consequently higher electron number density is expected as a result of electron impact ionization. The microwave electric field intensity decreases with increasing distance from the launcher towards the end of plasma column due to attenuation of microwave power. The energy of electrons received from the electric field decreases and thus less electron impact excitation and ionization in the region away from launcher. The other reason may be the recombination loss of electrons in the outer portion of the plasma that is cooler compared to inner portion. The re-absorption is also higher in radial direction due to large number of neutrals available in the path of photons and thus attenuation of emission intensity. Additionally, the spectroscopic technique provides the line of sight average intensity of optical emission by the radiating atoms. Therefore the difference in plasma length and plasma quality owing to different plasma conditions and radiating atoms involved in optical emission in axial and radial measurements may be the other reason. The results also show that the electron temperature decreases with increasing filling pressures. This decrease in electron temperature with filling pressure may be attributed to increase in number of collisions and consequently efficient collisional transfer of energy from the electron to the other plasma species. Fig. 5 shows the dependencies of Ar-I (696.54 nm) spectral profile as a function of filling pressure for axial measurements. It can be seen from the figure that the broadening of spectral line is strongly affected by the filling pressure and thus after adopting de-convolution procedure described earlier; FWHM of Stark broadening is obtained and related to electron number density.
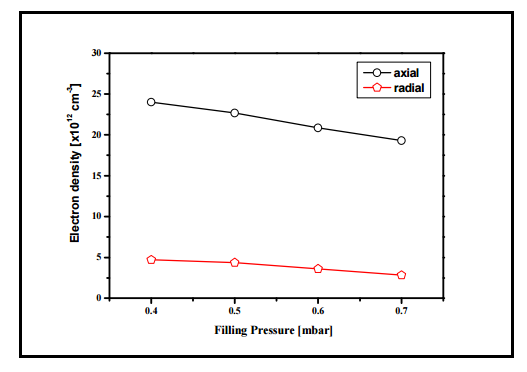
Fig. 6 presents the comparison of electron number density versus filling pressure for both axial and radial direction. The result shows that the electron number density is higher in axial direction as compared to radial direction. As mentioned earlier, this suggests that the electron impact ionization is higher due to strong microwave electric field in the launching region. It is also seen that the electron density decreases as we move farther away from the axis of plasma column. This electron density gradient in radial direction is due to the electron energy gradient [Rousseau et al., 2006].
Moreover, surface wave discharges (SWDs) are a particular class of high-frequency (HF) discharges, where the plasma column being sustained by the electromagnetic surface wave and plasma plays a dual role, acting simultaneously as a component that absorbs the microwave power carried by the wave and as a medium for wave propagation. So the surface-wave creates the plasma that it needs to propagate by dissipating the power it carries. Thus, the wave loses its energy as it propagates along the plasma column, which makes the plasma parameters to vary continuously along the discharge region. For instance, the electron density decreases from the wave launcher toward the end of the plasma column. In a collisional discharge, the absorption of microwave power is thus a function of the collisional frequency of the electrons with other plasma species and is therefore, dependent on the pressure in the discharge. The decrease in the electron density with filling pressure may be due to cooling of energetic electrons through collisional transfer of energy to other plasma species, and thus reduction in electron impact ionization.
Conclusion
The electron temperature and the electron number density in 2.45 GHz microwave argon plasma are determined by using the optical emission spectroscopy technique at constant input power and flow rate. Basic motivation of this experiment is to explore the effect of filling pressure on wave propagation together with excitation and ionization process involved in optical emission. Experimental results indicate that the plasma parameters achieve higher values near the axis compared to end region of the plasma column. This fact may be attributed to energy loss of electromagnetic wave as it propagates along the plasma column, which makes the plasma parameters to vary continuously along the discharge region. The decrease in the energetic number of electrons owing to collisional transfer of energy from electrons to other plasma species at higher pressures and consequently the reduction of electron impact ionization may be the cause of the decrease in electron number density.
Acknowledgement
We are thankful to Dr. Shahid Hussain and Dr. Zahoor Ahmad for their valuable suggestions regarding the improvement of the manuscript. We are also thankful for the technical support of Optics Laboratories especially, from Mr. Ayaz and Mr. Azhar.
References
1. Bogaerts, A. and Gijbels, R. (2002). “Effect of small amounts of hydrogen added to argon glow discharges: Hybrid Monte Carlo—fluid model,” Physical Review E, 65 (5) 056402.
Publisher
2. Zhan, R.J., Wen, X., Zhu, X. and Zhao, A. (2003). “Adjustment of electron temperature in ECR microwave plasma,” Vacuum, 70 (4) 499-503.
3. Fantz, U. (2006). “Basics of plasma spectroscopy,” Plasma Sources Science and Technology, 15 (4) S137.
4. Qayyum, A., Zeb, S., Naveed, M. A., Ghauri, S. A., Waheed, A. and Zakaullah, M. (2006). “Optical emission spectroscopy of the active species in nitrogen plasma,” Plasma Devices and Operations, 14 (1) 61-70.
Publisher
5. Qayyum, A., Zeb, S., Naveed, M.A., Ghauri S. A. and Zakaullah M. (2007). “Optical actinometry of the N-atom density in nitrogen plasma,” Plasma Devices and Operations, 15 (2) 87-93.
6. Ahmad, Z. (2009). “Numerical simulation of a cascaded arc source with different Ar-H2 mixtures of nonlocal thermal equilibrium plasmas,” Physics of Plasmas, 16 (8) 083503.
7. Zhang, J. L., Deng, X. L., Wang, P. S. and Ma, T.C. (2000). “Emission spectrum diagnostics of argon DC discharge,” Vacuum, 59 (1) 80-87.
Publisher – Google Scholar
8. Qayyum, A., Zeb, S., Naveed, M. A., Ghauri S. A. and Zakaullah, M. (2005). “Diagnostics of nitrogen plasma by trace rare-gas—optical emission Spectroscopy,” Journal of Applied Physics, 98 (10) 103303.
9. Behringer, K. (1991). “Diagnostics and modelling of ECRH microwave discharges,” Plasma Physics and Controlled Fusion, 33 (9) 997.
10. Boffard, J. B., Lin, C. C. and De Joseph Jr, C. A. (2004). “Application of excitation cross sections to optical plasma diagnostics,” Journal of Physics D: Applied Physics, 37 (12) R143.
Publisher
11. Malyshev, M. V., Donnelly, V. M. (1997). “Determination of electron temperatures in plasmas by multiple rare gas optical emission, and implications for advanced actinometry,” Journal of Vacuum Science and Technology A, 15 (3) 550.
12. Zhu, X. M., Pu, Y. K. (2010). “Optical emission spectroscopy in low-temperature plasmas containing argon and nitrogen: determination of the electron temperature and density by the line-ratio method,” Journal of Physics D: Applied Physics, 43 (40) 403001.
Publisher
13. Czech, T., Sobchzyk, A. T. and Jaworek, A. (2011). “Optical emission spectroscopy of point-plane corona and back-corona discharges in air,” The European Physical Journal D, 65 (3) 459-477.
14. Bibinov, N., Halfmann, H. and Awakowicz, P. ( 2008). “Determination of the electron energy distribution function via optical emission spectroscopy and a Langmuir probe in an ICP,” Plasma Sources Science and Technology, 17 (3) 035004.
15. Zhu, X. M. and Pu, Y. K. (2008). “Using OES to determine electron temperature and density in low-pressure nitrogen and argon plasmas,” Plasma Sources Science and Technology, 17 (2) 024002.
Publisher
16. Torres, J., Palomares, J. M., Sola A., van der Mullen, J. J. A. M. and Gamero, A. (2007). “A Stark broadening method to determine simultaneously the electron temperature and density in high-pressure microwave plasmas,” Journal of Physics D: Applied Physics, 40 (3) 5929 -5936.
17. Milosavljevic, V. and Poparic, G. (2001). “Atomic spectral line free parameter de-convolution procedure,” Physical Review E, 63 (3) 036404.
18. Abrar, M., Qayyum, A., Gilani A. R., Khan, A. W., Naseer S. and Zakaullah, M (2013). “Effect of helium mixing on excitation temperature and nitrogen dissociation in inductively coupled plasma,” Current Applied Physics, 13 (6) 969- 974.
Publisher
19. Qayyum, A., Zeb, S., Naveed, M. A., Rehman, N. U., Ghauri, S. A. and Zakaullah, M. (2007). “Optical emission spectroscopy of Ar—N2 mixture plasma,” Journal of Quantitative Spectroscopy & Radiative Transfer, 107 (3) 361—371
20. Naveed, M. A., Qayyum, A., Ali,S. and Zakaullah, M. (2006). “Effects of helium gas mixing on the production of active species in nitrogen plasma,” Physics Letters A. 359 (5) 499-503.
21. Brugeat, S. and Coitout, H. (2004). “Determination of electron density in a wall stabilized Ar—CO2 thermal plasma,” European Physical Journal D, 28 (1)101-107.
22. Konjevi, N., Jovievi,S. and Ivkovi,M. (2009). “Optical emission spectroscopy for simultaneous measurement of plasma electron density and temperature in a low-pressure microwave induced plasma,” Physics of Plasmas, 16 (10) 103501.
Publisher
23. Mattei, S., Boudreault, O., Khare, R., Stafford, L. and Donnelly, V. M. (2011) “Characterization of a low-pressure chlorine plasma column sustained by propagating surface waves using phase-sensitive microwave interferometry and trace-rare-gas optical emission spectroscopy,” Journal of Applied Physics 109 (11) 113304.
24. Zhu, X. M., Chen W. C. and Pu, Y. K. (2008). “Gas temperature, electron density and electron temperature measurement in a microwave excited microplasma,” Journal of Physics D: Applied Physics, 41 (10) 105212.
25. Moussounda, P. S. and Ranson, P. (1987). “Pressure broadening of argon lines emitted by a high-pressure microwave discharge,” Journal of Physics B: Atomic and Molecular Physics, 20 (5) 949.
Publisher
26. Ohno, N., Razzak, M. A., Ukai, H., Takamura, S. and Uesugi, Y. (2006). “Validity of Electron Temperature Measurement by Using Boltzmann Plot Method in Radio Frequency Inductive Discharge in the Atmospheric Pressure Range,” Plasma and Fusion Research, 1 (28) 1-9.
27. H. R. Griem, Plasma spectroscopy (New York: McGraw-Hill, 1964)
28. Rousseau, A., Teboul, E. Lang, N. and Roepcke, J. (2002). “Time resolved electron and temperature measurements in a pulsed planar microwave discharge,” Journal of Applied Physics, 92 (7) 3463.