Introduction
Poly(N-vinylpyrrolidone) and PVP belongs to the class of water-soluble polymers and other polar solvents. It is interesting in technological, biological, biomedical applications to absorb proteins and enzymes and for artificial bones and teeth. Specifically, PVP is a bio- and hemocompatible polymer with very low toxicity, so that materials coated with this polymer can be used as medical devices intended for implanting in the human body [1].
PVP is also interesting for technological applications. Its film forming and adhesive qualities are utilized in aerosol hair sprays, adhesives, and lithographic solutions. As a protective colloid, it is used in drug and detergent formulations, cosmetic preparations, polymerization reactions, and in pigment or dyestuff dispersions [2].
Hydroxyapatite, HAp, is a naturally occurring mineral form of calcium apatite with the formula Ca5(PO4)3(OH), but is usually written Ca10(PO4)6(OH)2 with the Ca/P ratio being 1.67. HAp is the hydroxyl end member of the complex apatite group [3, 4].
HAp is a major inorganic component of the hard tissue in the human body. In the past 30 years, hydroxyapatite ceramic implants have attracted much attention as an alternative substance for autogenously free bone grafting. This is because it is the most stable calcium phosphate compound at normal temperatures and the pH between 10 and 12. It is also the most prominent bioactive ceramics since it forms a chemical bonding to bone and is widely used and investigated [5, 6].
The OH group can be replaced by fluoride, chloride or carbonate, producing fluorapatite or chlorapatite. It crystallizes in the hexagonal crystal system. Pure HAp powder is white. However, apatite can have yellow or brown colorations to change the color of dental. Up to fifty percent of bone is made up of a modified form of the inorganic mineral hydroxyapatite [7].
HAp/polymer composites have been developed as bone cements, dental implants or bone substitute material [8, 9]. In this work, we report the effect of amount of Synthetic HAp on the physical properties of Poly(N-vinyl pyrrolidone) composites films.
Experimental
Preparation of Pure Hydroxyapatite
To prepare pure hydroxyapatite (HAp), 0.05M (where M is the molarity) of calcium nitrate, (Ca(NO3)2).4H2O solution was prepared using double distilled water. The solution was stirred on a magnetic stirrer about 6h at temperature 850C to ensure that the calcium ions (ca2+) have been composed. Then, 0.03M of ammonium dihydrogen phosphate (NH4H2PO4) solution was added drop by drop with stirring about 6h at the same temperature. Drops of ammonia solution were added to adjust pH value (10-12) at which a milky white coloration was observed which ensure the formation of hydroxyapatite [4]. After that the above mixture was leaved at room temperature for about 24h to precipitate Hap. Then separate the precipitated amounts by using center fusion with washing it five times by the distilled water to remove any traces or impurities reaction.
Preparation of HAp/PVP Composites
To prepare the HAp/PVP composites, we put a suitable amount of PVP (2gm) in 20 ml double-distilled water with stirring by magnetic stirrer at temperature 850C for about 6h, and then leave the solution for 3h at the room temperature to avoid the formation of bubbles, after that the calcium nitrate solution was slowly added. The calcium nitrate – PVP solution was stirred slowly for 6h at the same temperature, and then the proper amounts (Ca/P molar ratio of 5:3) of ammonium dihydrogen phosphate solution was added drop by drop to the mixture. A milky white coloration was observed when adjusting the pH=10-12 to ensure the formation of the HAp inside the polymer (high values of pH in the solution have been reported to promote HAp nucleation).
Finally, the mixture was put in (polyethylene tetraphythelate) PET- dishes for 3 days in oven at 600C. The different concentrations (4, 6, 8, 15, and 21 wt%) of HAp were prepared inside the polymer. The prepared samples were kept in a desiccator until used.
Measurements
X—Ray diffraction scans were obtained using DIANO corporation-USA equipped using Cu-Kα radiation (λ=1.540 Å, the tube operated at 30 kV, the Bragg angle (2θ) in the range of 5-600. Scanning electron micrograph of the studied samples was performed using SEM (JEOL-JSM 6100), operating voltage at 30KV accelerating voltage. Electron dispersion X-ray (EDX) unit coupled with a scanning electron microscope was used to provide a semi-quantitative analysis of the chemical composition of hydroxyapatite in the HAp/PVP films. TGA was used to characterize the decomposition and thermal stability of prepared samples. The mass of the samples is recorded continuously while temperature is increase at constant rate. Differential scanning calorimetry were carried out by (DSC-50, Shimadzu) at the heating rate 100Cmin-1 for the range of temperature from 30 5000C. The DC Conductivity was measured using an insulation tester (level type T M14) whose accuracy was within ±0.2%.
Results and Discussion
X-Ray Diffraction
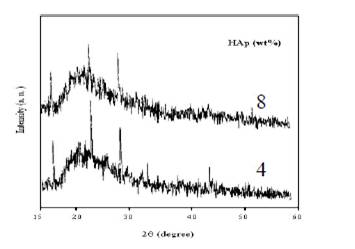
X-Ray diffraction measurement was performed to examine the crystallinity of the prepared films. Figure (1) shows the HAp/PVP composite films with 4 and 8 wt% concentrations of HAp (low concentrations).
Figure 1: X-ray diffraction scans of PVP films filled with 4 and 8 wt% of HAp
Ramya et al. [10] reported that pure PVP has broad peak centered at about 22.5°. Two typical peaks at 2θ=10.1° and 18.1° were observed for pure PVP [11]. In the present work we see that there is no change in this broad peak position while the height of the main peak of X-Ray diffraction for the composite films reduced and the broadness increase when the amount of HAp filler increased. This is because the interaction between HAp and PVP lead to a decrease in the intermolecular interaction between the polymer chains. These results indicate that the composites become more amorphous. Hodge et al. [12] was criterion which has established correlation between the height of the peak and the degree of crystallinity. On the other hand the sharp peaks which appear at about 2θ=17°, 23°, 29° and 45° which are corresponding to (101), (111), (210) and (400), respectively [13].
Also may be there is a significant motion of PVP chains in the amorphous region or maybe there are some defects existing at an interface between the PVP chain and the HAp filler at the same time as there is non-conductivity crystalline phase, therefore, the characteristic of the HAp/PVP composites shows good ionic conductivity transport property. This is due to the more amorphous phase and flexible of local PVP chain segmental motion in the HAp/PVP composites.
For concentration 15 wt%, it is the most confirmation for the formation of HAp in the presence of the polymer which will also be confirmed by the morphological structure which is measured by SEM and EDX analysis.
For larger concentration of HAp (21wt%) which is shown in Figure (2), it reveals that the crystallinity is increased. The peaks appears at 17°, 23°, 29°, 33° and 45° are corresponding to (101), (111), (210), (300) and (400); respectively, [14]. These peaks may indicate that the basic apatite phase is decomposed into different crystalline phases, these phases may be classified to α-Ca3(PO4)2, β-Ca3(PO4)2, Ca4(PO4)2 and Ca4P2O3 which identified among the original apatite [15, 16]. These calcium phosphate phases are bioactive and biocompatible materials.
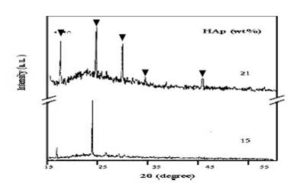
Figure 2: X-ray diffraction scans of PVP films filled with 15 and 21 wt% of HAp
Scanning Electron Microscope
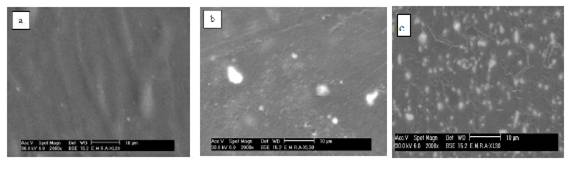
Figure (3a-i) shows SEM micrographs of pure PVP, pure HAp and HAp/PVP composite films with different concentrations of HAp.
Figure (3a-c): Morphology of :(a) pure PVP and PVP filled with different concentrations (b)4 wt% and (c) 8 wt% of HAp
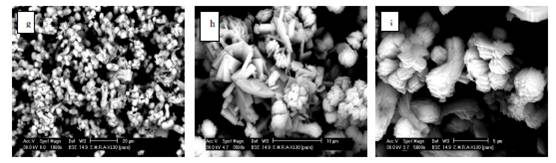
Figure (3d-f): Micrographs of PVP/HAp (15 wt%) with different magnifications (d) 1000X, (e) 2500X and (f) 10000X
Figure (3g-i): Micrographs of pure HAp at different magnifications (g) 1000X, (h) 3500X and (i) 5000X
For pure PVP, image (a) shows a homogenous smoothie structure. After adding a small concentration of calcium phosphate (4wt%) as we can see in image (b), an aggregation of the calcium phosphate particles or chunks that are randomly distributed on the top surface is observed. With increasing HAp concentration (8 wt%) a lot of large and regular arrangement is observed with irregular size as shown in image (c). This indicates that the calcium phosphate particles fillers were completely dispersed-well within the PVP polymeric matrix.
Pictures (g, h and i) of the pure HAp with different magnification (1000, 3500 and 5000); respectively, it reveals that there is more than one form of HAp such as plates, needles and bundles which are also observed in images of filling level (15 wt%) of HAp in addition to spherical form (image f). These results reveal that at 15 wt%, the polymer and the calcium phosphate are compatible and HAp is then formed which will be confirmed further with the EDX analysis.
EDX Analysis
Another elemental composition analysis has been used which is Energy Dispersive X-ray analysis (EDX), from which we can get qualitative and quantitative analysis about the specimen, i.e we can know each element in the sample and its concentration. In the present work, as shown in Figure (4) for 15 wt%, calcium and phosphate had been detected in the samples where the concentration of the calcium is more than the phosphate as the peak of the calcium is much higher than the phosphate one with ratio Ca/P is 1.66 which confirm the formation of hydroxyapatite were the Ca/P ratio in human bone is 1.67 [17].
Figure 4: EDX analysis for PVP/HAp composite of concentration 15 wt% of Hap
Thus, the EDX analysis works as an integrated feature of a scanning electron microscope and for the present work, it is a confirmation for the composition of hydroxy apatite.
Thermogravimetric Analysis
In the thermogravimetric analytical measurements, the mass of the samples is recorded continuously while temperature is increase at constant rate. Weight losses occur when volatiles absorbed by the polymer are driven off and at higher temperatures when degradation of polymer occurs with the formation of volatile products [18].
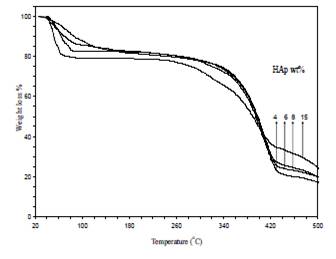
Figures (5) illustrate TGA thermographs of the HAp/PVP composites films in the temperature range from room temperature to 500°C with a heating rate 10°C/min with various concentrations of HAp. The curves in the figure reveal main weight loss regions. The explanation of these regions as follows: a) The change of mass in the first region from about 66°C could be attributed to the partial removal of physically and chemically adsorbed water and possibly lattice water, b) The second transition region (main region) from 300°C is due to the degradation temperature of the PVP [19] with weight loss about 63 to 72 wt%.
Figure 5: TGA thermographs of the as-prepared samples of PVP/HAp composites with different concentration of HAp
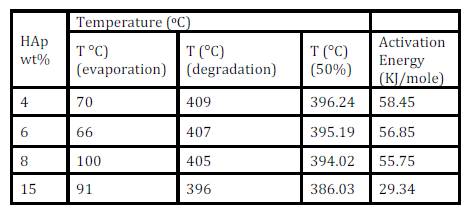
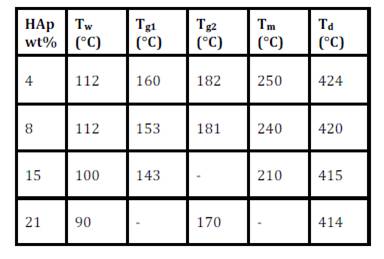
Table (1) shows the results of certain temperatures for the prepared samples. From the thermographs and the table, the degradation temperature was shifted to lower temperatures with decreasing of the area under the peak as the concentration of HAp increased. Also, it can be concluded that the reduction in the thermal stability is due to the effect of HAp as filler and the chemical reactions between PVP and HAp.
Table 1: The TGA results of certain temperatures and activation energy values for the prepared samples with different concentrations of HA
Determination of Activation Energy
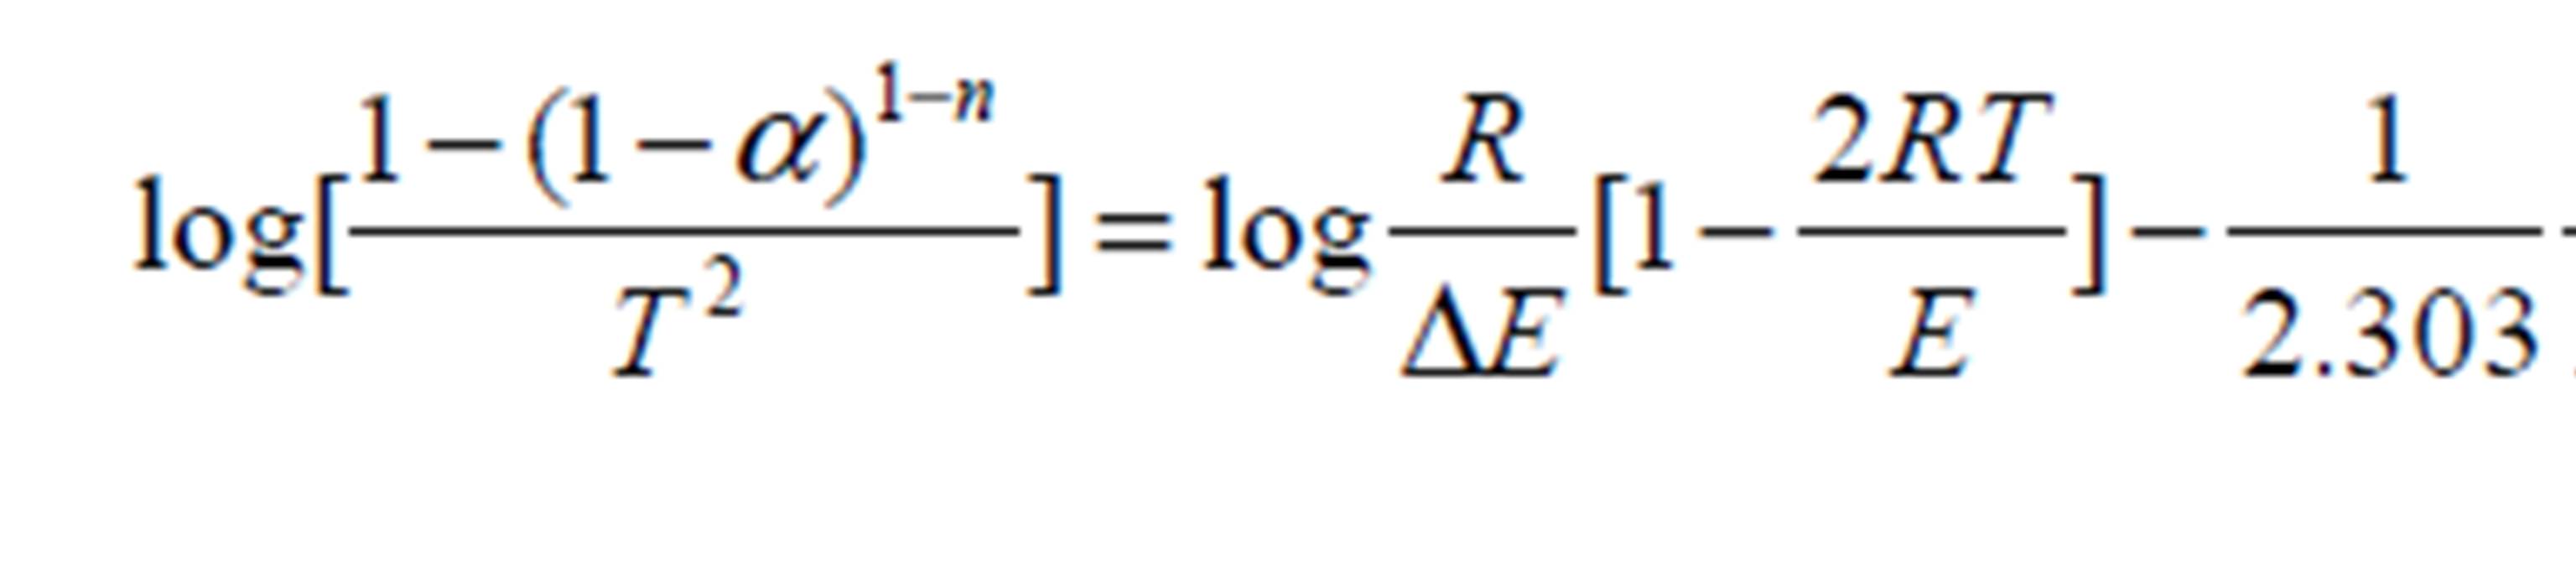
The activation energy for the thermal decomposition for TGA measurments of the present samples, which depends on the residual mass, can be calculated using integral equation of Coats and Redfern [20]:
where T is the absolute temperature, E is the activation energy in J/mol, R is the universal gas constant (8.3136 J/mol K), n is the order of reaction and α is the fractional weight loss at that particular temperature calculated as:
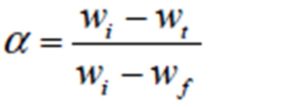
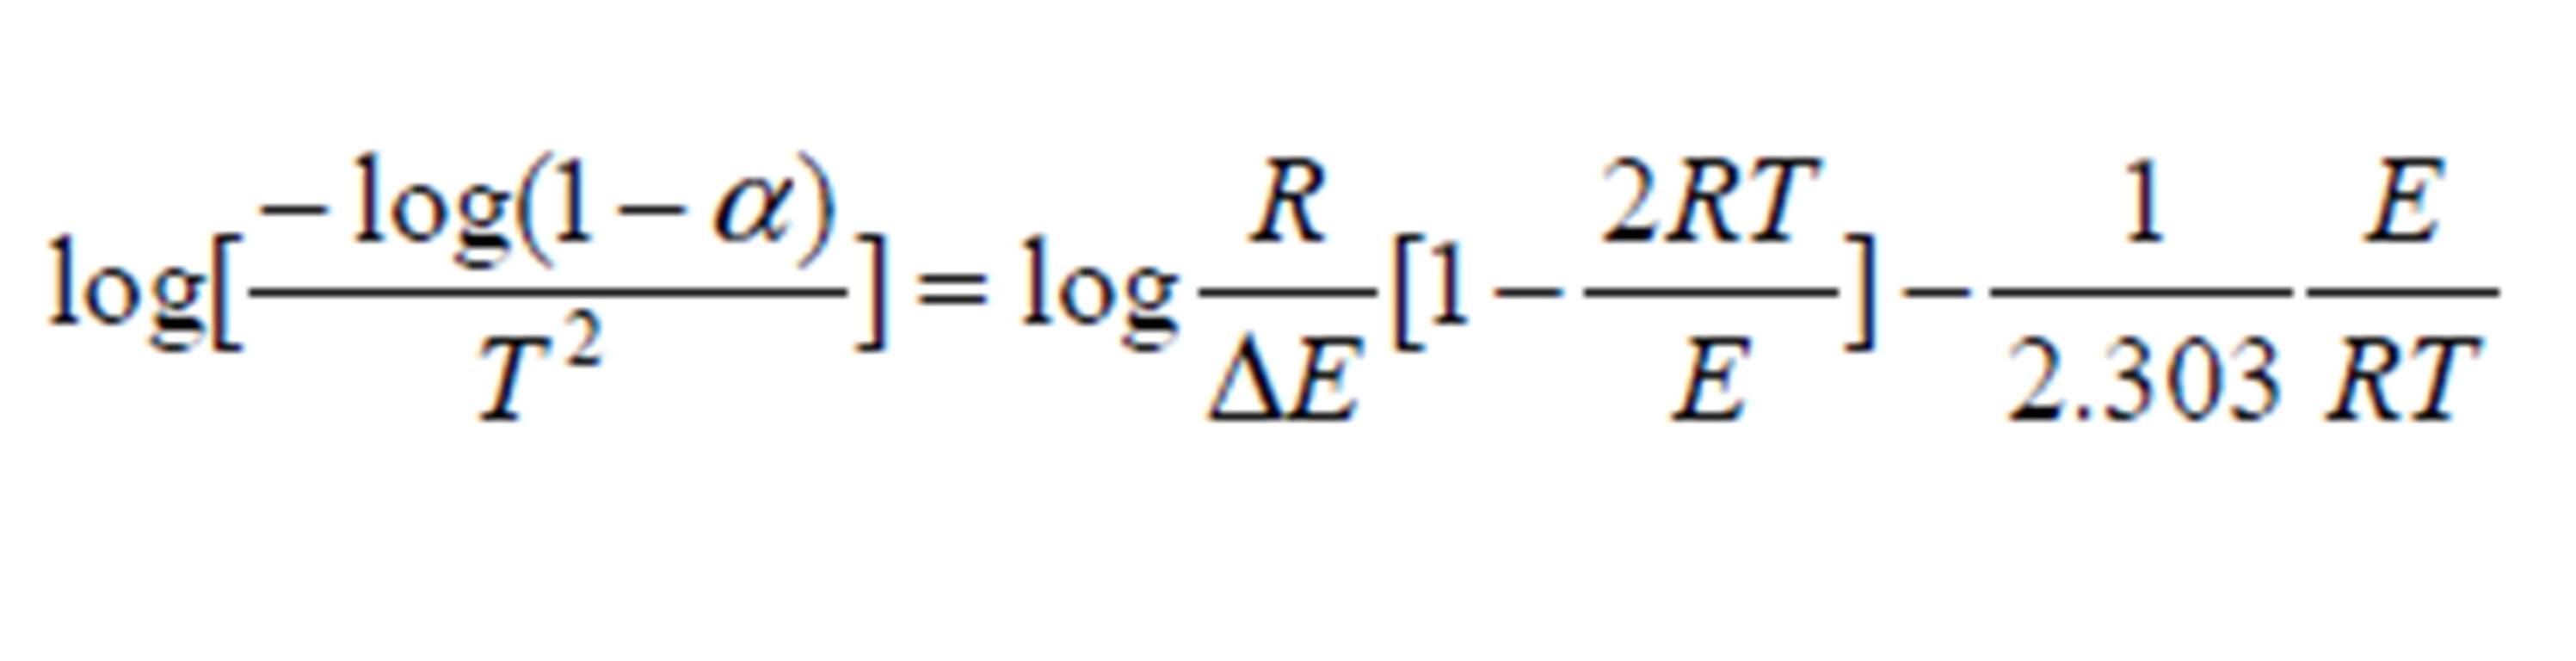
where wi i the initial weight, wt is the weight at given temperature and wf is the final weight of the sample. For n≠1, Cats and Redrern reduces to:
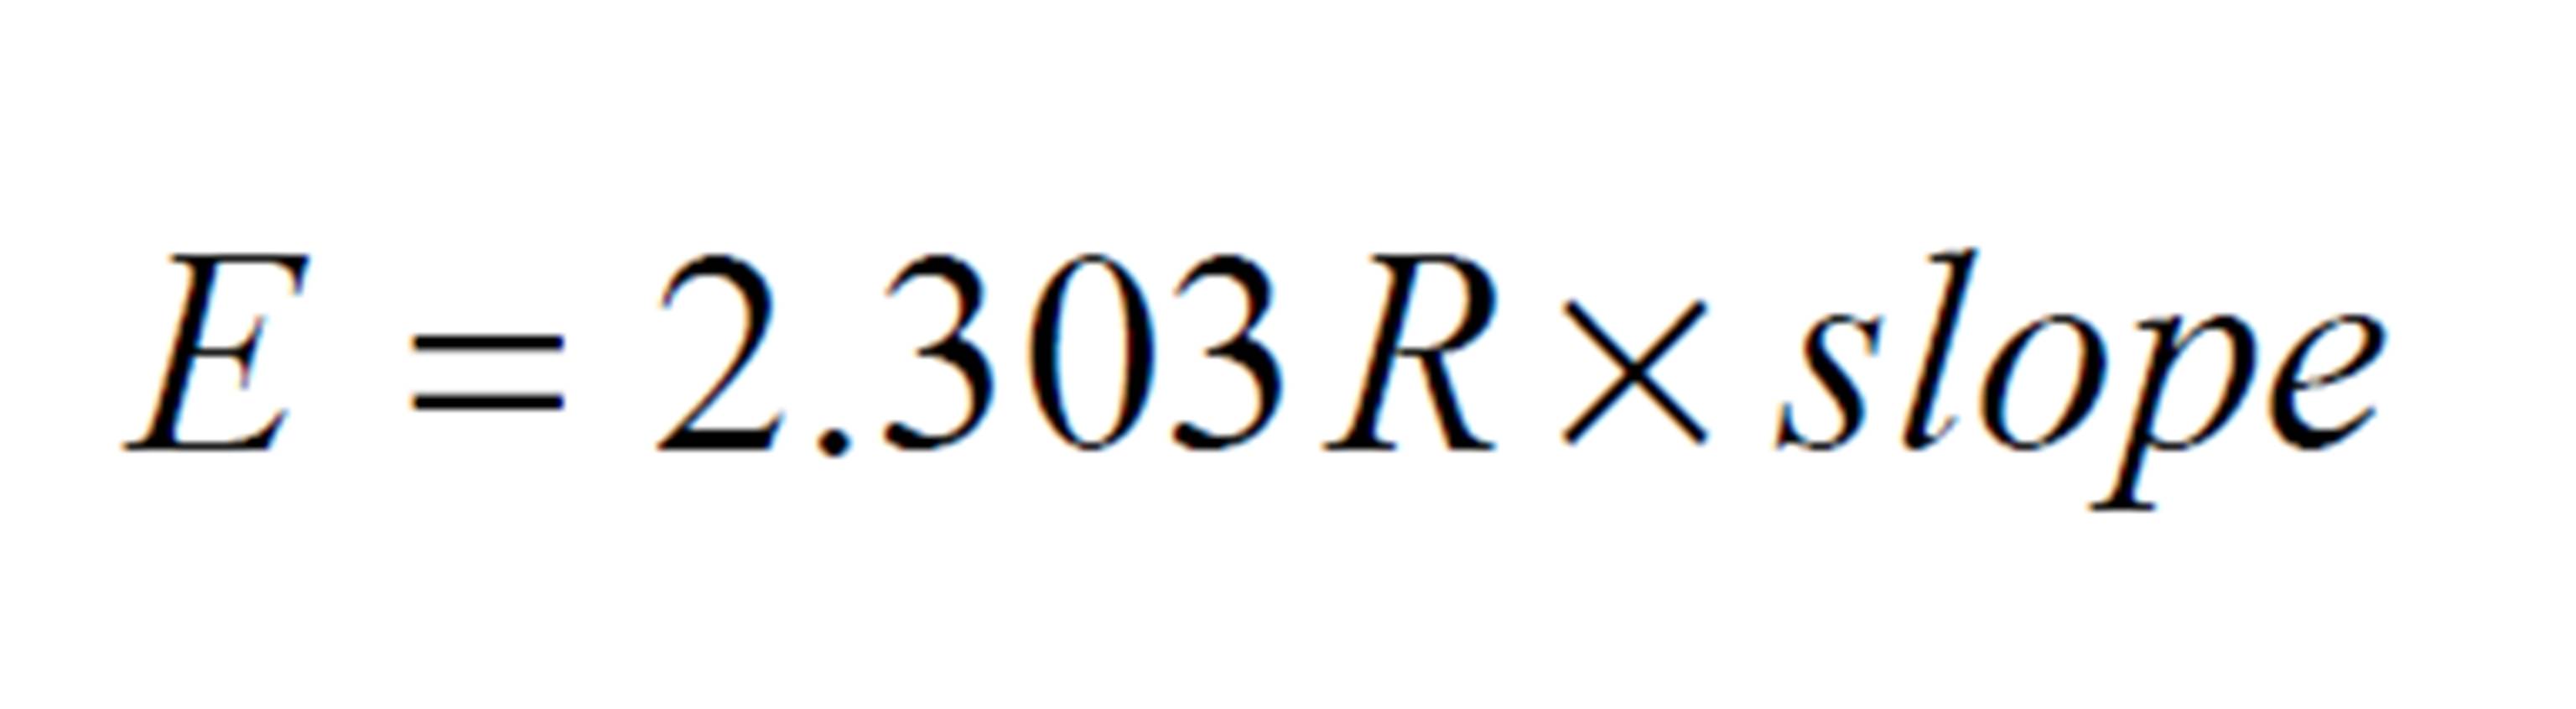
By ploting 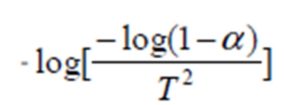 against 1000/T for each sample, we obtain straight line as shown in figure (6). The value of activation energy (E) was calculated from the slope of the plot as:
The calculated activation energies of the samples are shown in Table (1), where it is clear that the values of the activation energy are decreased from 58.45 to 29.34 KJ/mole with increasing the hydroxyapatite content which indicates that the HAp is intensivly affecting the polymer.
Differential Scanning Calorimetry
More direct measurement of thermal properties is possible using differential scanning calorimetry and it is generally preferred for quantitative analysis. DSC is usually employed to measure the glass transition temperature of polymers and melting point [21].
Figure 7: DSC thermographs of PVP as a host material with different concentration of HAp
Figure (7) displays DSC thermographs of PVP as a host material with different concentration of HAp in temperature range of 50°C to 600°C. As we see, all DSC curves of the prepared films in the figure exhibited endothermic peaks. The thermographs are characterized by five main endothermic peaks: Small peak (Tw) in the range of 90-112°C, it is may be assigned to the moisture, the endothermic peak (Tg1) in the range of 143-160°C which can be assigned to the glass—rubber transition due to the micro-brownian motion of main chain segments of the polymer [22], the endothermic peak (Tg2) in the range of 170-182°C may be assigned to the glass transition of the β-microphase formed in the α-phase [23-25], endothermic peak in the range from 210 to 250°C is assigned to melting temperature (Tm) of PVP and the other sharp peak (main peak) in the range of 414°C to 424°C is attributed to decomposition temperature of PVP. The values of Tw, Tg1, Tg2, Tm and Td for all the films are collected in Table (2).
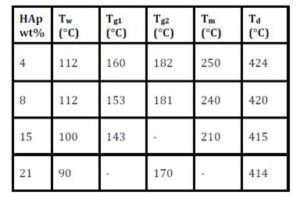
Table 2: X-ray diffraction scans of PVP films filled with 15 and 21 wt% of Hap
It is remarkable that in the figure and the table, the values of the glass transition temperatures of both Tg1 and Tg2 are decreased with increasing the content of the HAp filler. This suggests that the segmental mobility of amorphous polymer increases due to the addition of HAp and become less rigid segments. This indicates that the HAp filler act as plasticizer. The thermal degradation temperature, Td, is also decreased with increasing the concentration of HAp, and it is suggested that the addition of the filler to the PVP films decreases the thermal stability; therefore, the HAp molecules greatly affected the PVP structure which also confirms the TGA results.
DC Conductivity Measurements
DC conductivity values can be calculated from the following equation:
where L is the thickness in cm, R is the resistance in ohm and A is the surface area of the sample in cm2. The temperature dependent DC conductivity measurements were carried out from the room temperature to 434 K to analyze the mechanism of the conduction for the present system.
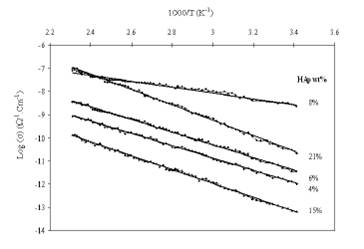
Figure (8) shows the variation of DC conductivity (Log σ) with the reciprocal of absolute temperature for the HAp/PVP composite films with different concentrations of HAp. The plots show linear variation, which suggests an Arrhenius behavior. The results also show that the ionic conductivity increases with adding HAp content for up to 1.26×10⁸ Ω Cm. This may be due to some change occurs in the polymer matrix after adding the HAp filler.
Figure 8: variation of DC conductivity (Log σ) with the reciprocal of absolute temperaturefor PVP/HAp films filled with different concentrations of HAp
Conclusions
The composites of Hap/PVP were prepared and studies using different techniques. For XRD, the height of the main peak for HAp/PVP composites reduced with increase of the broadness when HAp increased for lower concentrations. The larger concentrations of HAp revealed that the crystallinity was increased with formation of HAp in the polymer. The peaks of pure apatite were appeared indicated that the basic apatite phase is decomposed into different crystalline phases. The SEM for pure PVP show a homogenous smooth structure but for pure HAp reveals that there is more than one form of HAp such as plates and needles. The EDX analysis confirms the formation of HAp in polymeric matrix. The TGA thermographs depicts the degradation temperature of PVA was shifted to lower temperatures with decreasing of the area under the peak. Thermal stability was reduced due to the chemical reactions between PVP and HAp. The DSC curves suggested that the segmental mobility of amorphous polymer increases due to addition of HAp and become less rigid segments. The magnitude of thermal degradation temperature suggested that the addition of HAp to the PVP films decreases the thermal stability; therefore, HAp molecules greatly affected PVP structure. The DC conductivity plots show linear variation, which suggests an Arrhenius behavior. The results show that the ionic conductivity increases with adding HAp content for up to 1.26×10⁸ Ω Cm. Finally, the present work can be applied for various issues like preparing the HAp in the polymeric matrix of PVP which can be used in various bio-applications.
References
1. C. Doneux, R. Caudano, J. Delhalle, E. Leonard-Stibbe, J. Charlier, C. Bureau, J. Tanguy and G. Lecayon, Langmuir 13 (1997) 4898.
Publisher – Googlescholar
2. E. M. Abdelrazek, I. S. Elashmawy and S. Labeeb, Physica B: 405 (2010) 2021.
Publisher – Googlescholar
3. S. Mollazadeh, J. Javadpour and A. Khavandi, Ceram. Int. 33 (2007) 1579.
Publisher – Googlescholar
4. H. Tanaka, T. Watanabe, M. Chikazawa, K. Kandori and T. Ishikawa, J. Coll. Interface Sci. 214 (1999) 31.
Publisher – Googlescholar
5. N. Degirmenbasi, D. M. Kalyon and E. Birinci, Coll. Surfaces B: Biointerfaces 48 (2006) 42.
Publisher – Googlescholar
6. G. Wu, B. Su, W. Zhang and C. Wang, Mater. Chem. Phys. 107 (2008) 364.
Publisher – Googlescholar
7. J. L. Carlos and J. Carneiro, Basic Histology, Text and Atlas 10th edition McGraw-Hill Companies (2003) 144.
8. S. N. Nazhat, M. Ketlomari, P. Tormala, K. E. Tanner and W. Bonfield, J. Biomed. Mater. Res. 58 (2001) 335.
Publisher – Googlescholar
9. N. Ignjatovic, S. Tomic, M. Dakic, M. Miljkovic, M. Plavsic and D. Uskokovic, Biomater. 20 (1999) 809.
Publisher – Googlescholar
10. C. S. Ramya, S. Selvasekarapandian, T. Savitha, G. Hirankumar and P. C. Angelo, Phys. B: Cond. Mat. 393 (2007) 11.
Publisher – Googlescholar
11. C. Lui, C. Xiao and H. Liang, J. Appl. Plym. Sci. 95 (2005) 1405.
Publisher – Googlescholar
12. R. M. Hodge, G. H. Edward and G. P. Simon, Polym. 37 (1996) 1371.
Publisher – Googlescholar
13. H. Yu, H. Zhang, X. Wang, Z. Gu, X. Li and F. Deng, J. Phys. Chem. of Solids 68 (2007) 1863.
Publisher – Googlescholar
14. S. Sang, Q. Wu, and Z. Gana, Electrochim. Acta 53 (2008) 5065.
Publisher – Googlescholar
15. A. G. El-Shahawy, Effect of Irradiation on Some Physical Properties of Doped Polymers with Biomaterials; M.Sc. Thesis, Mansoura University, (2008).
16. I. S. Elashmawi and H. E. Abdel Baieth, Current Applied Physics 12 (2012) 141.
Publisher – Googlescholar
17. S. Dimovic, I. Smiciklas, I. Plecas, D. Antonovic and M. Mitric, J. Hazardous Mater. 164 (2009) 279.
Publisher – Googlescholar
18. D. Compbell, R. A. Pethrick and J. R. White, Polymer Characterization, Physical techniques, 2nd edition, Stanley Thornes Ltd, Cheltenham (2000) p. 472.
Googlescholar
19. C. C. Yang, C. T. Lin and S. J. Chiu, Desalination 233 (2008) 137.
Publisher – Googlescholar
20. A. W. Coats and J. P. Redfern, Nature 201 (1964) 68.
Publisher – Googlescholar
21. G. Wypych Ed., Hand book of plasticizers, Chem. Tec. Publishing (2004).
Googlescholar
22. P. Hedvig, Dielectric Spectroscopy of Polymers, Adam Hitger Ltd., Bristol (1977) 76.
23. E. M. Abdelrazek, Phys. B: 351 (2004) 83.
Publisher – Googlescholar
24. S. M. Toghizadeh, H. Mirzadeh, M. Barikani and M. Yousfi, J. Adhesion and Adhesives, 29 (2009) 302.
25. Y. D. Wang and M. Cakmak, Appl. Polym. Sci. 68 (1998) 909.
Publisher – Googlescholar