Introduction
The epidermal growth factor (EGF) system consists of four receptor tyrosine kinases (EGF receptor (EGFR), HER1, HER2, HER3 and HER4) and more than ten ligands including EGF and heparin-binding EGF-like growth factor (HB-EGF) [Melenhorst et al., 2008]. EGF binds only EGFR, whereas HB-EGF binds both EGFR and HER4. Many members of the EGF system are expressed in the kidney both during development and in adulthood [Melenhorst et al., 2008; Zeng et al., 2009]. In addition to playing a role in kidney development, EGF, HB-EGF, and EGFR appear to regulate renal hemodynamics, glomerular filtration rate, and renal sodium and magnesium reabsorption [Zeng et al., 2009], although the exact mechanisms and functional implications have not been fully expounded. Recent studies have shown that the EGF system may be an important modulator, both in the recovery from acute kidney injury and in the progression of chronic kidney disease. Thus, targeting the EGF pathway may benefit patients with kidney dysfunction [Tang et al., 2013].
We previously showed that cobalamin (Cbl) loading induces an altered expression pattern of the EGF system in the spinal cord of rodents [Mutti et al., 2013]. As a result of tubular reabsorption, high levels of Cbl are accumulated in the rodent kidney [Hygum et al., 2011; Lildballe et al., 2012]. Based on these observations, we hypothesize that Cbl may exert physiological effects modulating the EGF system in the kidney. Liver and submaxillary gland were also analysed for comparison purposes. They both play a primary role in the Cbl metabolism even if the accumulation after microinfusion treatment is not pronounced [Lildballe et al., 2012; Mutti et al., 2013].
We investigated the effect of four weeks administration of high and very high doses of Cbl on the expression of the four EGF receptors and two ligands (EGF and HB-EGF) in mouse kidney, liver, and submaxillary gland. We further evaluated the effect of Cbl on the renal expression of the injury markers, kidney injury molecule-1 (KIM-1) and neutrophil gelatinase-associated lipocalin (NGAL).
Methods
Study design
Organ samples were retrieved from two previous studies [Lildballe et al., 2012; Mutti et al., 2013a]. In the first study [Lildballe et al., 2012], mice were treated for four weeks using osmotic minipumps filled with either 0.9 % NaCl (control mice very high dose (n=7)) or 40 nmol/day cyanocobalamin (CNCbl) (Cbl-very high dose mice (n=7)). The study design for the second study [Mutti et al., 2013a] was similar to the first one, except that mice were treated with 3.5 nmol/day CNCbl (Cbl-high dose mice (n=7)). In accordance with the first study, the controls were treated with 0.9 % NaCl (control mice-high dose, n=5). All animal experiments were carried out in accordance with provisions for the animal care license provided and approved by the Danish National Animal Experiments Inspectorate (provision no 2010/561-1855).
Analysis of gene transcription level
RNA extraction and cDNA synthesis
Aliquots (20-30 mg) of frozen tissue were used for extraction of RNA. Total RNA was purified using QIAamp RNA Blood kit® (Qiagen, Merck Eurolab A/S, Albertslund, Denmark), and the fully automated QIAcube (Qiagen) was used according to the instructions given by the manufacturer. All samples were treated with DNase using the RNase-Free DNase Set® (Qiagen). After purification, RNA concentration was determined by optical density at wavelengths of 260 nm by use of a GeneQuant II® (Pharmacia Biotech, Cambridge, England).
0.1 µg of RNA (1 µL) was mixed with 5 µL MgCl225 mM, 2 µL10 × PCR buffer II, 1 µL Oligo d(T)16 50 µM, 8 µL 10 mMdNTPmix (dATP/dTTP/dCTP/dGTP), 1 µL MuLV (Moloney murine Leukaemia Virus) reverse transcriptase (50 U/mL), 1 µL RNase inhibitor (20 U/mL), and 1 µL water in a total volume of 20 µL (all reagents from Applied Biosystems, Carlsbad, CA). cDNA was synthesised by incubation at 42°C for 30 minutes, and the process was stopped by 99°C for 5 minutes. cDNA was either analysed immediately or stored at −20°C.
Quantitative reverse transcription-PCR
Quantitative reverse transcription-PCR was performed as described previously [Mutti et al., 2013], however, this time not including the markers of kidney injury (KIM1 and NGAL). For KIM1 and NGAL, 1 µL cDNA synthesised, as described above, was mixed with 5 µL SYBR Green (Light Cycler 480 SYBR Green 1 Master, Roche, Indianapolis, USA), 1 µL 5 pmol/µL forward and reverse primers, and RNase free H2O to a volume of 10 µL. The PCR programme was conducted as follows: preincubation for 10 minutes at 95 °C followed by 40 cycles of: 10 s at 95 °C, 20 s at 60 °C, and 30 s at 72 °C. Calibration, positive and negative samples were included in each run. RNA extracted from a pool of liver samples from control mice was used as a calibrator control for mouse EGFR and HER3, whereas RNA extracted from a pool of kidney samples from control mice was used as a calibrator for all the other genes. The calibration curves for each of the mRNAs examined were constructed from serial dilutions of RNA from the different sources. The primer sequences of genes involved in the mouse EGF system have previously been published [Mutti et al., 2013].The primer sequences used for KIM-1 and NGAL were 5´-AAACCAGAGATTCCCACACG-3´ (forward primer), 5´-TGTCACAGTGCCATTCCAGT-3´ (reverse primer) for KIM-1 and 5´-CCAGTTCGCCATGGTATTTT-3´ (forward primer), 5´-GGTGGGGACAGAGAAGATGA-3´ (reverse primer) for NGAL.
The mRNA levels were quantified using LightCycler 480 (Roche A/S, Hvidovre, Denmark) software version 3.3 with the second derivative maximum method of quantification.
mRNA was expressed relative to the expression of β-actin. In order to compare the levels obtained from different organs in control mice, the mRNA level was expressed relative to the mean value of the kidney. To explore the changes induced by treatment with Cbl, all mRNA values were expressed relative to the mean obtained for the same organ in controls. Since the results showed little or no deviations between the two doses of Cbl for liver and submaxillary gland, data from the two experiments were pooled, while data for the kidney was treated independently for each of the groups treated with different doses of Cbl.
Statistical analysis
Non-parametric Wilcoxon tests were used to compare data from quantitative reverse transcription-PCR [Yuan et al., 2006]. The calculations were performed using Microsoft Office Excel 2003 and Graph Pad Prism 4. An α-level of 0.05 or less was considered the limit of statistical significance in all of the tests.
Results
We analysed the expression of the EGF system in Cbl-accumulating organs of mice after four weeks of infusion with sodium chloride (controls), 3.5 (high) or 40 (very high) nmol Cbl per day.
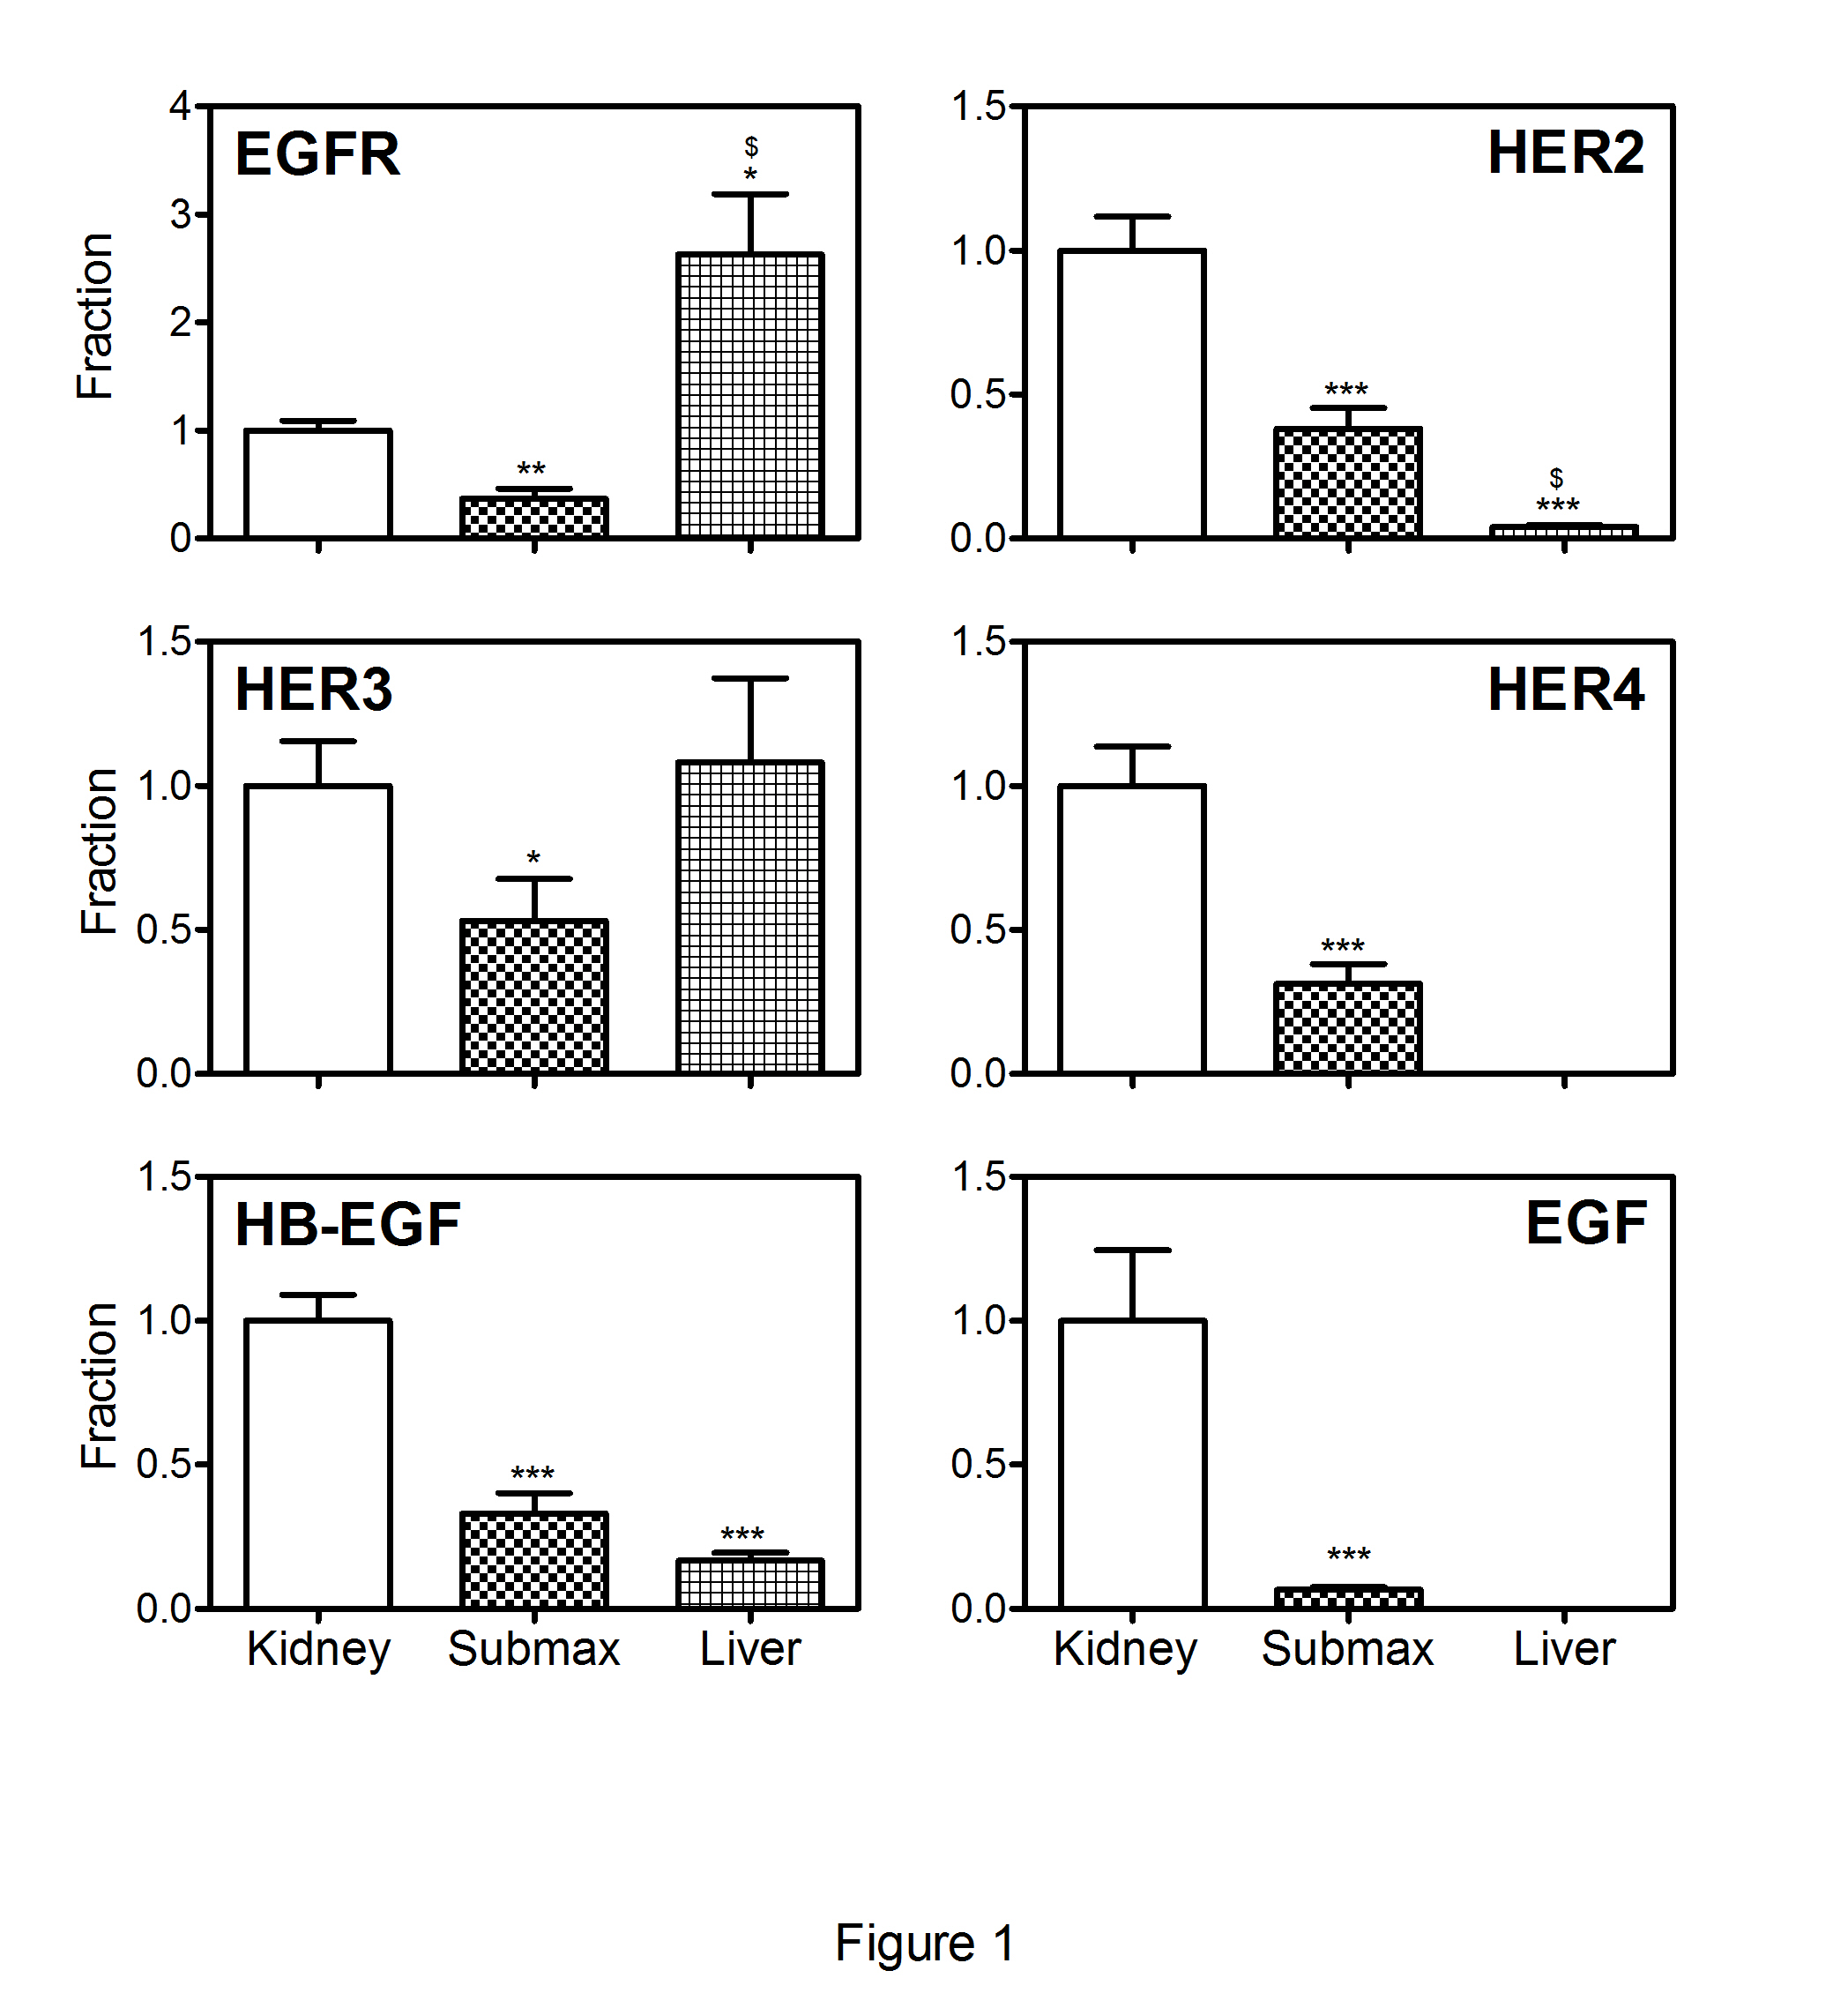
The results of the combined groups of control mice are shown in Figure 1. EGFR is highly expressed in the liver when compared to kidney and submaxillary gland, while an almost equal expression of HER3in the three organs is observed. HER2, HER4, EGF and HB-EGF show the highest expression in the kidney, followed by the submaxillary gland. The liver shows a low expression of HER2 and HB-EGF, while no HER4 and EGF could be detected.
Figure 1: Transcript levels of EGF system genes in control mice.
The columns show mean (+SEM) mRNA levels determined by quantitative reverse-transcriptase -PCR and expressed relative to mean kidney expression of the appropriate controls. The results from the two control groups, (high (n=5) and very high (n=7) Cbl dose), are depicted together for each organ. Non-parametric Wilcoxon tests were employed to calculate significant differences; *p<0.05, **p<0.01, ***p< 0.001 refer to the differences of expression in the kidney, $p<0.001refers to the difference between expression in the liver and the submaxillary gland. EGFR, epidermal growth factor receptor; HER2, HER3 and HER4: epidermal growth factor receptor 2-4, EGF: epidermal growth factor, HB-EGF, heparin-binding EGF-like growth factor, submax, submaxillary gland
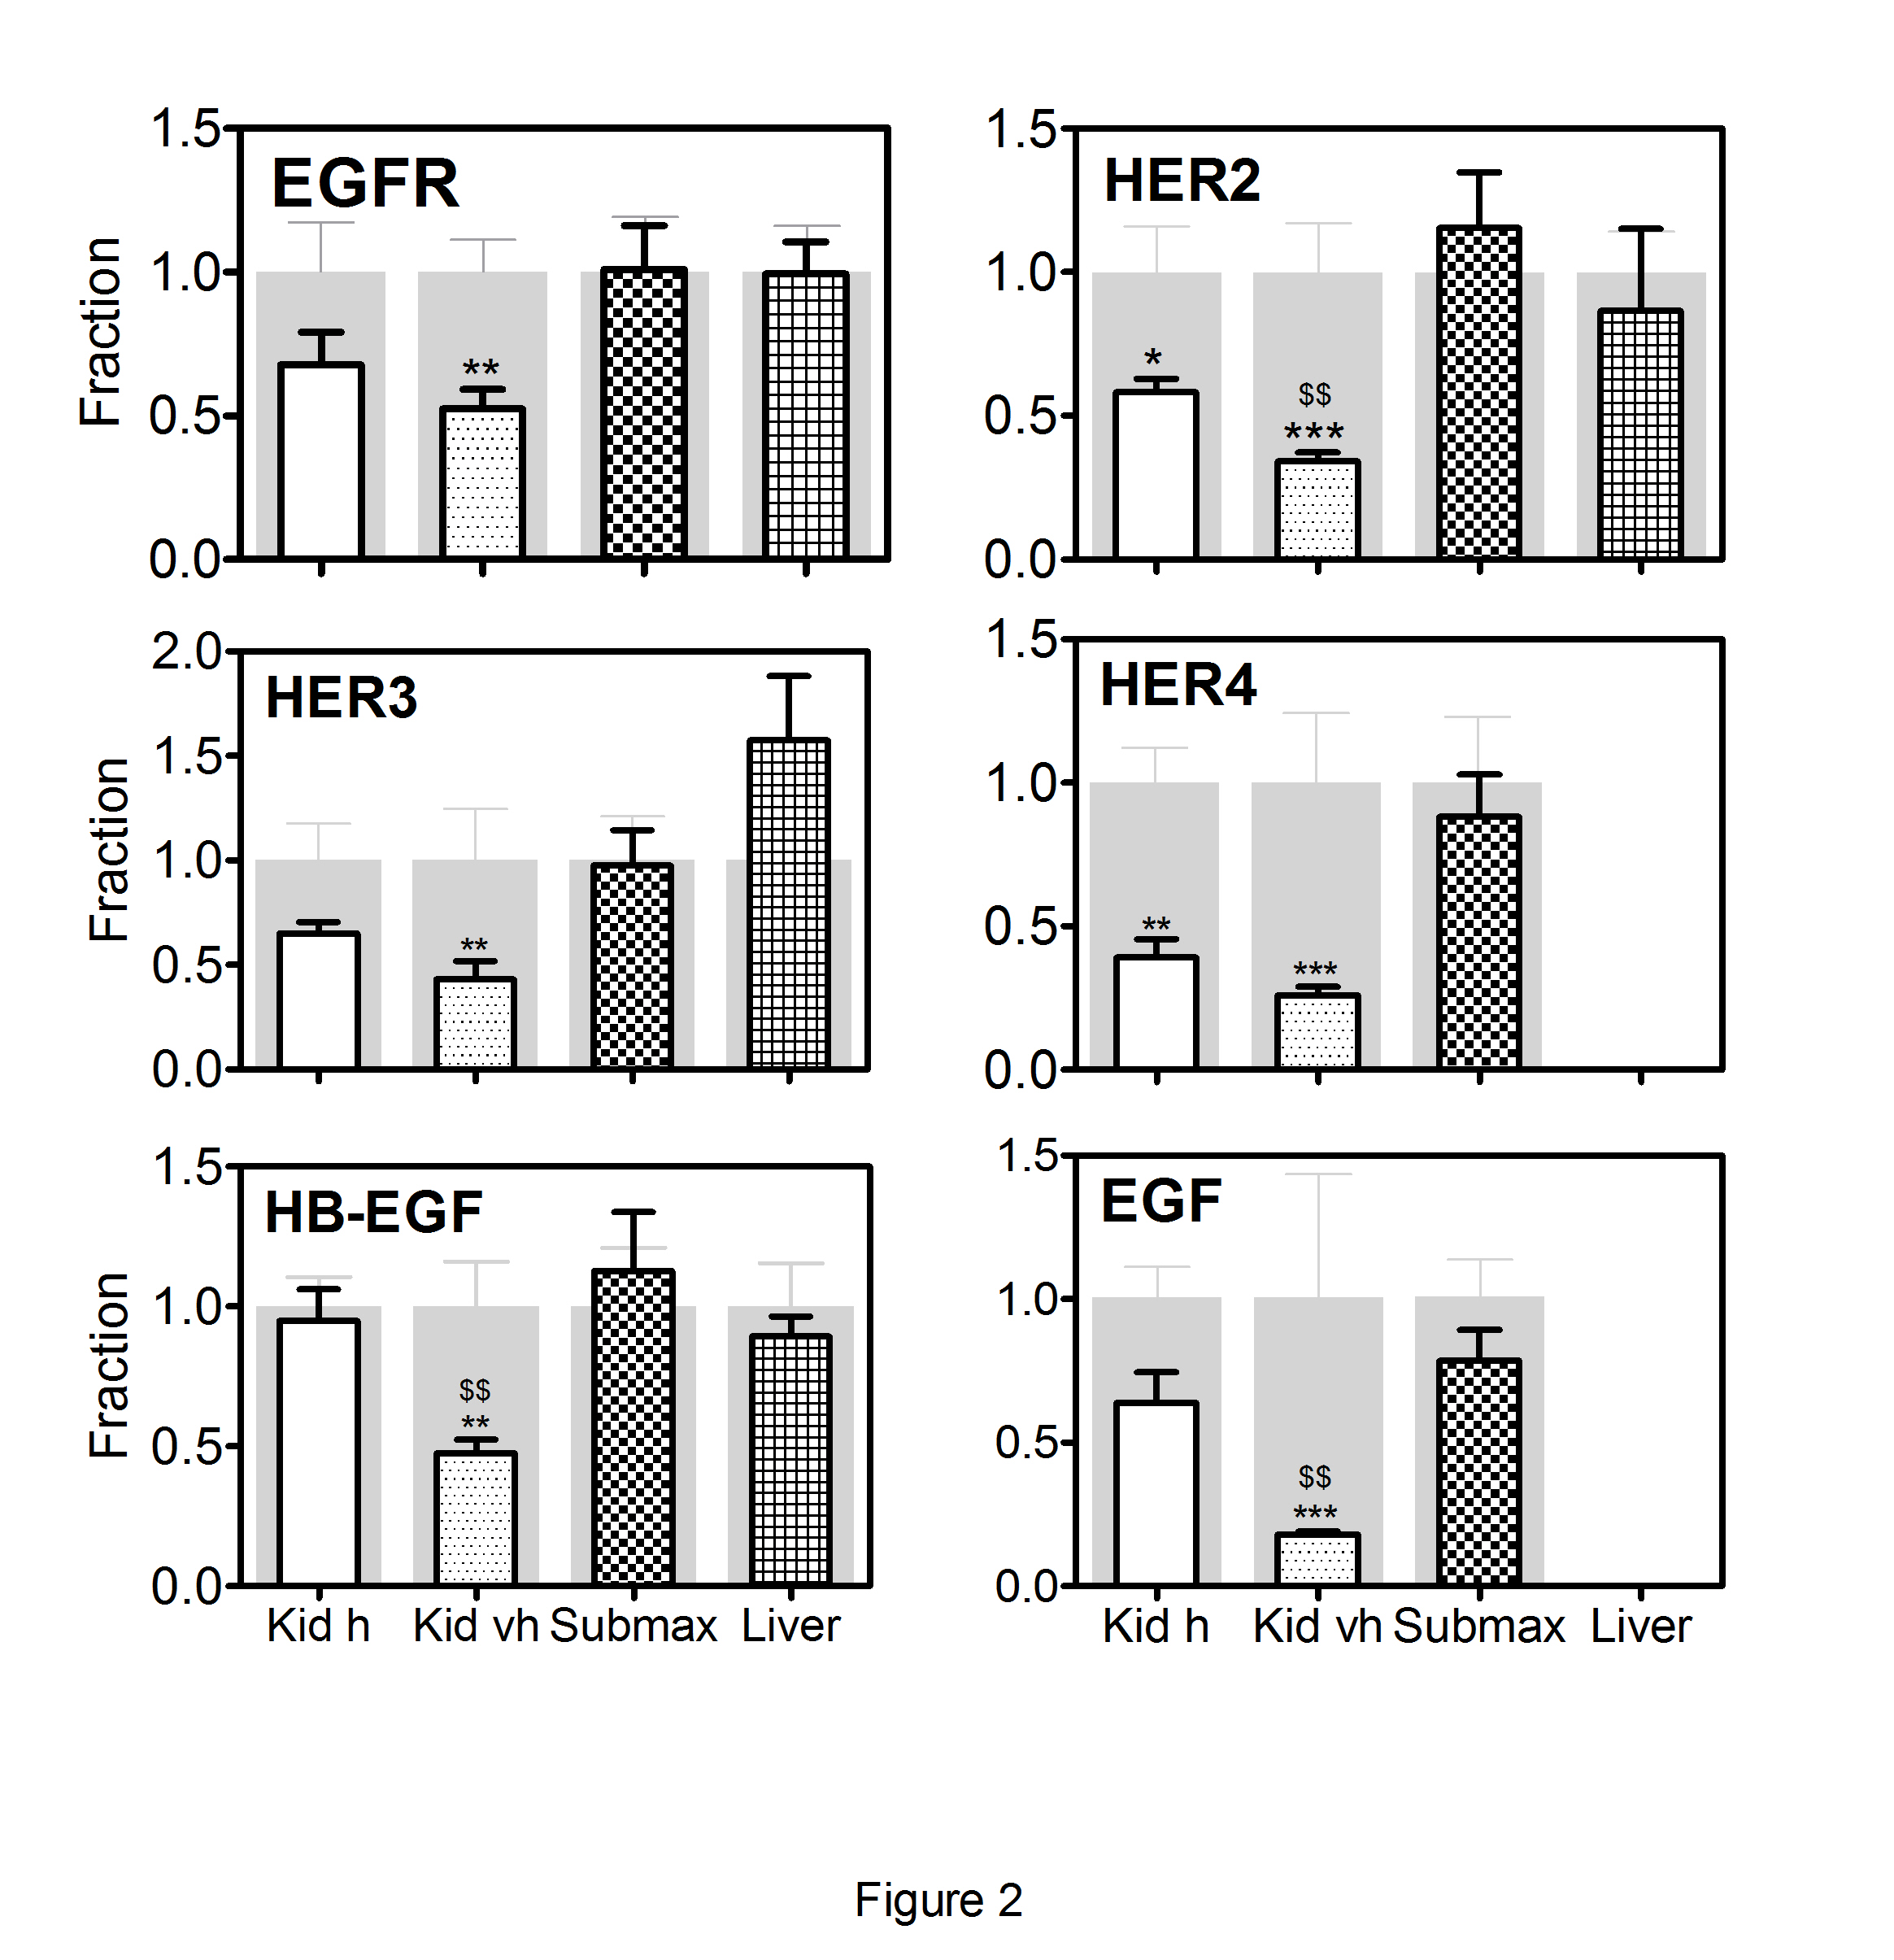
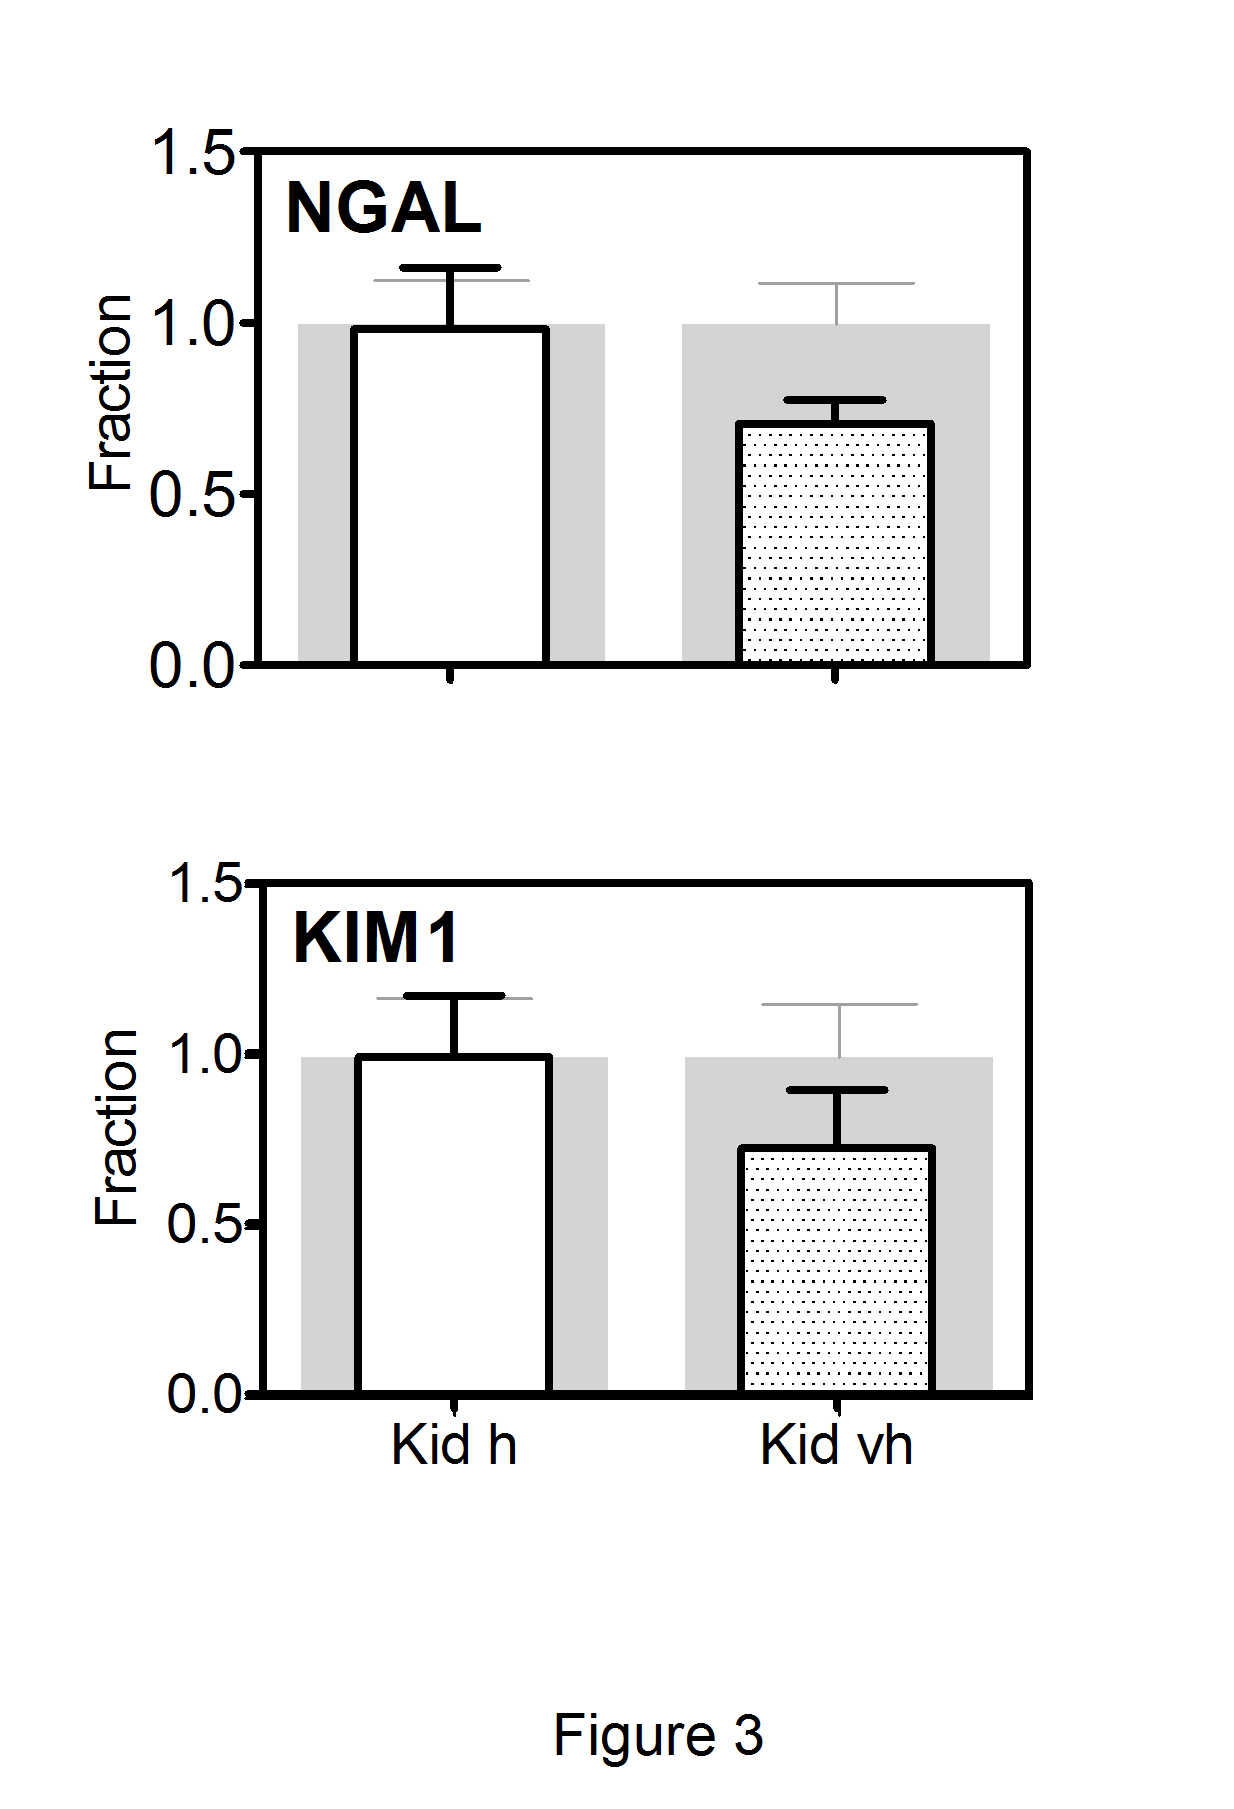
Treatment with Cbl led to changes in the expression of the EGF system in the kidneys, while only minor changes were observed in the other two organs. Consequently, the results using the two different doses of Cbl are combined for submaxillary gland and liver (Figure 2). In the kidneys, all analysed components of the EGF system showed a dose-dependent decline in the mRNA expression profiles; and for HER2, HB-EGF, and EGF, the decline was significantly greater in animals treated with very high- doses compared to high doses of Cbl. To explore whether the altered kidney expression of the EGF system induced kidney tubular damage, we examined the expression of KIM-1 and NGAL. No significant changes were observed in the transcription levels of the two markers following treatment with Cbl (Figure 3).
Figure 2: Changes in transcript levels of the EGF system genes after treatment of mice with Cbl.
Kidney, liver and submaxillary gland were removed from mice treated for 28 days with a high dose of Cbl (3.5 nmol/day, N=7) or saline (controls N=5) and in mice treated with a very high dose of Cbl (40 nmol/day, N=7) or saline (controls N=7).The columns in front show mean (+SEM) mRNA levels determined by quantitative reverse-transcriptase-PCR and expressed relative to mean expression in the respective organs of the appropriate controls. The grey background columns show the mean (+SEM) for the controls. The data from the two types of Cbl treatment, (high (h) and very high (vh) dose), in the submaxillary gland and liver were pooled, since the results did not differ significantly between the two groups. Non-parametric Wilcoxon tests were employed to calculate significant differences; *p<0.05, **p <0.01, ***p < 0.001 refer to the differences compared to control animals;$$p<0.005 refers to the difference compared to the high dose.
EGFR, epidermal growth factor receptor; HER2, HER3 and HER4: epidermal growth factor receptor 2-4, EGF: epidermal growth factor, HB-EGF, heparin-binding EGF-like growth factor, Kid h, kidney Cbl high dose; Kid vh, kidney Cbl very high dose; submax, submaxillary gland.
Figure 3: Changes in transcript levels of the two markers of renal tubular injury(NGAL and KIM1) after treatment with Cbl.
Kidney was removed from mice treated for 28 days with a high dose of Cbl (3.5 nmol/day, N=7) or saline (controls N=5) and mice treated with a very high dose of Cbl (40 nmol/day, N=7) or saline (controls N=7). The columns in front show mean (+SEM) mRNA levels determined by quantitative reverse-transcriptase-PCR and expressed relative to mean expression in the appropriate controls. The grey background columns show the mean (+SEM) for the controls. Non-parametric Wilcoxon tests revealed no significant difference between controls and treated groups. Kid h, kidney Cbl high dose; Kid vh, kidney Cbl very high dose.
Discussion
We show differential expression of the EGF system in mice kidney, submaxillary glands and liver, and that in the kidney, the mRNA levels of this system can be significantly decreased upon four weeks of treatment with very high or high doses of Cbl. We have previously demonstrated that treatment with very high or high doses of Cbl induces respectively a 4-fold and a3.5-fold increase in the Cbl content of the kidney [Lildballe et al., 2012; Mutti et al., 2013a].
The correlation between EGF and Cbl status was originally suggested by Scalabrino and co-workers showing a decrease in the expression of EGF and EGFR in the central nervous system of Cbl-deficient rats [Scalabrino et al., 1999; Mutti et al., 2011]. Recently, we expanded these studies also showing alterations in the expression of HER3 and some EGF-ligands in the spinal cord of mice treated with Cbl for several weeks [Mutti et al., 2013].
In this study we identify, for the first time, a dose-dependent decline in mouse kidney expression of receptors and ligands of the EGF system upon four weeks treatment with Cbl. The underlying molecular mechanisms are unknown; however, one may speculate that it is related to accumulation of Cbl in the kidney [Mutti et al., 2013; Lildballe et al., 2012]. It is unlikely that down-regulation of the EGF system in Cbl-loaded mice is due to an increase in DNA methylation as a result of an increased activity of methionine synthase [Scalabrino et al., 2008; Bird, 2002] since we observed a significant increase in plasma homocysteine levels in the group of mice treated with very high doses of Cbl [Lildballe et al., 2012]. As an in vitro study demonstrated that EGF positively regulates the level of its own receptor [Thompson and Rosner, 1989], we could hypothesize that the EGFR decrease is a consequence of the down-regulation of EGF observed in mice loaded with very high doses of Cbl.
In acute kidney injury, members of the EGF system have been suggested as important mediators of renal repair [Humes et al., 1989; Sakai et al., 1997; Hirschberg and Ding, 1998]. In chronic kidney disease, however, the EGF-system has been implicated in the progressive loss of renal function by promoting interstitial fibrosis, tubular atrophy and glomerular injury [Terzi et al. 2000; Chen et al., 2012; Liu et al., 2012; Tang et al., 2013]. So far, no studies have demonstrated a beneficial or detrimental effect of Cbl in kidney disease. In a study evaluating the effect of vitamin B supplementation, including vitamin B12, on diabetic kidney disease, a greater decline in renal function was observed in patients treated with vitamin B compared to placebo, in particular in patients with a baseline GFR<50 ml/min/1.73 m2 [House et al., 2010; Spence, 2013]. Whether this is related to Cbl supplementation or Cbl-induced changes in the EGF-system is unknown, but our data suggest that this should be further explored. Our finding of no change in the renal expression of KIM-1 and NGAL suggests that even very high doses of Cbl are not nephrotoxic in mice.
EGF and its receptors were the first components of the EGF system to be discovered. Originally, EGF was isolated from the submaxillary glands [Cohen, 1960], and, subsequently, observed in the urine of both man and mice [Starkey et al., 1975; Lakshmanan et al., 1990]. For a number of years, the origin of urinary EGF was debated, but it was finally concluded that it derives from the kidney [Jørgensen et al., 1990]. Our data support this view. We found mRNA encoding EGF to be far more abundant in the kidney than the submaxillary gland. This is supported by another study revealing more modest differences in the expression of the EGF system [Gubits et al., 1986]. Except for EGFR, the kidney expressed the highest level of all receptors and ligands examined even in the adult mice suggesting an important physiological role. This is interesting in the light of the documented importance of the EGF system for nephrogenesis and renal maintenance. EGFR knockout mice reveal impaired renal epithelial development, and the EGF system is crucially involved in renal hemodynamics and electrolyte homeostasis [Melenhorst et al., 2008, Zeng et al., 2009].
The EGFR was initially identified in cell cultures [Haigler et al., 1978], but, subsequently, it was shown to be abundant in both placenta and liver [Sahyoun et al., 1978; Hock et al., 1979]. Our data show the highest amount of mRNA coding for EGFR is in the liver with relatively low levels ofHER2 and no HER4 or EGF mRNA. The presence of EGFR and its abundance in the liver is consistent with the previous reports [Carver et al., 2002; Mutti et al., 2011] and with its role as a critical regulator of hepatocyte proliferation mediating efficient G1—S transition during regeneration [Skov Olsen et al., 1988; Natarajan et al., 2007].
In conclusion, our study demonstrates tissue-dependent expression of the EGF system in mice. In addition, our results suggest that Cbl treatment modulates the kidney expression of the EGF system. This may have implications for the prevention of renal diseases.
Acknowledgement
We acknowledge Jette Fisker Pedersen for excellent technical assistance and Associate Professor Boe S. Sorensen for fruitful discussions about real-time PCR, both at the Department of Clinical Biochemistry, Aarhus University Hospital, Denmark.
References
1 Bird, A. (2002) “DNA methylation patterns and epigenetic memory,” Genes Dev 16 (1) 6—21.
Publisher – Google Scholar
2 Carver, R.S., Stevenson, M.C., Scheving, L.A. and Russell, W.E. (2002) “Diverse expression of ErbB receptor proteins during rat liver development and regeneration,” Gastroenterology 123 (6) 2017-2027.
Publisher
3 Chen, J., Chen, J.K., Nagai, K., Plieth, D., Tan, M., Lee, T.C., Threadgill, D.W., Neilson, E.G. and Harris, R.C. (2012) “EGFR signaling promotes TGFβ-dependent renal fibrosis,” J Am Soc Nephrol 23 (2) 215—224.
Publisher – Google Scholar
4 Cohen, S. (1960) “Purification of a nerve-growth promoting protein from the mouse salivary gland and its neuro-cytotoxic antiserum,” Proc Natl Acad Sci U S A 46 (3) 302-311.
Publisher – Google Scholar
5 Gubits, R.M., Shaw, P.A., Gresik, E.W., Onetti-Muda, A. and Barka, T. (1986) “Epidermal growth factor gene expression is regulated differently in mouse kidney and submandibular gland,” Endocrinology 119 (3) 1382-1387.
Publisher
6 Haigler, H., Ash, J.F., Singer, S.J. and Cohen, S. (1978) “Visualization by fluorescence of the binding and internalization of epidermal growth factor in human carcinoma cells A-431,” Proc Natl Acad Sci U S A 75: 3317-3321.
Publisher – Google Scholar
7 Hirschberg, R. and Ding, H. (1998) “Growth factors and acute renal failure,” Semin Nephrol 18 (2) 191-207.
8 Hock, R.A., Nexø, E. and Hollenberg, M.D. (1979) “Isolation of the human placenta receptor for epidermal growth factor-urogastrone,” Nature 277 (5695) 403-405.
Publisher
9 House, A.A., Eliasziw, M., Cattran, D.C., Churchill, D.N., Oliver, M.J., Fine, A., Dresser, G.K. and Spence, J.D. (2010)“Effect of B-vitamin therapy on progression of diabetic nephropathy: a randomized controlled trial,” JAMA 303 (16) 1603-1609.
Publisher – Google Scholar
10 Humes, H.D., Cieslinski, D.A., Coimbra, T.M., Messana, J.M. and Galvao, C. (1989) “Epidermal growth factor enhances renal tubule cell regeneration and repair and accelerates the recovery of renal function in post ischemic acute renal failure,” J Clin Invest 84 (6) 1757-1761.
Publisher – Google Scholar
11 Hygum, K., Lildballe, D.L., Greibe, E.H., Morkbak, A.L., Poulsen, S.S., Sorensen, B.S., Petersen, T.E. and Nexo, E. (2011) “Mouse transcobalamin has features resembling both human transcobalamin and haptocorrin,” PLoS One 6 (5) e20638.
Publisher – Google Scholar
12 Jørgensen, P.E., Rasmussen, T.N., Skov Olsen, P., Raaberg, L., SeierPoulsen, S. and Nexø, E. (1990) “Renal uptake and excretion of epidermal growth factor from plasma in the rat,” Regul Pept 28 (3) 273-281.
Publisher
13 Lakshmanan. J., Salido, E.C., Lam, R., Barajas, L. and Fisher, D.A. (1990) “Identification of pro-epidermal growth factor and high molecular weight epidermal growth factors in adult mouse urine,” Biochem Biophys Res Commun 173 (3) 902-911.
Publisher
14 Lildballe, D.L., Mutti, E., Birn, H. and Nexo, E. (2012) “Maximal load of the vitamin B12 transport system: a study on mice treated for four weeks with high-dose vitamin B12 or cobinamide,”PLos One 7 (10) e46657.
Publisher – Google Scholar
15 Liu, N., Guo, J.K., Pang, M., Tolbert, E., Ponnusamy, M., Gong, R., Bayliss, G., Dworkin, L.D., Yan, H. and Zhuang, S. (2012) “Genetic or pharmacologic blockade of EGFR Inhibits renal fibrosis,” J Am SocNephrol 23 (5) 854—867.
Publisher – Google Scholar
16 Melenhorst, W.B., Mulder, G.M., Xi, Q., Hoenderop, J.G., Kimura, K., Eguchi, S. and van Goor, H. (2008) “Epidermal growth factor receptor signaling in the kidney: key roles in physiology and disease,” Hypertension 52 (6) 987-993.
Publisher – Google Scholar
17 Mutti, E., Lildballe, D.L., Kristensen, L., Birn, H. and Nexo, E. (2013) “Vitamin B12 dependent changes in mouse spinal cord expression of vitamin B12 related proteins and the epidermal growth factor system,” Brain Res 1503 1-6.
Publisher
18 Mutti, E., Magnaghi, V., Veber, D., Faroni, A., Pece, S., Di Fiore, P.P. and Scalabrino, G. (2011) “Cobalamin deficiency-induced changes of epidermal growth factor (EGF)-receptor expression and EGF levels in rat spinal cord,” Brain Res1376 23-30.
Publisher
19 Mutti, E., Ruetz, M., Birn, H., Kräutler, B. and Nexo, E. (2013a) “4-Ethylphenyl-cobalamin impairs tissue uptake of vitamin B12 and causes vitamin B12 deficiency in mice,” PLos One 8 (9) e75312.
Publisher – Google Scholar
20 Natarajan, A., Wagner, B. and Sibilia, M. (2007) “The EGF receptor is required for efficient liver regeneration,” Proc Natl Acad Sci U S A 104 (43) 17081-17086.
Publisher
21 Sahyoun, N., Hock, R.A. andHollenberg, M.D. (1978) “Insulin and epidermal growth factor-urogastrone: affinity cross linking to specific binding sites in rat liver membranes,” Proc Natl Acad Sci U S A 75 (7) 1675-1679.
Publisher
22 Sakai, M., Zhang, M., Homma, T., Garrick, B., Abraham, J.A., McKanna, J.A. and Harris, R.C. (1997) “Production of heparin binding epidermal growth factor-like growth factor in the early phase of regeneration after acute renal injury. Isolation and localization of bioactive molecules,” J Clin Invest 99 (9) 2128-2138.
Published
23 Scalabrino, G., Nicolini, G., Buccellato, F.R., Peracchi, M., Tredici, G., Manfridi, A. and Pravettoni, G. (1999) “Epidermal growth factor as a local mediator of the neurotrophic action of vitamin B12 (cobalamin) in the rat central nervous system,” FASEB J 13 (14) 2083-2090.
24 Scalabrino, G., Veber, D. and Mutti, E. (2008) “Experimental and clinical evidence of the role of cytokines and growth factors in the pathogenesis of acquired cobalamin-deficient leukoneuropathy,” Brain Res Rev 59 (1) 42-54.
Publisher
25 Skov Olsen, P., Boesby, S., Kirkegaard, P., Therkelsen, K., Almdal, T., Poulsen, S.S. and Nexø, E. (1988) “Influence of epidermal growth factor on liver regeneration after partial hepatectomy in rats,” Hepatology 8 (5) 992-996.
Publisher
26 Spence, J.D. (2013) “B vitamin therapy for homocysteine: renal function and vitamin B12 determine cardiovascular outcomes,” Clin Chem Lab Med 51 (3) 633-637.
Publisher
27 Starkey, R.H., Cohen, S. and Orth, D.N. (1975) “Epidermal growth factor: identification of a new hormone in human urine,” Science189 (4205) 800-802.
Publisher
28 Tang, J., Liu, N. and Zhuang, S. (2013) “Role of epidermal growth factor receptor in acute and chronic kidney injury,” Kidney Int 83 (5) 804-810.
Publisher
29 Terzi, F., Burtin, M., Hekmati, M., Federici, P., Grimber, G., Briand, P. and Friedlander, G. (2000) “Targeted expression of a dominant-negative EGF-R in the kidney reduces tubulo-interstitial lesions after renal injury,” J Clin Invest 106 (2) 225-234.
Publisher – Google Scholar
30 Thompson, K.L. and Rosner, M.R. (1989) “Regulation of epidermal growth factor receptor gene expression by retinoic acid and epidermal growth factor,” J Biol Chem 264 (6) 3230-3234.
31 Yuan, J.S., Reed, A., Chen, F. and Stewart, C.N. Jr. (2006) “Statistical analysis of real-time PCR data,” BMC Bioinformatics 7 85.
Publisher – Google Scholar
32 Zeng, F., Singh, A.B. and Harris, R.C. (2009) “The role of the EGF family of ligands and receptors in renal development, physiology and pathophysiology,” Exp Cell Res 315 (4) 602-610.
Publisher