Department of Mechanical & Mechatronic Engineering, Stellenbosch University, Stellenbosch, South Africa
Volume (2017),
Article ID 884279,
Research in Agriculture and Agronomy,
14 pages,
DOI: 10.5171/2016.884279
Received date: 25 July 2014; Accepted date: 30 October 2014; Published date: 4 January 2017
Academic Editor: Okan Özkaya
Cite this Article as:
Corné Coetzee and Robert Dobson (2017), “A Simple Numerical Model for the Prediction of Apple Temperatures under Evaporative Cooling”, Research in Agriculture and Agronomy, Vol. 2017 (2017), Article ID 884279, DOI: 10.5171/2017.884279
Sunburn in fruit is caused by excess heat and radiation and has a major economic impact on apple production. Evaporative cooling can be used to keep the apple temperatures below a critical value, but the process needs to be optimised for maximum cooling effect and to avoid excessive use of water. A numerical model was developed to predict the skin and core temperatures of an apple subjected to evaporative cooling. The method makes use of climatic data recorded by a weather station. The model predicted apple skin and core temperatures accurately with a maximum error of 6.4%. The drop in skin temperature when evaporative cooling was applied could be accurately predicted with an error of 5.3%. The results indicate that the model can be used, in combination with a control system and input from a weather station, to control and manage an evaporative cooling system.
Keywords: apple cooling, evaporative cooling, numerical modelling
Introduction
Sunburn in fruit is caused by excess heat and radiation if the surface temperature is allowed to get too hot for an extended period of time (Gindaba & Wand, 2007). This might result in damage to the fruit tissue and a burnt or discoloured area. In the Western Cape region of South Africa, producers generally estimate losses at 10%-20% but sometimes as high as 30%-50% (Wand et al., 2006). According to Schrader et al. (2001, 2003), the discolouration of the skin occurs when the fruit skin temperature reaches 46-49°C in direct sunlight and if the skin temperature exceeds 52°C, necrosis might occur.
For many apple cultivars, especially bicoloured varieties, red colour and fruit size are important. Even with adequate size, poor fruit colour is an important factor and generally associated with poor visual consumer acceptance (Iglesias et al., 2005). In general, colour pigment development occurs in the temperature ranges from 5°C to 30°C, with the optimum around 21°C. The amount of colouring is directly proportional to the amount of time that the fruit is within this temperature range (Evans, 1993).
Many fruit growers are utilising overcrop sprinkling systems for evaporative cooling as a feasible and chemical-free technique to reduce sun burn of exposed fruit and/or to enhance colour development on red and bicoloured apples (Evans, 1993). When water is applied to a crop, three methods of cooling can be recognised (Van der Gulik, 1995):
Convective cooling occurs when the water evaporates in the air which causes cooling of the air and hence cooling of the crop. A fogging system is a good example, but due to continuous or very frequent running, it may result in the outbreak of diseases.
In hydro-cooling, cold water is applied directly to the tree where heat is removed from the leaves and the fruit by direct heat transfer. Overhead irrigation systems are an example of hydro cooling if the application rates are high enough, but it requires a lot of water and can result in water wastage.
During evaporative cooling heat is extracted from the leaves and the fruit when the applied water evaporates. It is the most effective method of cooling when the water is applied overhead. However, due to the lack of adequate water reaching the soil surface, a duplicate water application system (undertree) is needed for irrigation.
All water-based orchard cooling techniques use one or more of the above mechanisms. The climatic conditions, methods of application, duration and rate at which water is applied will determine the relative contribution of each mechanism.
In some areas evaporative cooling may be used for 35-75 days per season (Evans, 1993). This means that evaporative cooling impacts several major areas of management including pest and disease control, fruit maturity, fruit storage characteristics, irrigation water requirements and irrigation scheduling.
According to Evans (2004), water application should be pulsed on and off such that continuous evaporation can occur, hydro-cooling is minimised and the minimum amount of water is used. Automation is usually required to pulse (cycle) the water application. Some evaporative cooling systems are cycled based on the air temperature, the fruit temperature and/or time while others are operated on a continuous basis when the air temperature is above a specified value. According to Evans (1993), starting evaporative cooling based on the air temperature is a very poor approach. Evaporative cooling should be initiated and cycled based on fruit core temperature, fruit skin temperature or other methods such as “simulated” fruit that reflects actual fruit conditions (Evans, 1993).
Sensors such as thermocouples can be used to measure the fruit core and/or skin temperature. Thermocouples can be inserted in the fruit but should be regularly switched to another to avoid fruit decay and false readings (Van der Gulik, 1995). The sensors can be combined with manual or automatic control systems. A simple control system can use preset sequences of timed cycles, initiated by the fruit temperature. Existing control systems are not user friendly and there is a real need for a simple control system that would start and stop evaporative cooling cycles by monitoring or predicting the current fruit temperature and allowing the control set-points to be easily changed (Evans, 1993). There are very few data on the design, management, operation and control of overtree evaporative cooling systems for sunburn reduction and growers make use of trial-and-error to optimise their systems.
The best control system would be based on the direct measurement of the apple skin temperature (Evans, 2004). Such systems are not yet available and fruit growers are interested in control systems based on easily measured climatic variables. The problem is that skin temperature is not linearly related to air temperature or any other single environmental parameter. Skin temperature is related to several variables and one approach would be the development of a simple physical model to predict skin temperature of fruit exposed to direct sun and evaporative cooling. The results from such a model can then be used to propose management criteria for effective and efficient evaporative cooling (Evans, 2004).
Evans (2004) developed a simple, climatological process-based energy balance model to predict fruit skin temperature. He based his model on the assumption of steady state conditions where the apple core temperature is relatively constant during cooling. The fruit is assumed to be spherical in shape and one control volume is used where the fruit surface is the outer boundary. This one-dimensional approach means that the temperature everywhere on the fruit skin is the same, and not influenced by the direction of the sun relative to the fruit.
In this paper, a three-dimensional climatological model is developed assuming transient conditions. Like Evans (2004), the apple is assumed to be spherical, but a number of control volumes are used to model the fruit.
Numerical Method
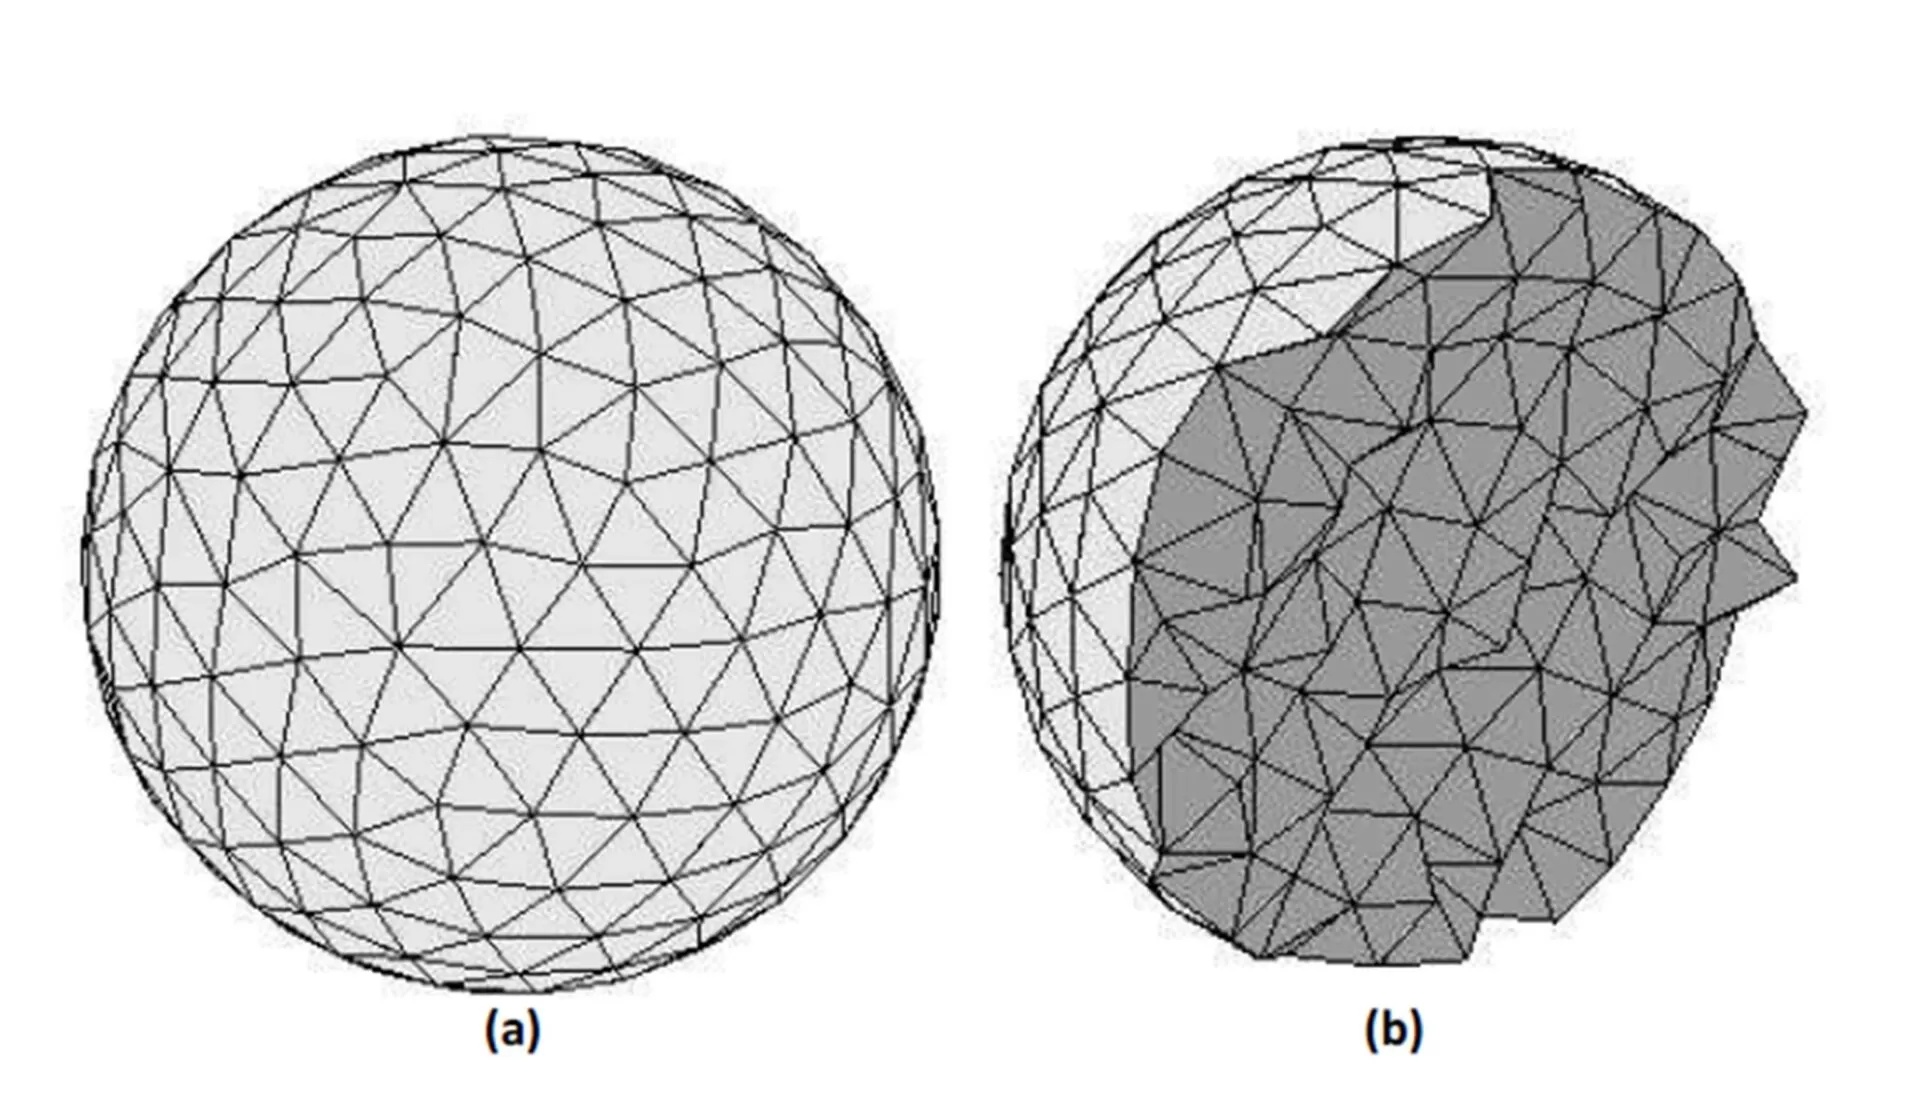
The apple was assumed to be spherical and divided into a number of equally sized tetrahedrons (control volumes), all with equal side length (Person, 2005). An example of the control volumes is shown in Figure 1.
Figure 1: Control volume mesh: a) complete apple and b) sectional view
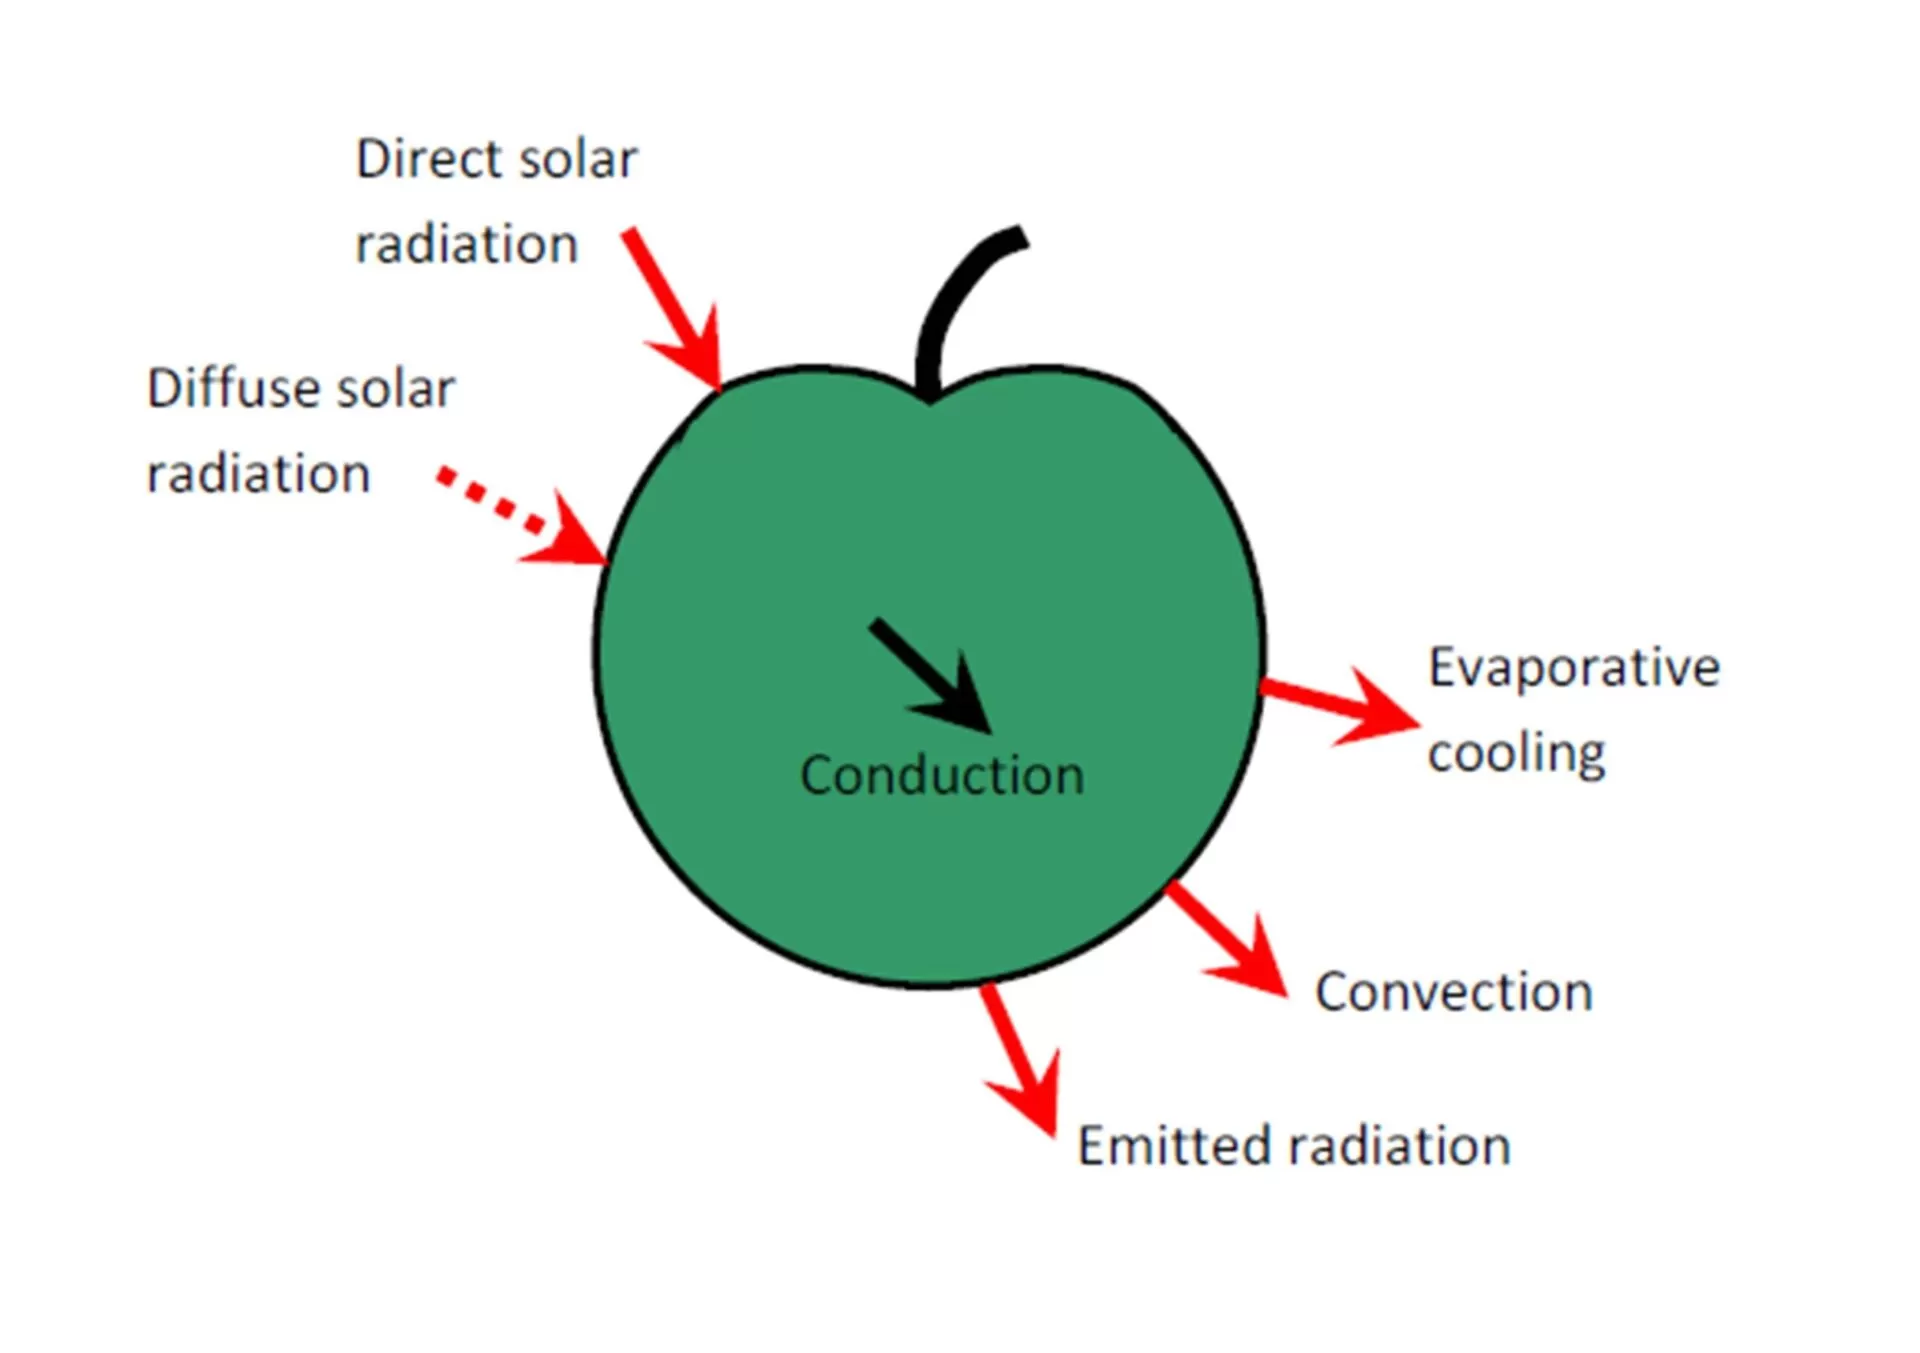
A data structure was developed, listing for each control volume its neighbouring control volumes and the outside surface area if any. The heat energy balance used in the numerical model is illustrated in Figure 2.
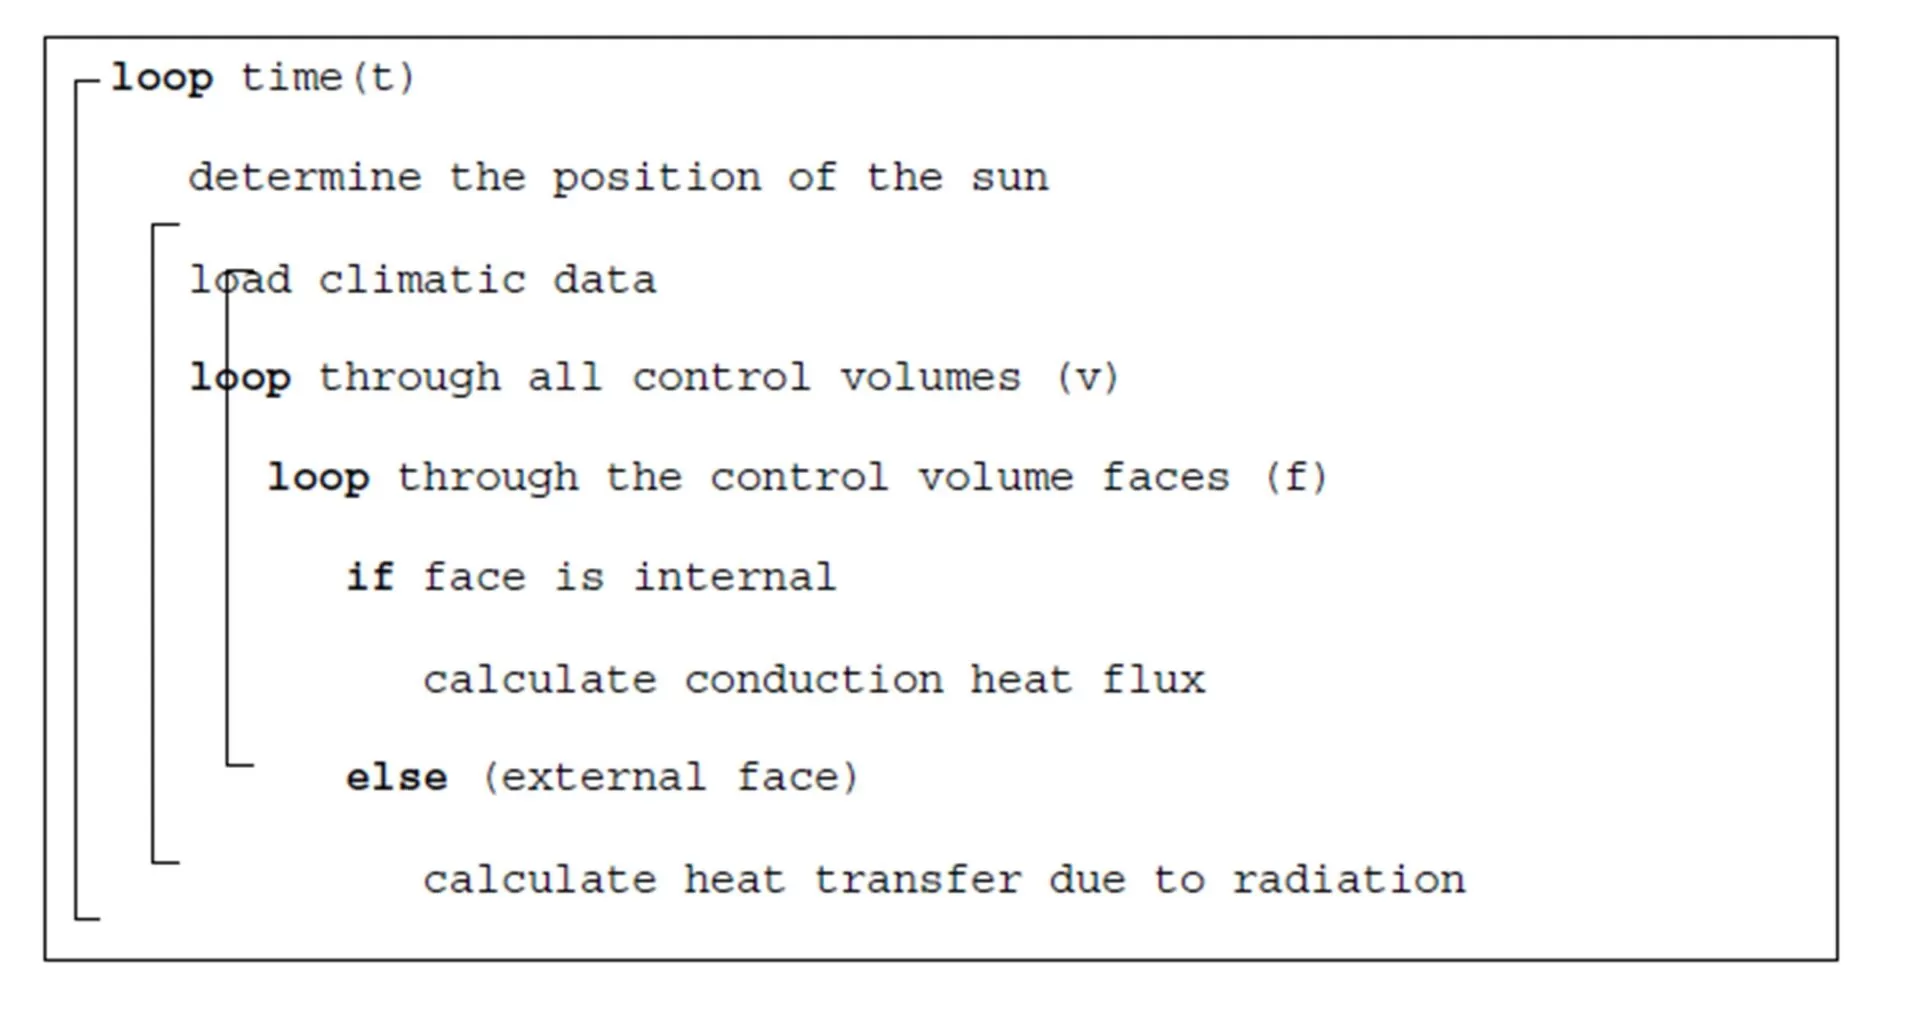
The heat transfer due to fluid flow from the tree to the apple or from the fruit to the tree is assumed negligible (Evans, 2004). Direct and diffuse solar radiation, convection, emitted radiation and evaporative cooling were considered. Figure 3 shows the main structure of the explicit numerical procedure.
Figure 2: Apple energy balance
Figure 3: Structure of the explicit numerical procedure
The location of the orchard is specified in terms of the longitude, latitude and altitude. The first step in the calculation procedure is to use this information in combination with the given day and time, to determine the position of the sun relative to the apple in terms of the azimuth and zenith angle (Reda & Andreas, 2003). From the azimuth and zenith angles, a unit vector pointing from the centre of the apple towards the sun is constructed. This unit vector is later used to determine the amount of direct radiation on the outside surface of the apple.
The second step is to load the climatic data for the current time step. If the numerical model is implemented in a control system, the climatic data will be read from a weather station placed inside the orchard. The data will then be used in real time to predict the apple temperature and apply evaporative cooling if needed. In this study, however, climatic data was previously recorded and used as input. The data used included: the direct solar radiation, the diffuse solar radiation, the ambient temperature, the wind speed, the relative humidity, the atmospheric pressure and the dew point temperature.
The third step is to loop through all the control volumes, starting from the control volumes with external faces and working towards the centre of the apple. Each control volume has four faces which can be either an external surface or an internal surface.
Conduction
If the face is an internal surface, the conduction heat transfer, [W], between the control volume under consideration and the neighbouring control volume is calculated (Çengel, 2003)
where kapple [W/m/ºC] is the conductivity of the apple, A [m2] is the surface area between the volume under consideration and the neighbouring volume, dS [m] is the distance between the two control volume centres and Tv and Tn [ºC] are the current temperatures of the control volume under consideration and the neighbouring control volume respectively.
Solar Radiation
If the face is an external surface, solar radiation, emitted radiation, convection and evaporative cooling should be considered. The heat transfer due to direct and diffuse solar radiation is given by (Çengel, 2003)
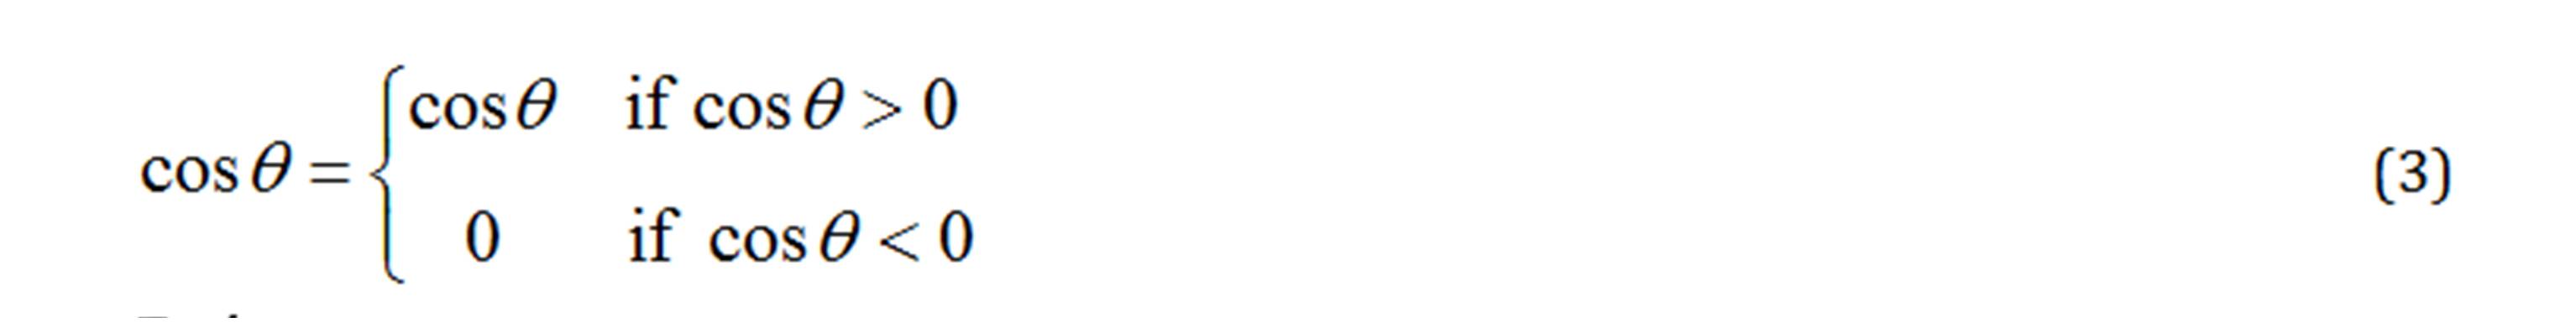
where a is the absorptivity of the apple, A [m2] the external surface area, Gdirect [W/m2] the direct solar radiation, Gdiffuse [W/m2] the diffuse solar radiation and q is the angle between a vector normal to the surface (pointing away from the apple) and the vector pointing in the direction of the sun. The following condition is applied so that surfaces facing away from the sun receive no direct solar radiation
Emitance
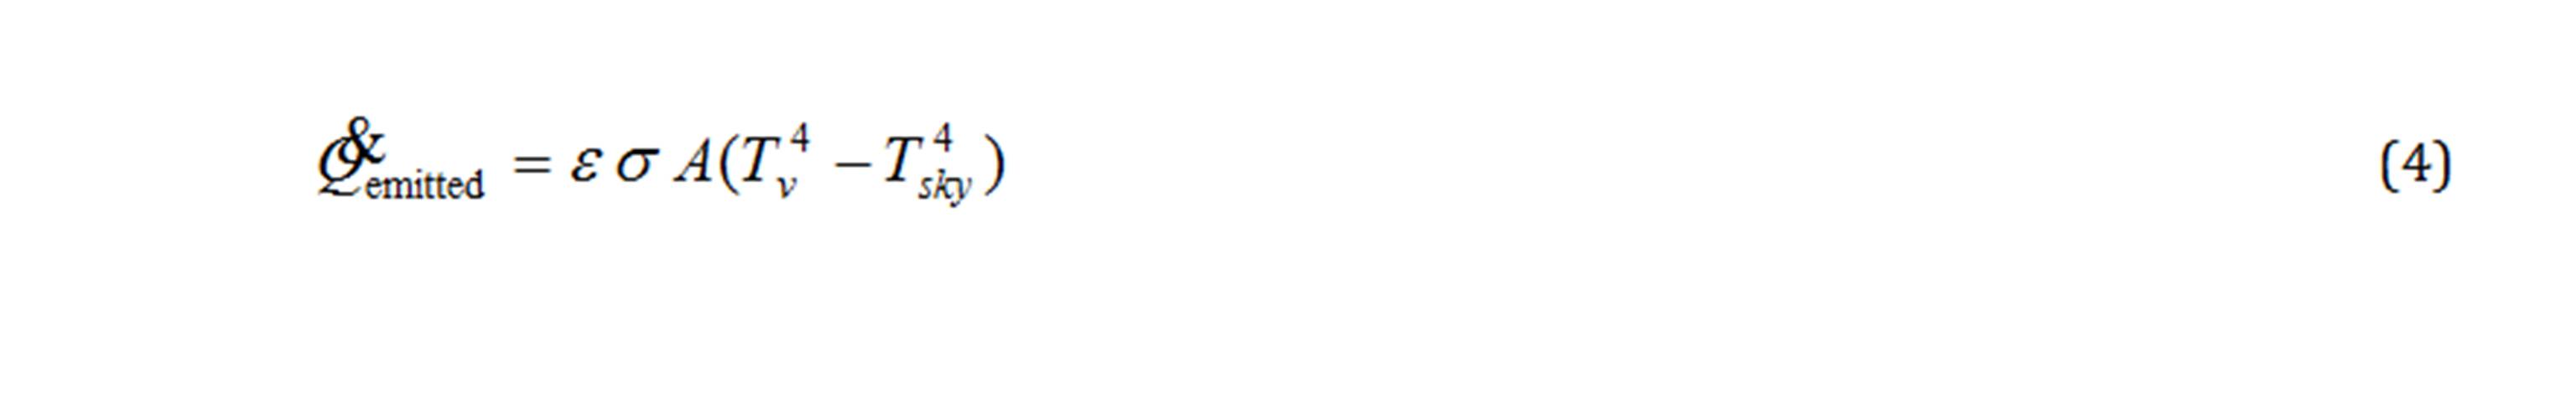
The heat energy, [W], emitted by the apple is given by (Çengel, 2003)
where e is the emissivity of the apple surface, s = 5.67×10⁻⁸ W/m2/K4 the Stefan-Boltzmann constant, A [m2] the surface area, Tv [K] the current temperature of the control volume under consideration and Tsky [K] the sky temperature given by (Mills, 1992)
with esky the emissivity of the sky and Tambient [K] the ambient temperature. The emissivity of the sky is given by (Mills, 1992)
where TDP [ºC] is the dew point temperature.
Convection
Heat energy is also transferred from the external surface of the apple to the atmosphere through convection. The convective heat transfer, [W], is given by (Çengel, 2003)
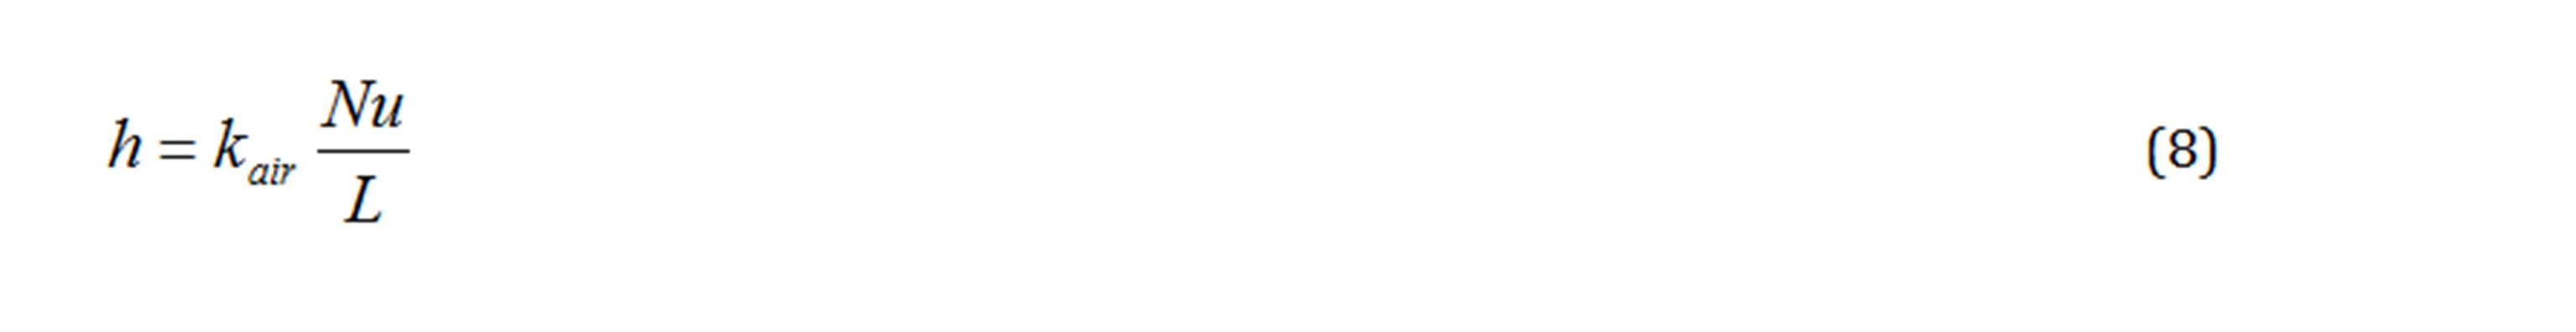
where h [W/m2/°C] is the convective heat transfer coefficient given by
with kair = 0.02588 W/m/°C the thermal conductivity of the air at 30°C, Nu the Nusselt number and L [m] the characteristic length, in this case the apple diameter. In order to calculate the Nusselt number, the Reynolds number Re, the Grashof number Gr and the Prandtl number Pr are needed. The Reynolds number is given by
where V [m/s] is the velocity of the air (wind speed), L [m] the characteristic length (apple diameter) and n = 1.608×10⁻⁵ m2/s the kinematic viscosity of the air at 30°C. The Grashof number is given by
with b = 1/Tave where Tave [K] is the expected average temperature between the apple’s skin and the ambient temperature, DT [K] is the expected difference between the apple’s skin and ambient temperature, g [m/s2] is the gravitational acceleration and L [m] the apple diameter. The Prandtl number is given by
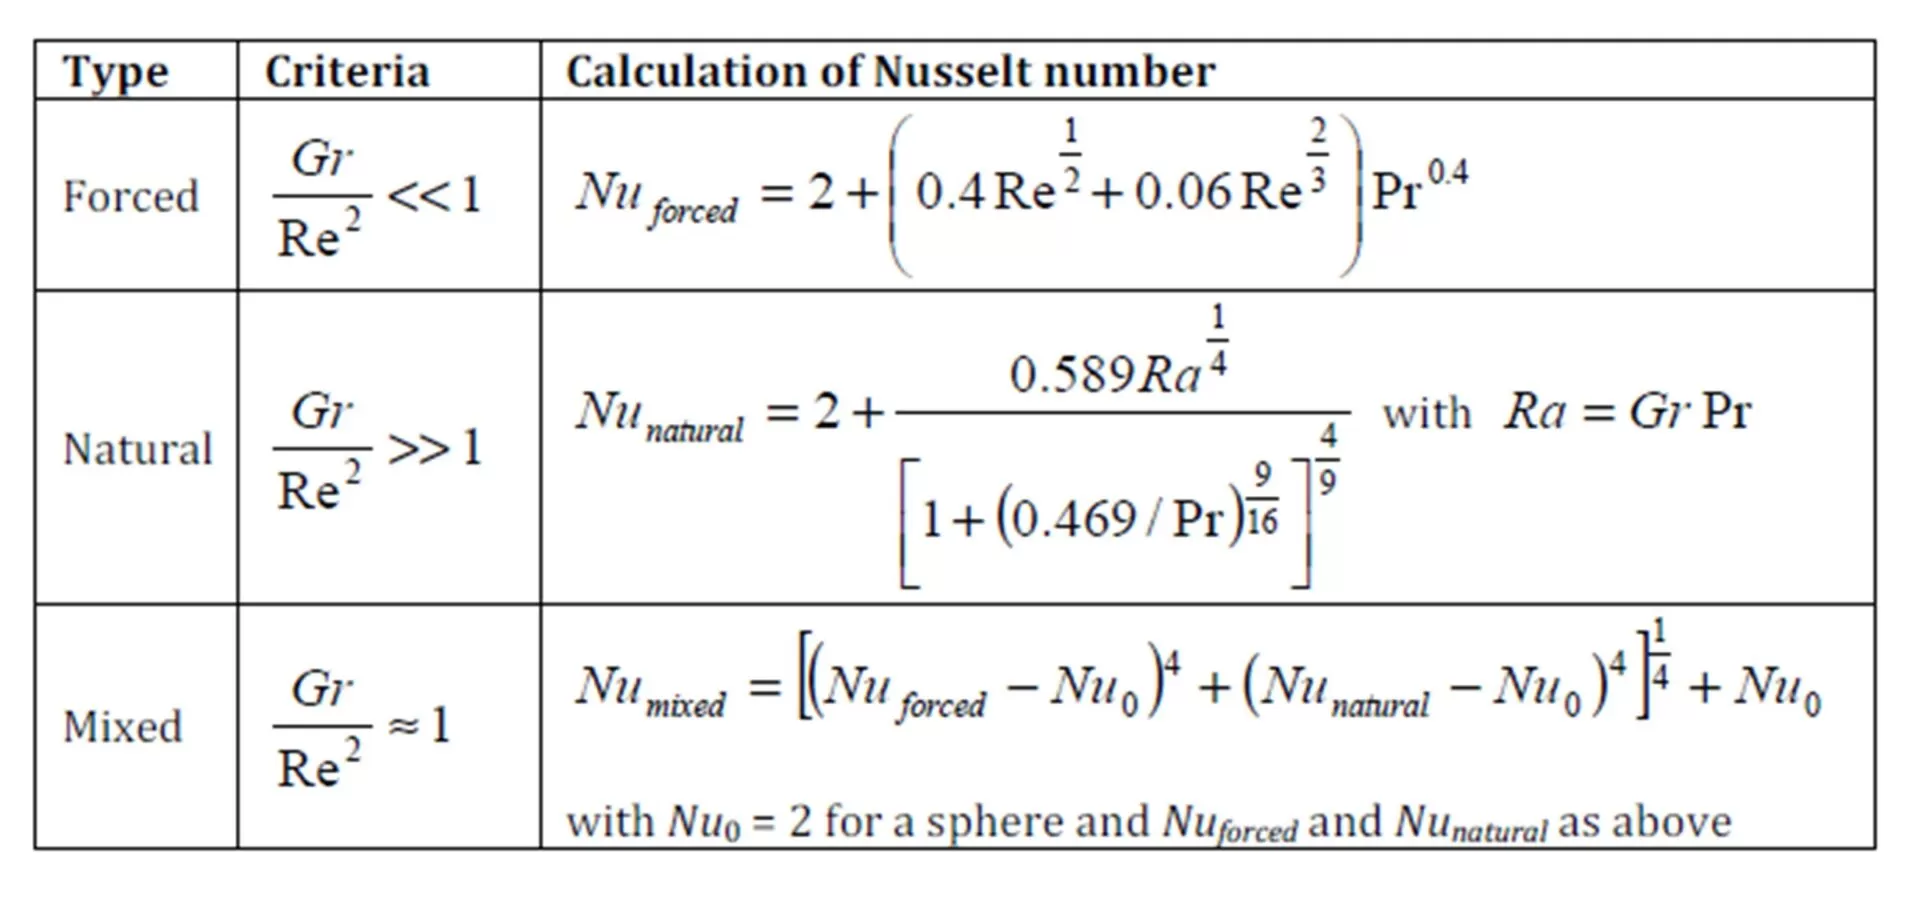
with r = 1.164 kg/m3 the air density at 30°C and Cp = 1007 J/kg/°C the specific heat of the air at 30°C. The Nusselt number is dependent on the type of convection (forced, natural or mixed) as shown in Table 1 for Pr << 1 (typical for air).
Table 1: Criteria for convection type and the Nusselt number (Mills, 1992)
Evaporative Cooling
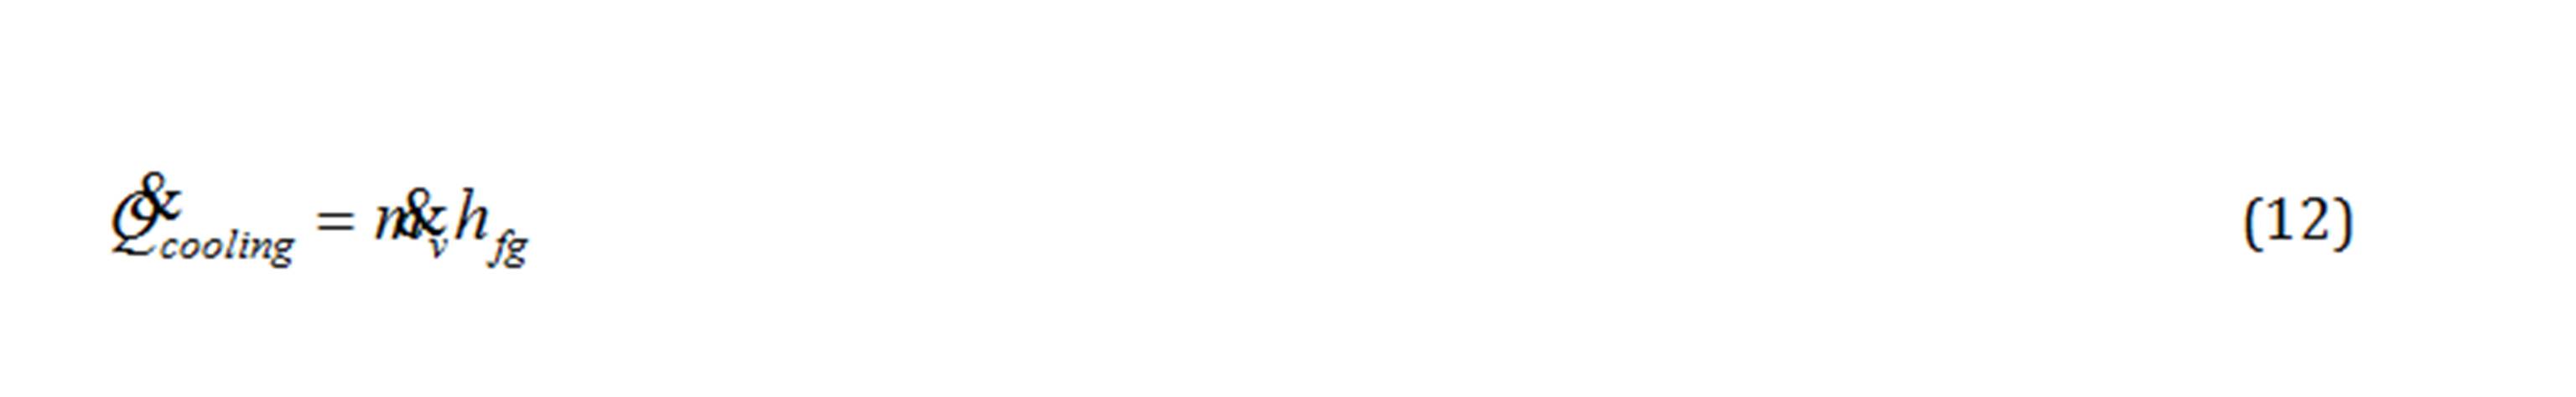
The external surfaces are also the only volumes directly influenced by evaporative cooling when it is activated. It is assumed that the complete apple is wetted and evaporation takes place on all the outside faces. The amount of heat energy, [W], extracted from the control volume is calculated by (Çengel, 2003)
where [kg/s] is the rate of water evaporation and hfg [J/kg] the latent heat of evaporation at the surface temperature. Various expressions for can be found in literature. Assuming the water vapour to be an ideal gas, the following expression for can be used (Çengel, 2003)
where hmass [m/s] is the mass transfer coefficient, A [m2] the surface area over which evaporation takes place, Tv [K] the surface temperature taken to be the control volume temperature and Tsky [K] is the sky temperature (Equation 5). The saturation pressure for water at the surface temperature (taken as 35 °C) is given by Pv,s = 5.628 kPa. The saturation pressure for water at the sky temperature (taken as 20°C) is given by Pv,sky = 3.17 kPa. The vapour pressure of the air far from the surface is then given by Pv,¥ = (RH× Pv,sky) where RH is the relative humidity. The density of the water vapour at a surface temperature of 35°C is given by rv = 0.0397 kg/m3. Assuming the vapour to be an ideal gas, the gas constant Rv [Pa×m3/kg/K] follows from
The mass transfer coefficient hmass is given by (Çengel, 2003)
where Sh is the Sherwood number and DAB [m2/s] the mass diffusivity and L [m] the apple diameter (characteristic length). The Sherwood number is taken to be
where Gr is the Grashof number and Sc = n/DAB the Schmidt number with n = 1.608×10⁻⁵ [m2/s] the kinematic viscosity of air taken at 30°C. The mass diffusivity for water vapour in air is given by (Çengel, 2003)
Where Tave [K] is the expected average temperature between the apple’s skin and the ambient temperature (taken as 25°C) and P [atm], the total atmospheric pressure
Temperature Update
Finally, with the heat transfer over each face of the element known, the temperature of the control volume is updated using
where Tvnew is the new temperature of the control volume, Tv the old temperature, rapple [kg/m3] is the density of the apple, Capple [J/kg/ºC] is the specific heat of the apple, Vv [m3] is the volume and dt is the time increment (typically 0.2 — 1.0 seconds).
When the temperature of all the control volumes is updated, the next time step is started. The new position of the sun is calculated, the climatic data is loaded from an input file and the cycle is repeated.
Experimental Setup and Procedures
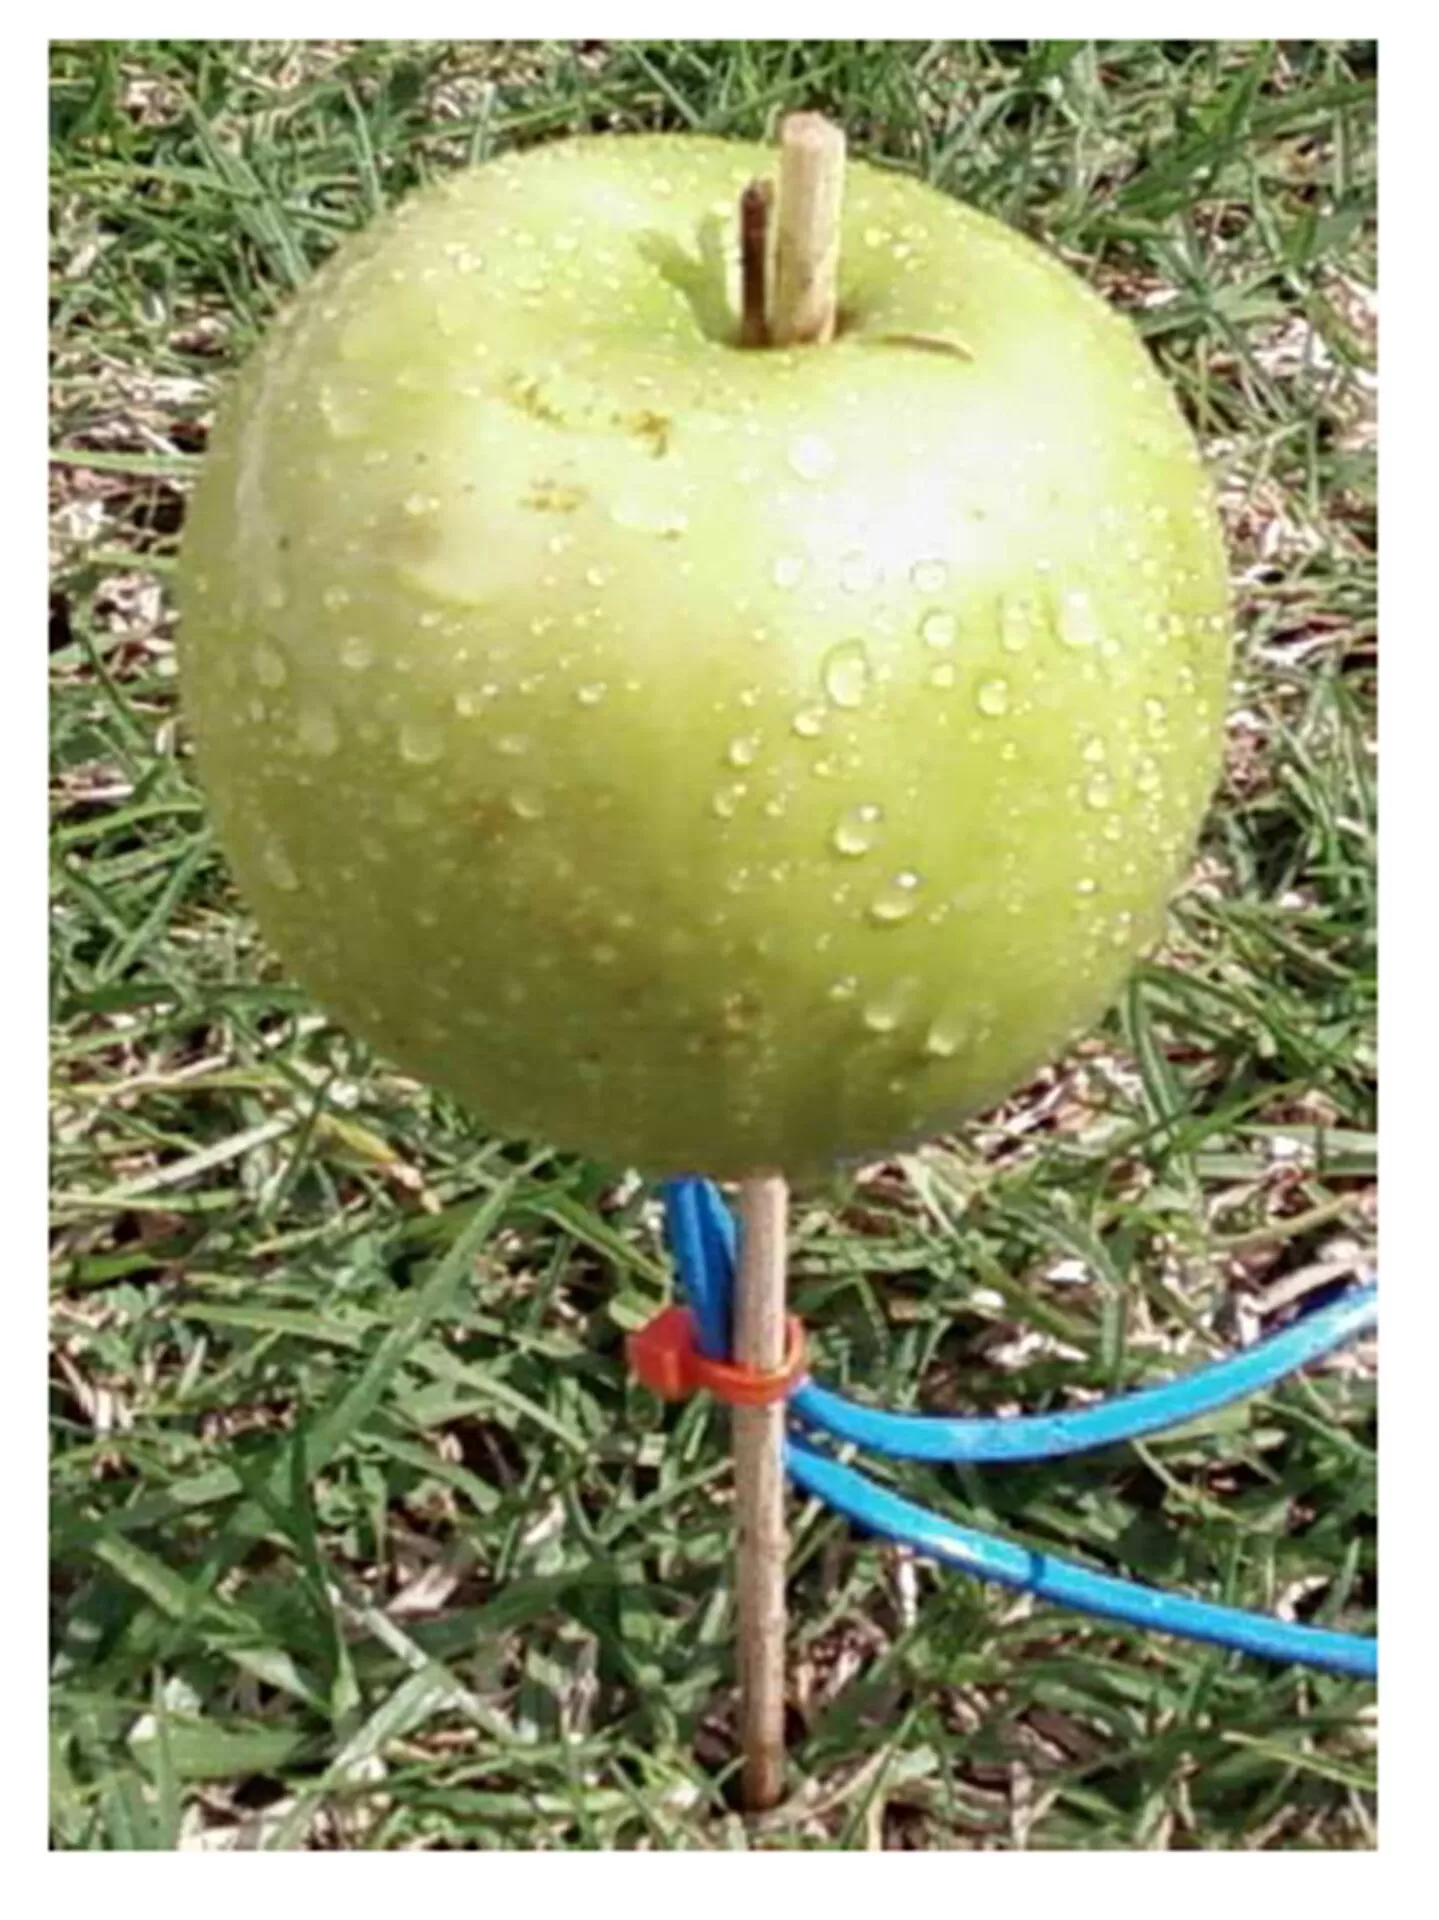
Golden Delicious apples were placed on the roof of a building in Stellenbosch (longitude 18.9º, latitude -33.9º, altitude 91 m). The apples were placed at the end of a thin stick, 150 mm above a grass surface (Figure 4). T-type thermocouples were inserted into the apples, one thermocouple all the way through the apple to just under the skin, and the other thermocouple in the centre (core) of each of the apples.
Figure 4: Experiment measuring apple temperatures
A Davis Weather Monitor II station was used to record the ambient temperature, the barometric pressure, the relative humidity, the wind speed and the dew-point temperature. A Kipp & Zonen solar radiation meter was used to record the solar radiation. The data from the thermocouples and the solar radiation meter were logged with a Schlumberger data logger (SI35951C).
To initiate evaporative cooling, a household spraying bottle was used to apply a fine mist of water to the apple. The amount of water applied was not measured, but the time it took the apple to dry completely was recoded and used as input to the model.
Results and Discussion
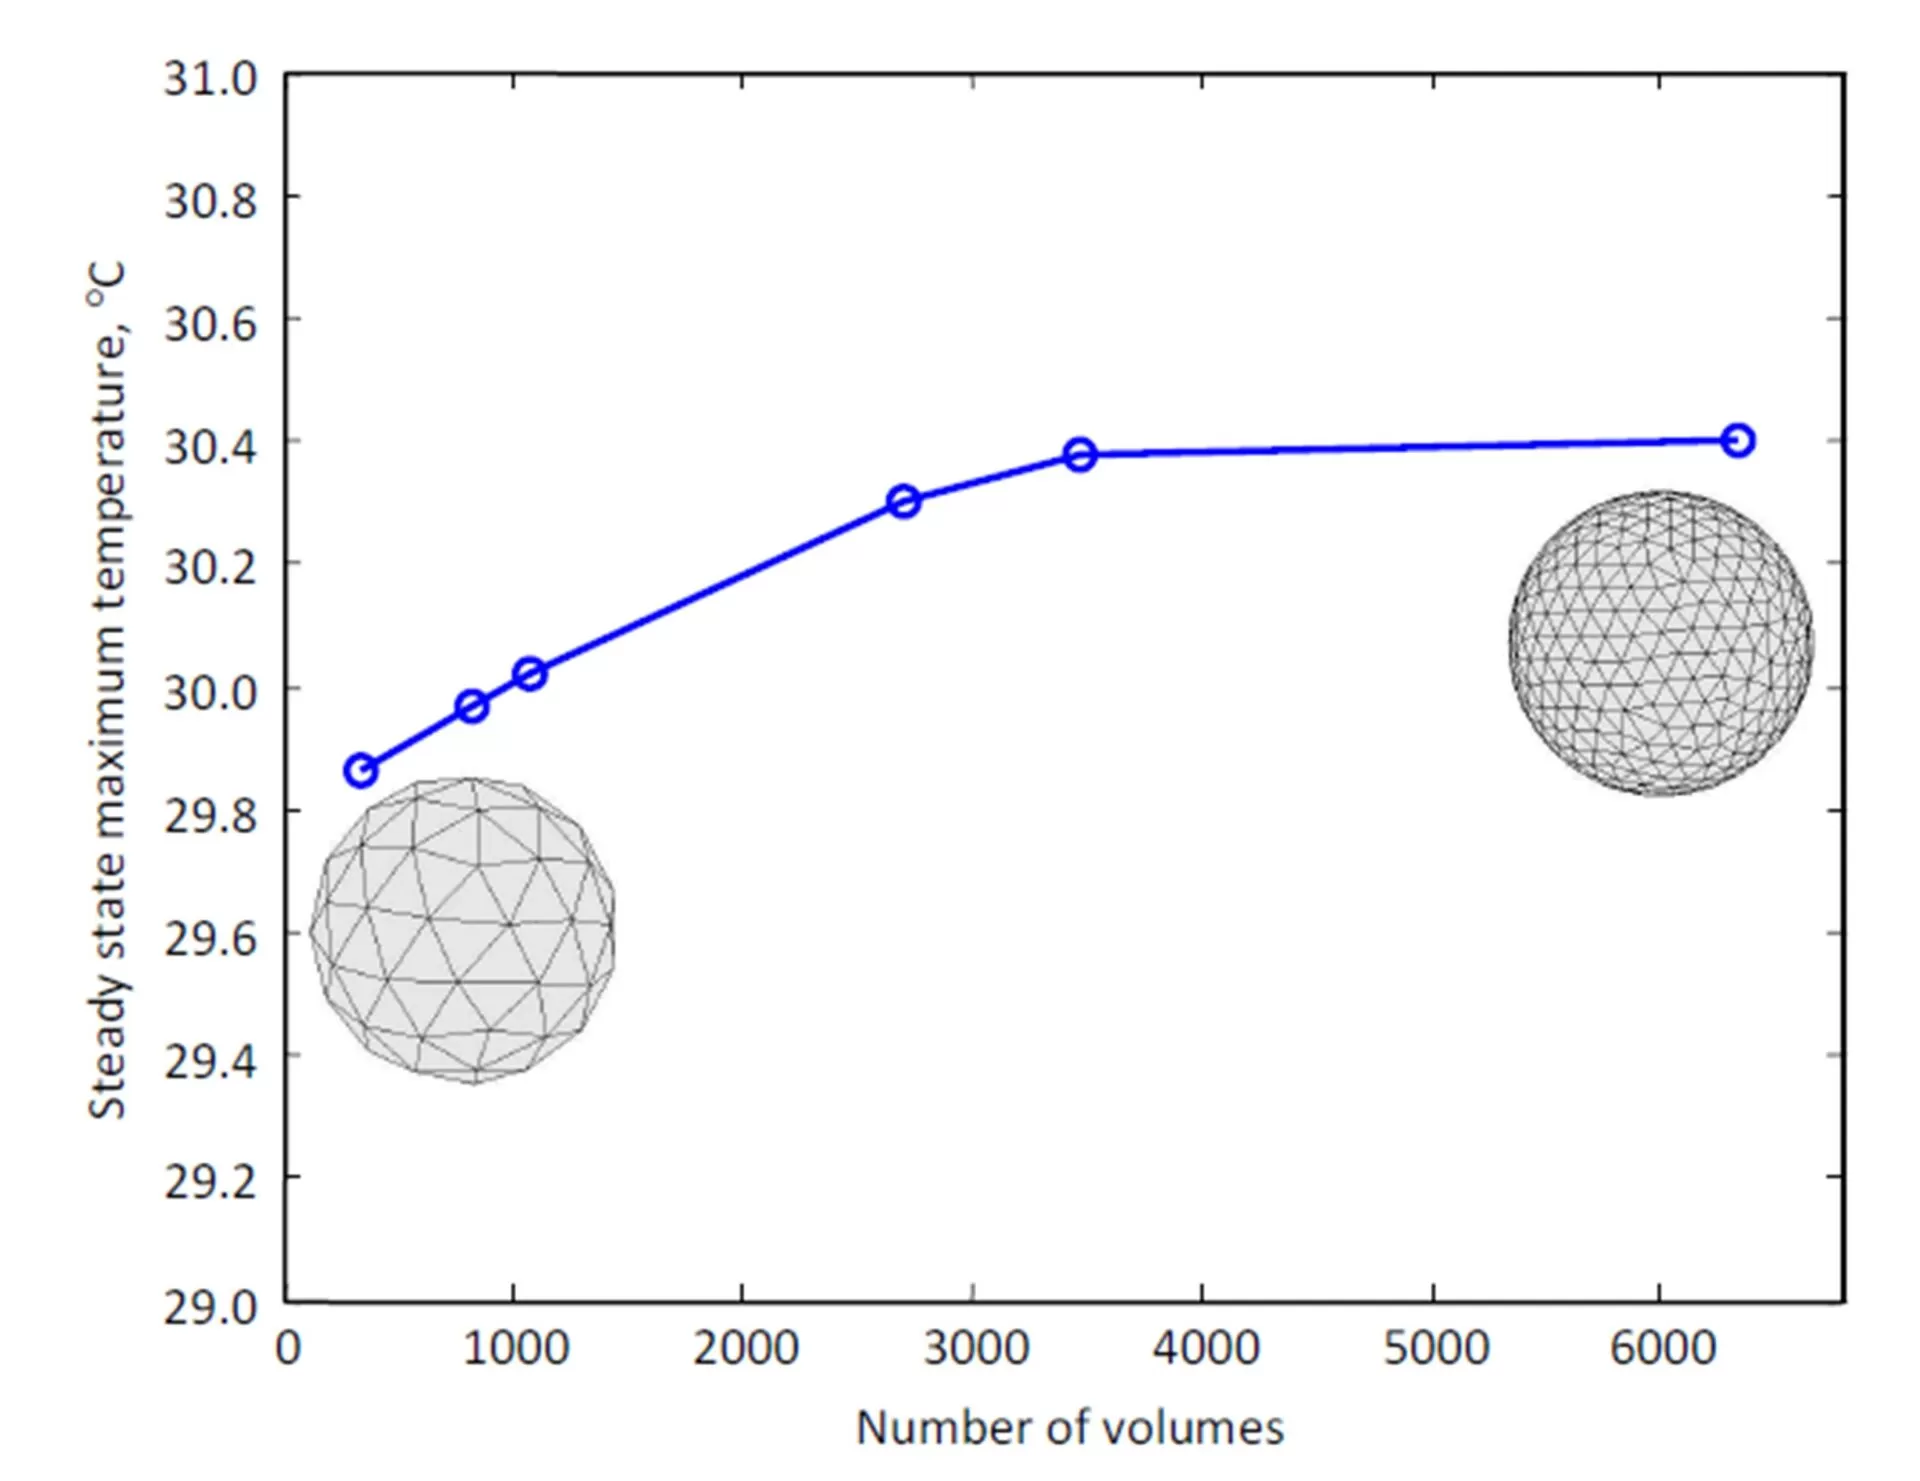
The results from any numerical model should converge if more and more control volumes are used. Convergence was tested using different numbers of volumes. The apple was given a uniform initial temperature of 10ºC and all the climatic conditions kept constant. The apple was then allowed to heat up until a steady state was reached.
Figure 5: Convergence in apple temperature with mesh refinement
Using different numbers of control volumes, the maximum steady state temperatures were recorded. Figure 5 plots the maximum apple temperature versus the number of control volumes. The results show that the model is not very sensitive to the number of volumes used. Using 336 to 6345 control volumes, the temperature converges with a change of only 0.6ºC.
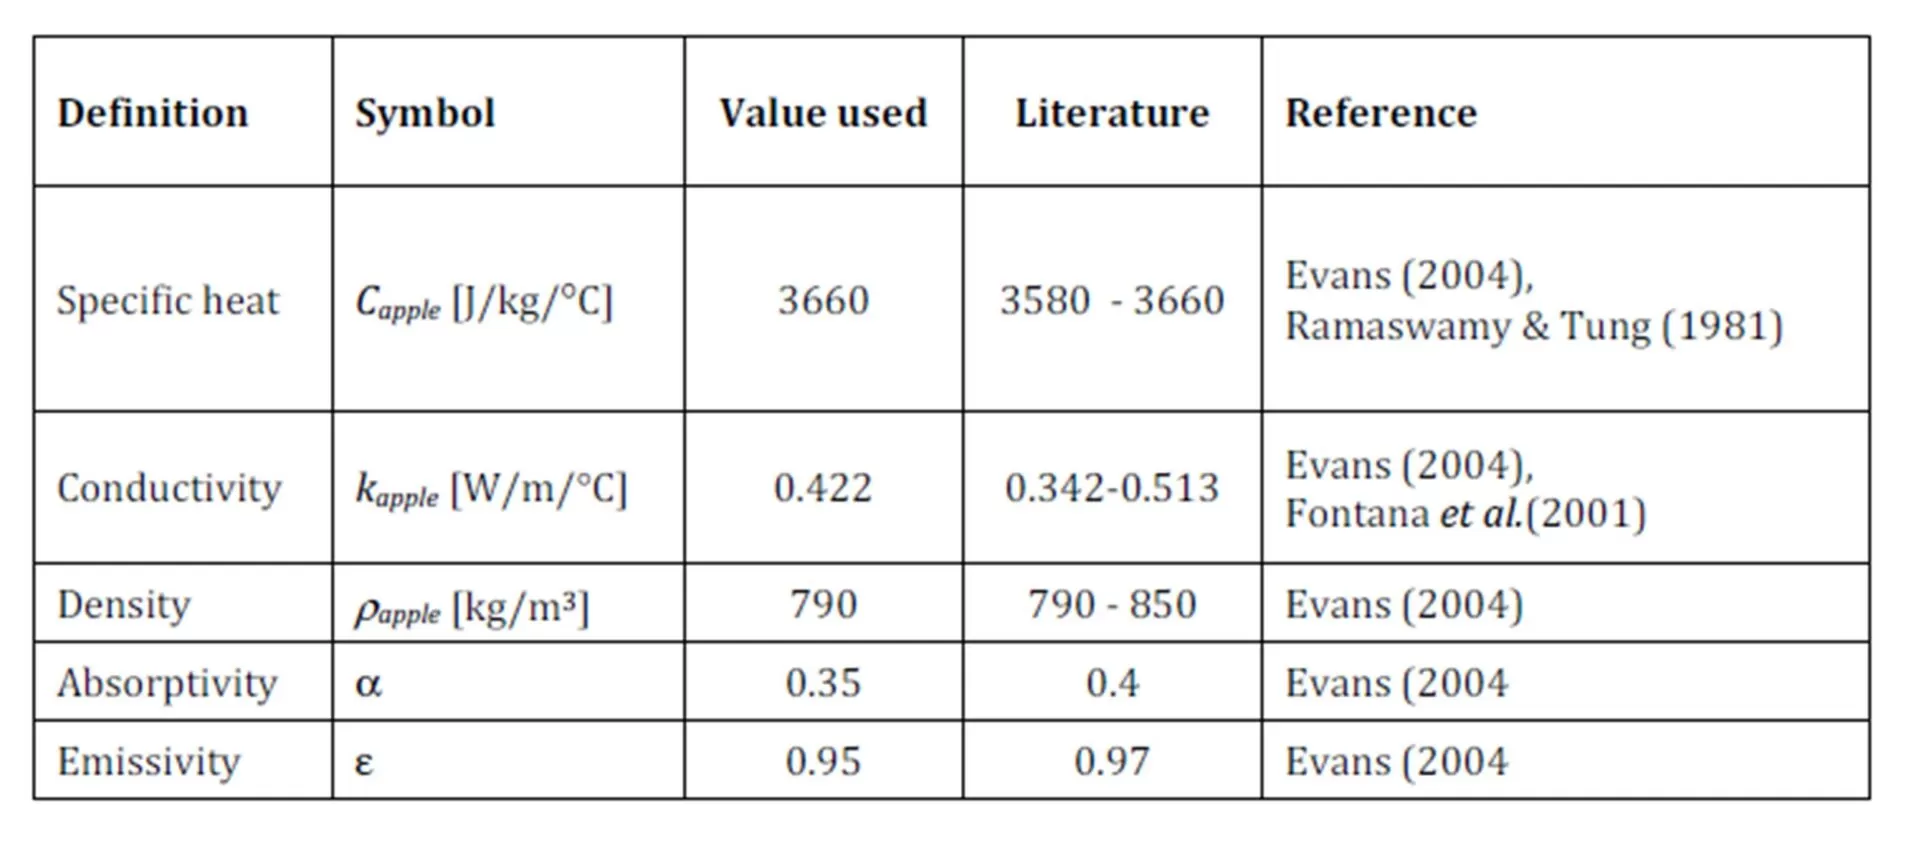
In all subsequent simulations, 2697 volumes were used with a time step of 0.5 seconds. The thermal properties of the apples were not determined, but taken from literature. The apple thermal properties used are summarised in Table 2, together with typical values found in the literature
Table 2: Thermal properties of apples used in simulations and values from literature
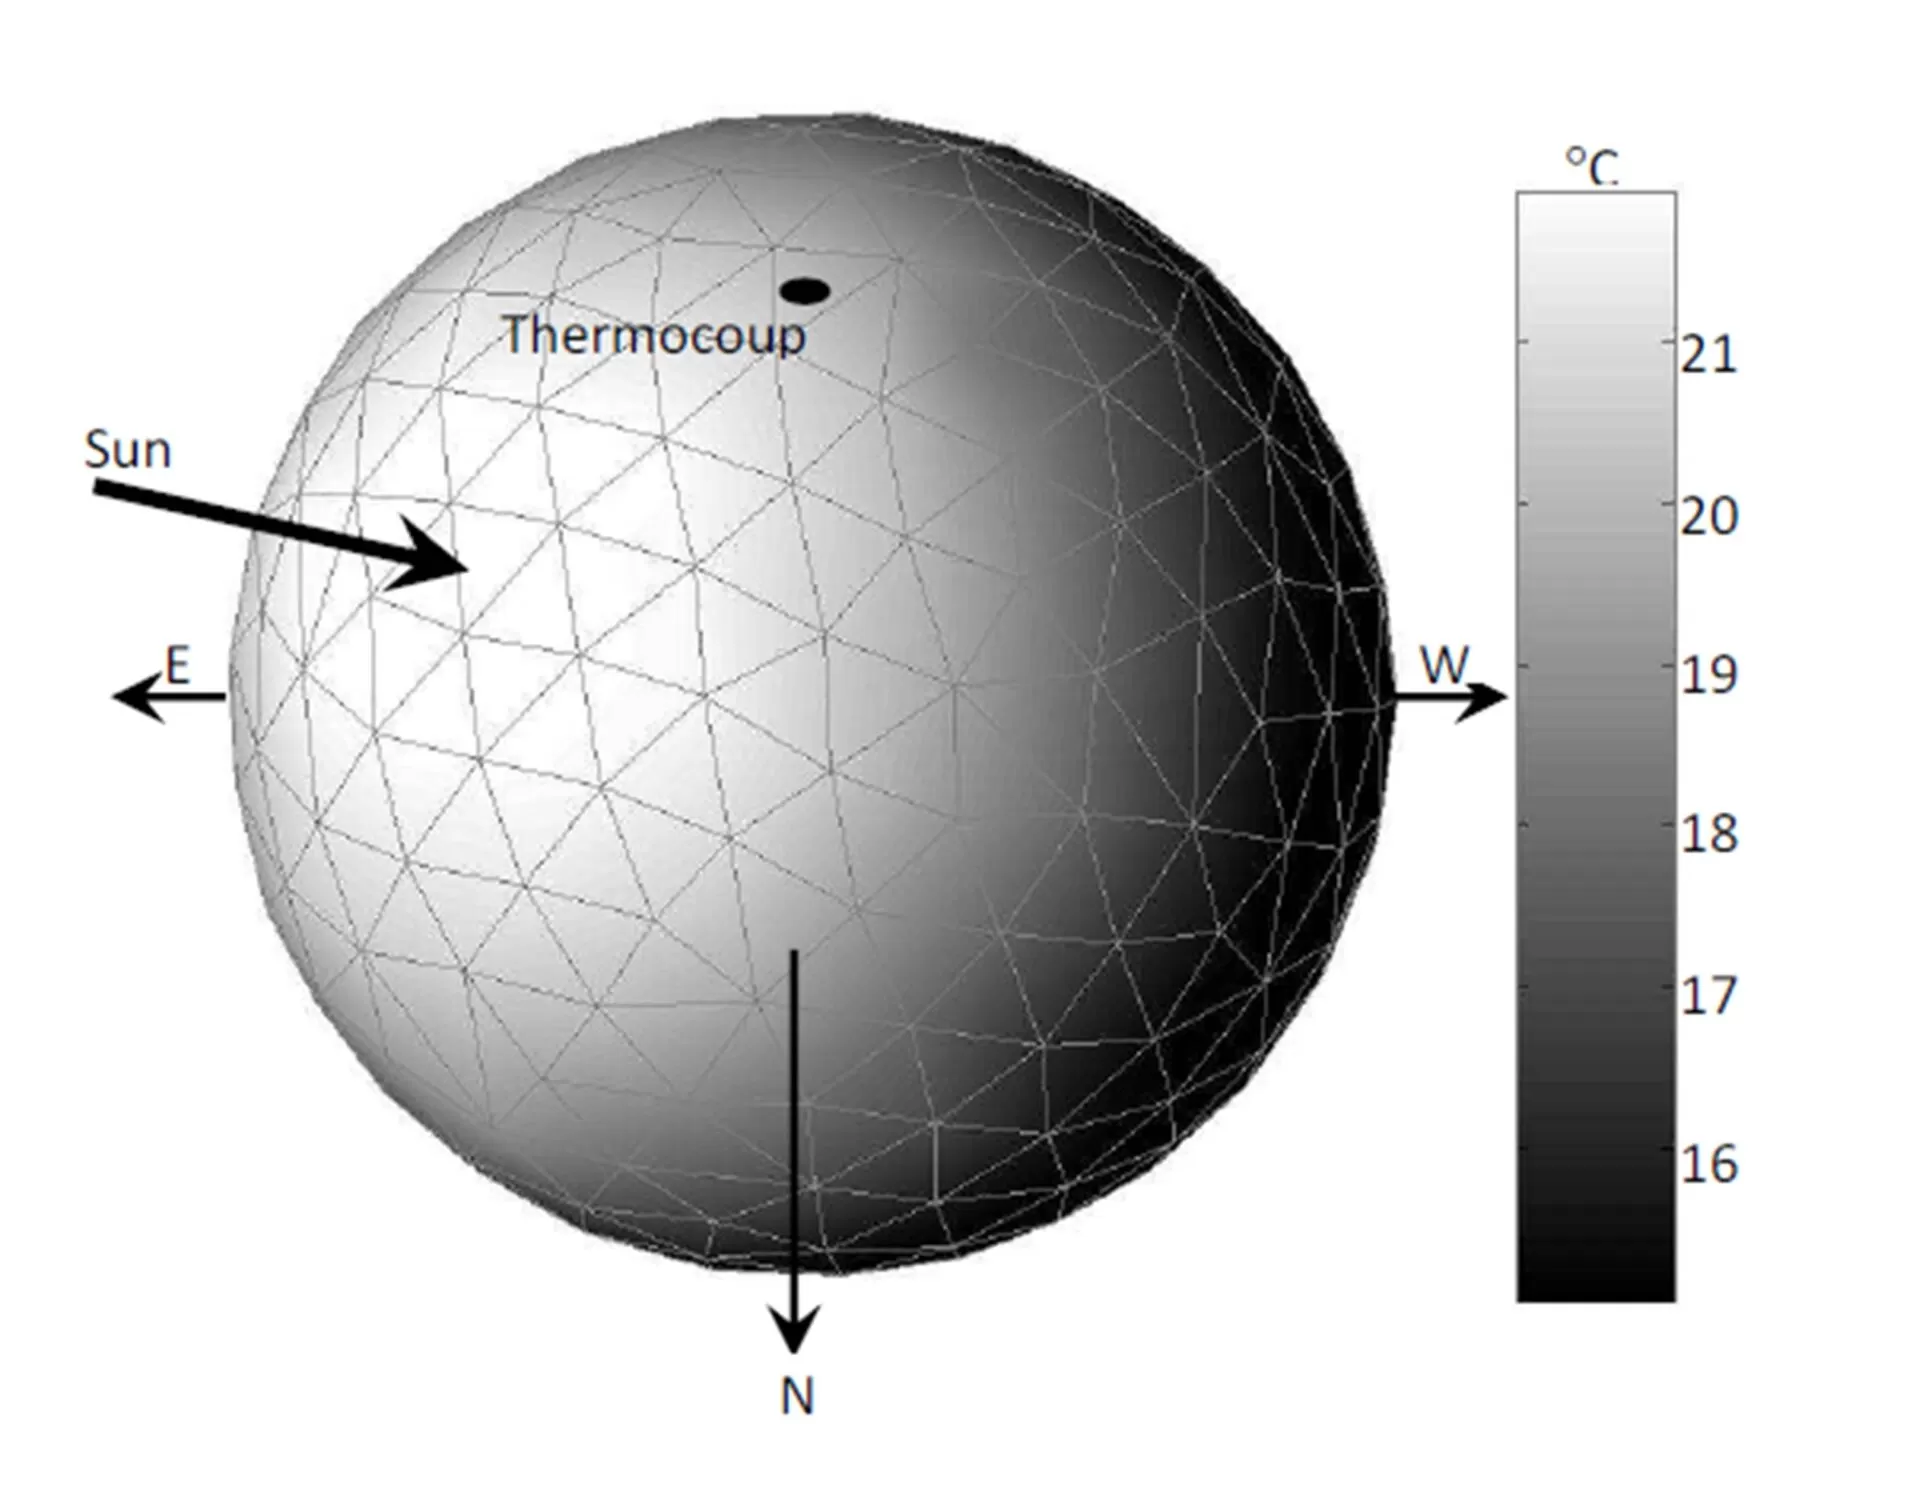
In the first comparison between the experimental measurements and the numerical results, evaporative cooling was not used. In the model, the temperature of the control volume closets to the position of the thermocouple, inserted under the skin of the apple, was used for comparisons of the skin temperature. The direction of the sun, the position of the thermocouple under the skin and the temperature distribution on the apple skin are shown in Figure 6.
Figure 6: Typical model result showing the direction of the sun, the position of the thermocouple and the apple skin temperature distribution
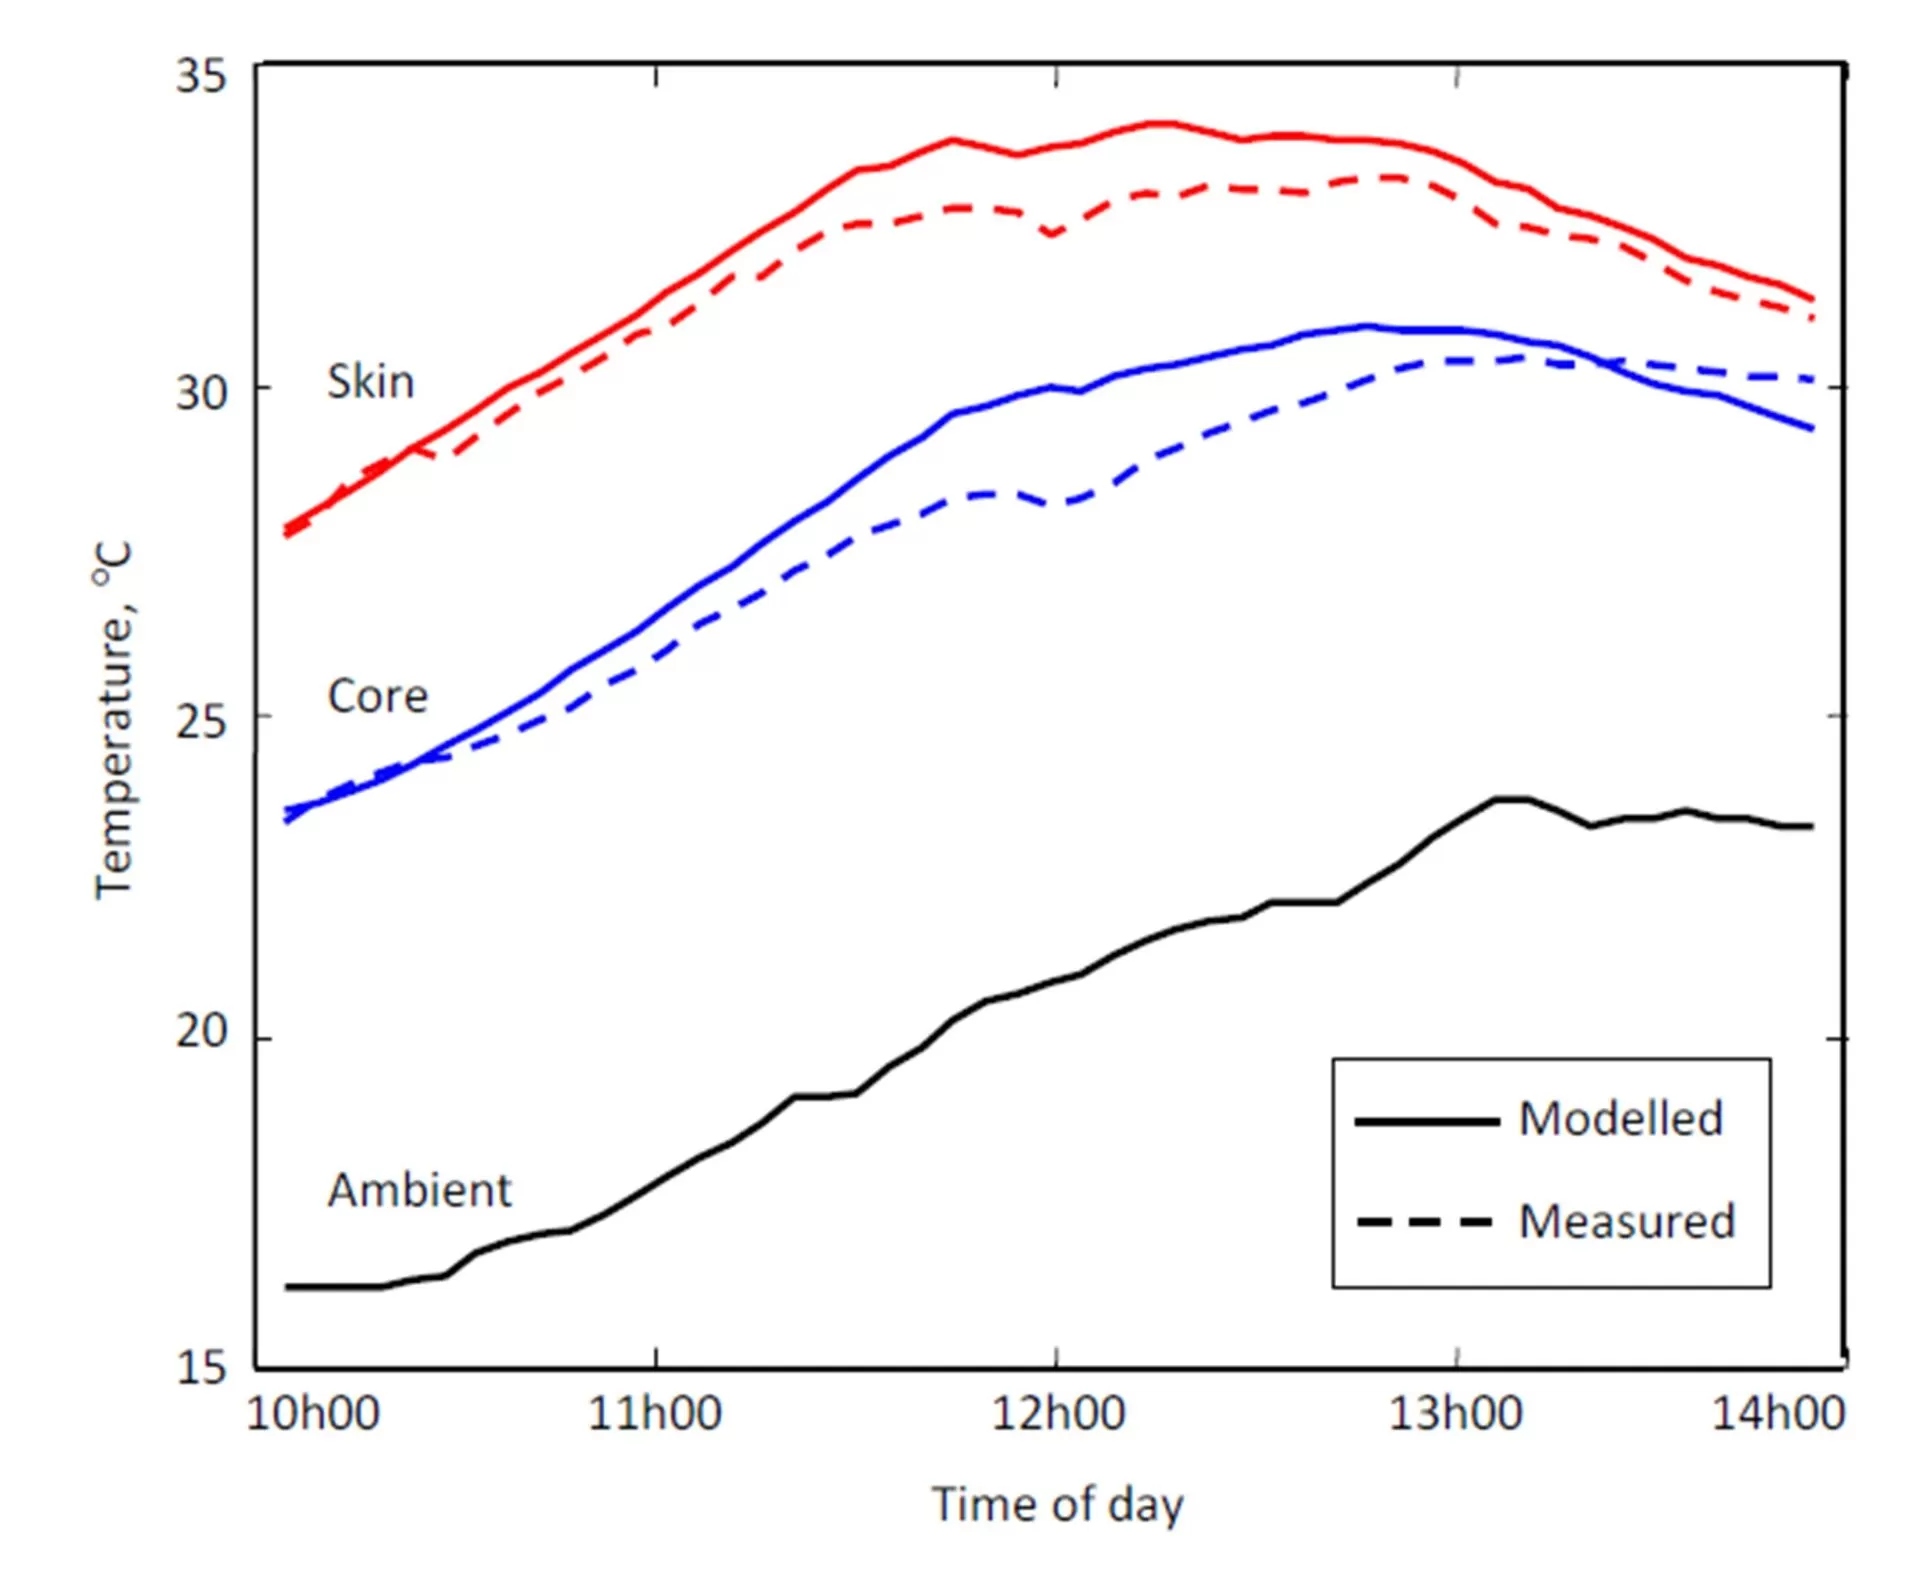
Figure 7 shows the apple core temperatures, the apple skin temperatures and the ambient temperature between 10h00 and 14h00 on 17 August 2006. It can be seen that, due to solar radiation, the measured apple skin temperature was roughly 8°C to 13°C higher than the ambient temperature. According to Gindaba et al. (2005), the skin temperature can be 10°C to 15°C higher than the ambient air temperature. The difference in the measured core and skin temperatures ranged from 1°C to 5°C. This is in agreement with Evans (2004) who has found through field measurements that the maximum difference in apple skin and core temperature is 5°C. The simulated temperatures closely followed the measured temperatures with the maximum error in skin temperature 1.3°C (4.1%) and the maximum error in core temperature 1.8°C (6.4%).
Figure 7: Uncooled apple skin and core temperature comparison
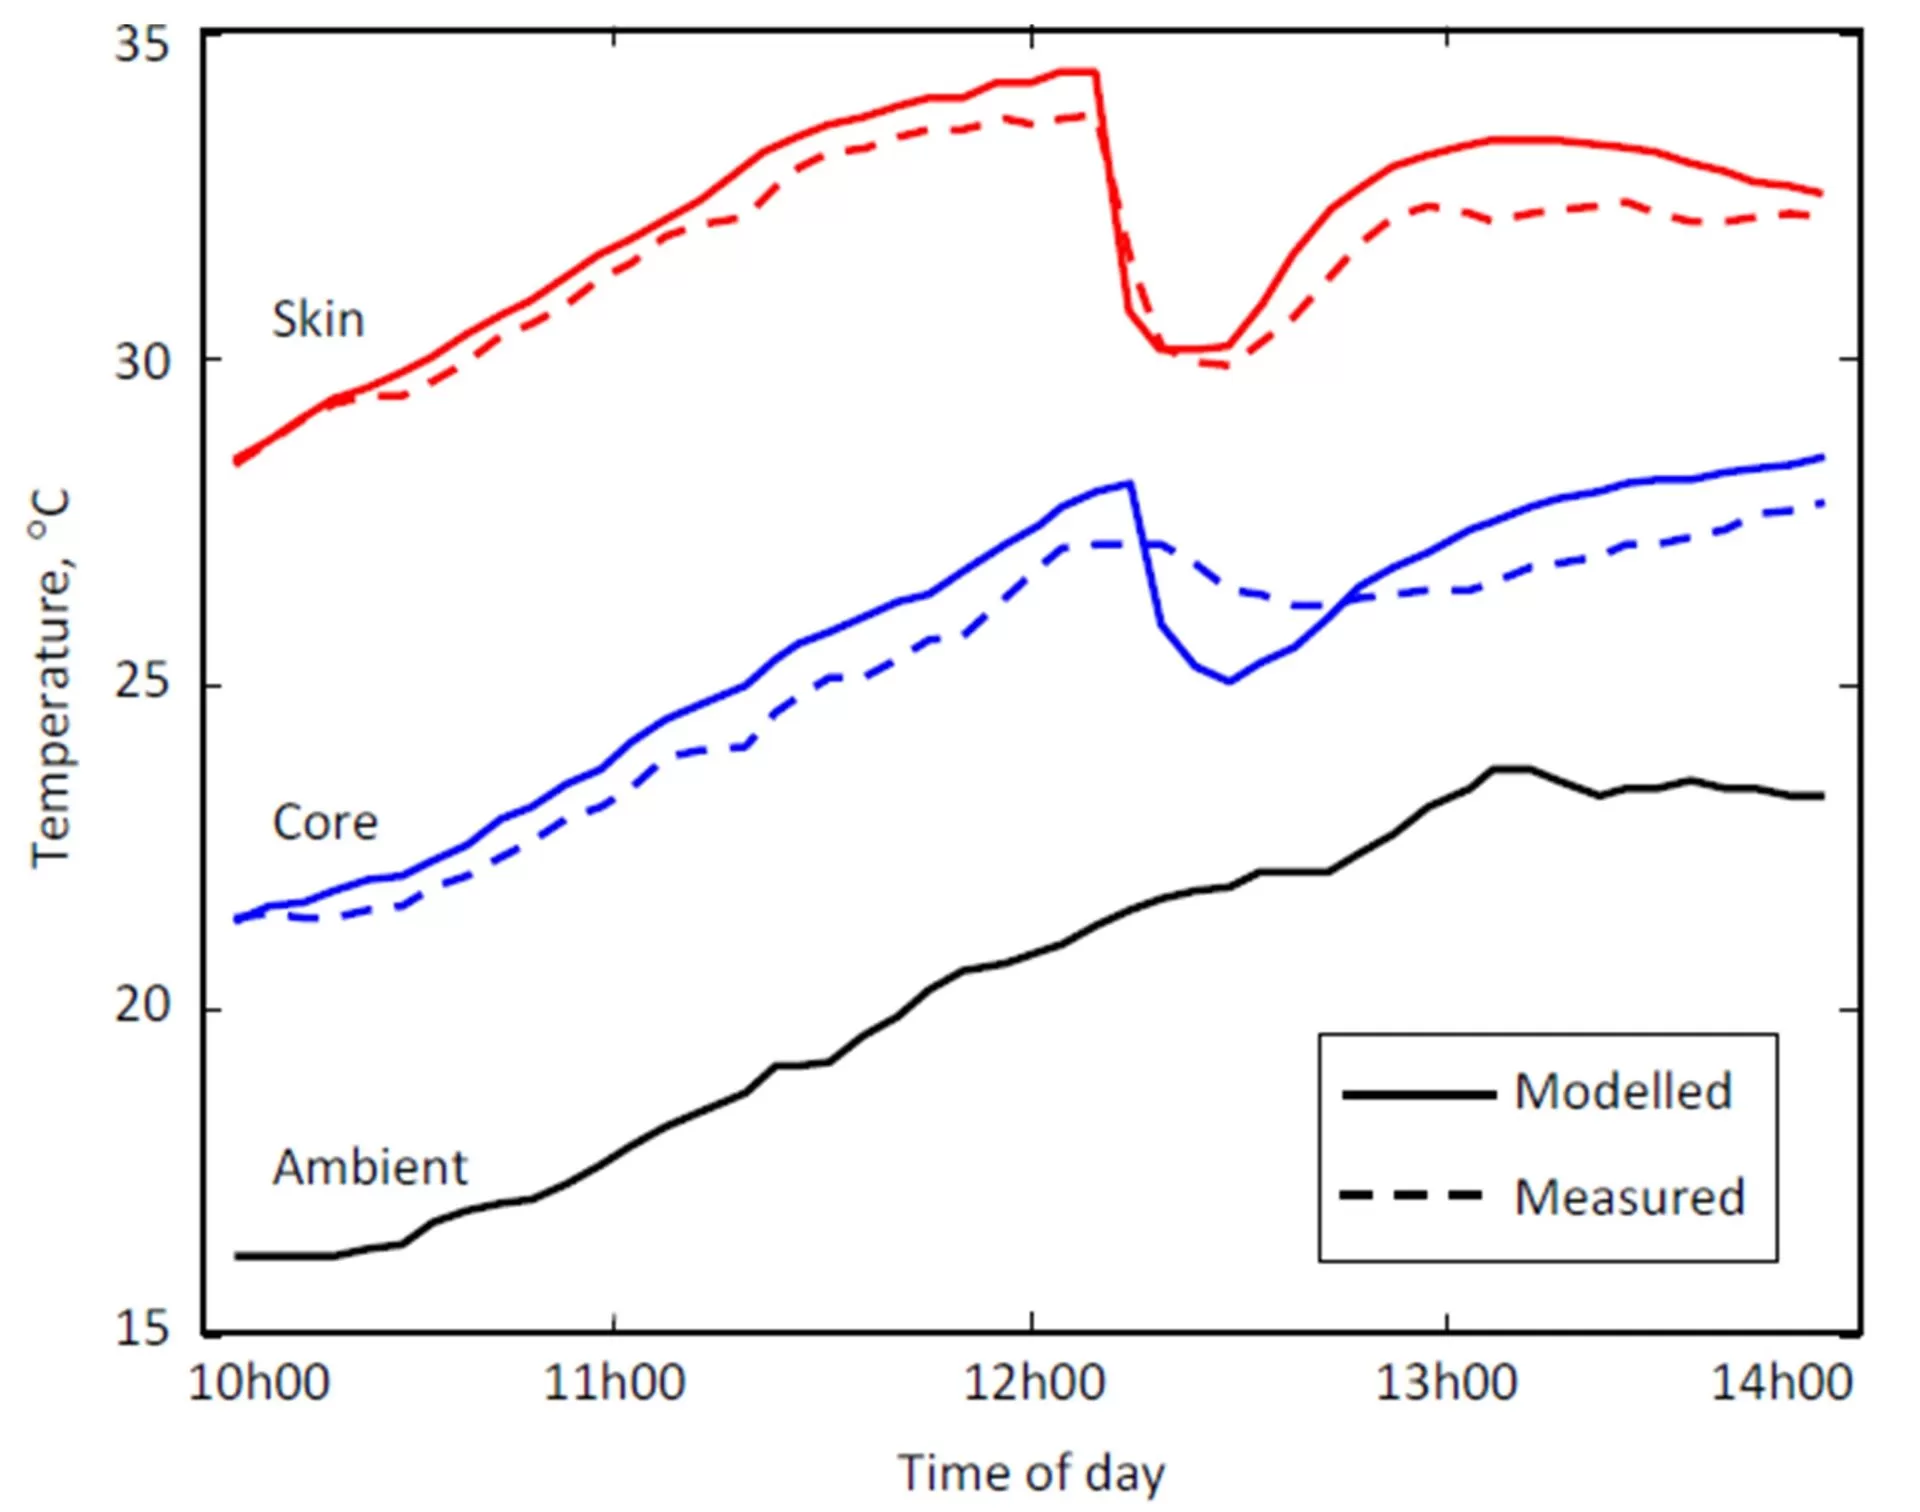
In the second comparison, evaporative cooling was initiated at 12h15. In the experiment, a fine spray of water (18°C) from a household spraying bottle was applied to the apple. During the experiment, the wind speed varied between 0 m/s and 1.8 m/s and it took the apple 18 minutes to dry completely. In the model, evaporative cooling was also applied for 18 minutes.
Figure 8 shows the apple core temperature, the apple skin temperature and the ambient temperature. The simulated temperatures closely followed the measured temperatures up until the moment that evaporative cooling was applied. The measured skin temperature showed a drop in temperature of 3.8°C over a period of 18 minutes. The model predicted a 4.0°C drop in temperature over the same period. Field experiments by Gindaba et al. (2005) showed a reduction of 3.1°C to 5.8°C in apple skin temperature. Iglesias et al. (2005) showed that the skin temperature could be reduced by up to 6.8°C. The reason for this high reduction in temperature can be explained by the fact that the air temperature is also reduced by up to 10°C (Iglesias et al, 2002; Iglesias et al. 2005). In the experiment performed here, the water was directly applied to the apple, and the ambient air was not influenced by the application of water.
Figure 8: Cooled apple skin and core temperature comparison
The measured core temperature showed a drop of only 1.0°C over a period of 30 minutes; while the model predicted a 2.6°C drop in temperature over a period of 16 minutes. Over the four hour period, the maximum error in predicted skin temperature was 1.7°C (5.5%) and the maximum error in predicted core temperature 1.0°C (3.9%).
Conclusions
A numerical model for the prediction for apple skin and core temperature based on known climatic conditions was developed. The model was able to predict the skin and core temperatures accurately with a maximum error of 6.4%. When evaporative cooling was applied, the model predicted the drop in skin temperature accurately with a 5.3% error. The model, however, predicted a drop in core temperature 2.6 times larger. The thermal properties of the apple were not measured, but taken from literature. In future, the thermal properties should be determined to obtain more accurate results.
The experiments were conducted during the month of August, and the ambient temperature reached a maximum of only 24.7°C. During the apple season (February to April), the ambient temperatures can reach 40°C and further experiments are needed to validate the model at these high temperatures. The mesh used had control volumes of equal size, the use of a mesh where the control volumes are smaller closer to the apple skin and larger towards the apple core would be investigated in the future.
The results from this research show that the model can be used in combination with a control system and climatic data from a weather station placed inside the orchard. The model can predict the maximum apple skin temperature and if it is above a set critical value, initiate evaporative cooling. The model can also be used to evaluate and optimise the effectiveness of different evaporative cooling schedules where timed on-off cycles are used.
References
1. Çengel, Y. A. (2003) Heat Transfer, A Practical Approach, 2nd Edition, McGraw-Hill Companies Inc., New York.
2. Evans, R. G. (1993) “Overtree evaporative cooling system design and operation for apples in the PNW,” The Good Fruit Grower, 44 (11) 23-27.
4. Fontana, A. J., Wacker, B., Campbell, C. S. and Campbell, G. S. (2001) “Simultaneous thermal conductivity, thermal resistivity, and thermal diffusivity measurement of selected foods and soils,” An ASAE meeting presentation, Paper number 01-6101, The Society for Engineering in Agriculture, food, and biological Systems.
5. Gindaba, J. and Wand, S. J. E. (2005) “Comparative effects of evaporative cooling, Kaolin particle film, and shade net on sunburn and fruit quality in apples,” HortScience, 40 (3) 592-596. Google Scholar
12. Reda, I. and Andreas, A. (2003) “Solar position algorithm for solar radiation applications,” Technical report, June 2003, National Renewable Energy Laboratory (NREL), U.S. Department of Energy Laboratory, Colorado.
13. Schrader, L. E., Zhang, J. and Duplaga, W. K. (2001) “Two types of sunburn in apple caused by high fruit surface (peel) temperature,” Plant Health Progress, 4 October. Google Scholar
14. Schrader, L. E., Zhang, J. and Sun, J. (2003) “Environmental stresses that cause sunburn of apples,” Acta Hort., 618 397-405.
15. Van der Gulik, T. (1995) “Using irrigation for tree fruit cooling,” Irrigation Factsheet, Ministry of Agriculture and Food, British Columbia, July 1995.