School of Computing, Engineering and Mathematics, University of Western Sydney, Sydney, Australia
Volume 2013 (2013),
Article ID 794626,
Communications of the IBIMA,
15 pages,
DOI: 10.5171/2013.794626
Received date: 26 September 2012; Accepted date: 28 October 2012; Published date: 25 March 2013
Academic Editor: Ibrahim Cil
Cite this Article as:
Farnaz Farid, Seyed Shahrestani and Chun Ruan (2013), "Quality of Service Concerns in Wireless and Cellular Networks," Communications of the IBIMA, Vol. 2013 (2013), Article ID 794626, DOI: 10.5171/2013.794626
The increasing popularity of wireless and cellular networks multimedia traffic among the consumers has raised new demands for investigation of their underlying Quality of Service (QoS) and Quality of experience (QoE) requirements. In this work, we carry out an application-based analysis of such requirements. Using this approach, we can properly take into account the heterogeneous nature of the underlying networks and the diversity of their traffic. There are several other reasons that justify the use of this approach. For instance, different QoS expectations and user Quality of Experience (QoE) in developed and developing countries can be mentioned. Many parts of the developing world are highly dependent on wireless and cellular technologies, while the provision of socioeconomic services in industrialized countries is generally based on conventional broadband and advanced cellular systems. Clearly, the variations of the underlying networking technologies perturb the QoS and QoE. So, we also examine the relationship between network QoS and QoE to propose a conceptual mapping between them. To achieve these aims, we first evaluate QoS requirements for network-based applications over different access technologies. To reach tangible outcomes, we then focus on UMTS based 3G cellular networks and WiMAX, and analyze several network-based applications with different path loss models, varying number of active users, and diverse types of traffic. The results exhibit that variant technologies, network congestions, user perceptions, and radio channel conditions affect QoS and QoE parameters to a certain extent.
The demand for wireless and cellular based networks that can carry multimedia traffic is on a very steep rise. Cisco Visual has forecast that by 2016, two-thirds of world’s mobile traffic will be video-based (Inc, 2010). This new flow of traffic will bring up new challenges for providing QoS guarantees. To meet some of the related challenges, most of the networking technologies move towards all IP-based approaches. This will partially demand the adaption of the best-effort traffic services, rather than the priority- based traffic management, which is more suitable for multimedia applications. Such initiatives have resulted in new opportunities that come with associated new requirements in terms higher network reliability. These lead to the need for an end-to-end QoS framework that takes into account several conflicting requirements. The requirements are the result of diverse applications, platforms, network architectures, underlying infrastructure and technologies, different business models, and end user expectations (Zhang et al., 2005).
One of the difficulties in establishing this framework is that, achieving QoS guarantees for applications in wireless, conventional, and cellular networks pose different challenges. The emergence of heterogeneous and hybrid networks, make this an even more complex undertaking because of the need to deal with divergent networking technologies. The performance of wireless and cellular networks is largely subject to radio channel conditions. Mechanisms for error recovery, congestion and power control vary from one technology to another. All of these contribute to network performance, resource management, and efficient maintenance of service quality (Jingjing and Ansari, 2011, Mingozzi et al., 2009). On the other hand, QoS requirements may vary depending on the application type. Voice and video applications are delay sensitive yet more loss tolerable than data applications.
End users may also have different expectations from different network-based applications. Their perceptions of QoS, or alternatively their QoE, are mainly influenced by many factors, including personal experiences, available bandwidth, application diversity, and their area infrastructure. For instance, people in developing countries tend to focus more on network availability than network quality (E. Sedoyeka, 2009). Results from a survey conducted in Tanzania shows that 81% of the participants give more importance to service availability than other QoS criteria. Yet, 74% of the participants think that having a low percentage of information loss is very important. These concepts of subjective and objective QoE and their relationships to network QoS are shifting the focus of service providers from QoS to QoE (Jingjing and Ansari, 2011, Reichl, 2010). For example, better network performance may lead to acceptable QoE levels, but it cannot always guarantee higher levels of QoS. In other words, many factors, including QoE, play an important role in getting the network QoS picture right.
In this paper, QoS parameters and some of the factors that affect them are analyzed. A mapping between QoE and QoS parameters, which can assist in providing an enhanced view of network QoS, is also proposed. This work starts by critically analyzing the published works on QoS requirements for several key application categories that include the experimental values available from some key studies. These requirements are further evaluated by designing traffic models that include different path loss models using UMTS and WiMAX as reference technologies. The evaluations focus on multimedia applications, including voice and streaming video. Our analyses confirm the results of previous experiments, showing the dependence of QoS parameter on radio channel conditions, number of users and more importantly on application categories.
The remainder of this paper is organized as follows. Our four-layered QoS model is presented in the next section that also discusses the relationships between QoS and QoE. The next section analyzes application categories based on their QoS requirements. The analyses of the QoS requirements along with simulation results are presented and discussed in the part after that. The concluding remarks are presented in the final section.
Quality of Service and Quality of Experience
The term QoS combines application-level, network-level, and user-level requirements. That is, it deals with both human experiences and technological concepts. From a human perspective, QoS is essentially a subjective matter, and hence hard to define. On the other hand, from network perspective, it can be defined more precisely. These points are studied in further detail in this section.
Four-Layered QoS Model
Figure 1 illustrates the four-layered QoS model based on the architecture proposed by ITU-T (Hardy, 2002). QoS paradigm in network starts with identifying client’s expectations from the service providers, or more precisely from the underlying network they are using. These expectations in turn help service providers in defining the network performance parameters, including information loss, end-to-end delay, delay variation or jitter, throughput and the like. To achieve the values identified for these parameters, a range of mechanisms is available for application to different network layers. The last part of the model deals with the client’s experience in terms of network performance, relating the model to QoE.
Fig 1. Four-layer QoS Model
As this work is related to intrinsic QoS, in network performance layer, QoS-related mechanisms in the context of different network-based layers and connections need to be studied in more details. Each network layer employs its own mechanisms to achieve certain QoS levels in terms of the key performance parameters. Physical layer uses adaptive modulation and coding scheme to improve the bandwidth allocation and interference management depending on the network conditions. Network layer uses path and access selection, and queuing algorithms to improve the QoS parameters. QoS mechanisms in transport and application layer involve various compression techniques and coding schemes. For example, robust header compression technique is used to compress the 40 byte overhead of RTP/UDP/IP to a smaller number (Fitzek et al., 2005).
Connection management mechanisms are engaged to secure the application-level QoS up to a certain level. Admission control algorithm controls the maximum number of users in the network to maintain the minimal levels of QoS required to support the ongoing transmissions (Tragos et al., 2008). For instance, if entry of a new user in the network causes the interference level to be raised to a value greater than the threshold value, the new user is not admitted. All these mechanisms aim to achieve timeliness, precision, and accuracy of transmission. These translate to delay, delay variation or jitter, throughput and information loss.
QoE Considerations
QoS and QoE are interlinked and highly related concepts (Soldani, 2006, Fiedler et al., 2010). QoE reflects the perception of user from the provided service. QoS relates to both application and network level parameters, which in turn dictate QoE, at least to a certain level. Figure 2 shows the mapping between network QoS and user QoE. Accessibility, retention, and integrity of service are the three important concepts relevant to QoE. Accessibility covers issues relevant to unavailability, security, activation, access, coverage, blocking, and call set up time, which are of paramount importance in establishing service guarantees. Retention refers to avoiding the connection loss. The integrity of service relates to important network performance parameters, including throughput, delay, delay variation, and information loss.
QoS can be broken down into several other quality related concepts, for instance into, QoR (Quality of Resilience), CoS (Class of Service) and GoS (Grade of Service). CoS is discussed in details in the next section. GoS encompasses connection setup time, call blocking probability, and probability of maintaining a connection. These parameters are mainly related to the accessibility of QoE parameters. For example, in next-generation network, call control mechanisms based on probability of rejection of a request is a GoS parameter. QoR deals with the operational matters of a service (Stankiewicz and Jajszczyk, 2011).
Many researchers have studied the integrity of service from a technical point of view. In some of these works, subjective performance measurements through usability testing are carried out and are then matched to objective performance parameters (Teyeb et al., 2006) . It has been noted that QoE can be influenced by user’s environment, device, and type of service. For example, due to a smaller screen size in a mobile device, users may tend to be satisfied with low video quality of a movie when viewing it on such a device (Florence Agboma, 2006). Similarly, users in a business environment may expect higher QoS compared to a home user. All such user QoE variables must be taken into account when dealing with network and application-based QoS analysis.
Fig 2. Relationship between QoS and QoE
Analysis of QoS Requirements
Application categorization is important in achieving the required QoS levels (Meddeb, 2010). There are different criteria proposed by researchers to accomplish such categorization, though. For instance, applications can be categorized based on the underlying transport protocol, time dependency, and resource allocations. Voice and video applications mainly use the unreliable UDP for data transfer, whereas TCP is the protocol of choice for transferring of files and web-browsing applications. Applications may also be characterized by service classes, CoS, which is defined differently for various access technologies. Most of the advanced wireless and cellular technologies have their own service classes. These classes resolve the behavior and acceptable values for network performance parameters or integrity of service parameters.
To facilitate meeting of the QoS requirements for different applications, UMTS has defined four service classes. The Conversational class deals with the applications that are delay sensitive meant for human-to-human interactions. Highly interactive voice and video applications, such as videoconferencing, fall in this category. The applications in the Streaming class are mainly machine-to-machine interaction-based applications and can therefore tolerate some delay. Live streaming is an example of such applications. The Interactive class supports applications that are intended for human-machine interactions. The most popular applications in this category, are perhaps web browsing, online gaming, and telnet. The Background class deals with what can be considered as traditional Internet applications, including e-mail, file sharing, and file download.
In WiMAX the classes are treated in a slightly different manner(Stankiewicz and Jajszczyk, 2011). The Unsolicited Grant Service (UGS) class deals with delay intolerant applications such as VoIP and videoconferencing. The real-time Polling Service (rtPS) class is concerned with streaming applications such as audio and video streaming. The extended real-time Polling Service (ertPS) class covers delay sensitive variable bit rate applications such as VoIP with silence suppression. The applications with variable bit rate such as FTP are part of the non-real-time Polling Service (nrtPS) class. The Best Effort (BE) service class supports e-mail and web browsing applications.
Clearly, time dependency is one the major considerations for application classification (Yan et al., 2004). The applications that require output performance that resemble real-time situations, are classified as real-time ones. Those that do not need such performances, are classified as non real-time applications. Real-time applications are in general delay sensitive but loss-tolerant. On the other hand, non real-time applications are delay tolerant, but sensitive to information loss. Applications may also be classified based on the resource allocation (Yan et al., 2004). The applications can be symmetric or asymmetric. For example, video telephony is a symmetric application, requiring similar resources at both sender and receiver ends. Whereas video-on-demand and live streaming are asymmetric applications, requiring more resources in the server side compared to that of the client side.
No matter how the applications are classified, the aim is to establish the acceptable levels of information loss, delay, and delay variation for various categories. This will also depend on infrastructure constraints and the underlying networking technologies in use. The levels may for instance need to be considered differently for conventional, wireless, or cellular networks. While there has been substantial research in this area, interestingly enough, there are clear discrepancies among the published works on the acceptable value of QoS parameters (3GPP, 2002, Szigeti, 2005, ETSI, 2006, Unit, 2005).
Based on Ping End-to-end Reporting (PingER), for a videoconferencing information loss below 1% is regarded as satisfactory, 1%-2.5% of loss is acceptable, 2.5%-5% is poor, 5%-12% is very poor, and loss above 12% is unacceptable (Unit, 2005). The observations indicate that when videoconferencing experiences 4%-6% of information loss, it is hard for non-native speakers to communicate properly. This indicates that user’s ability can affect the required levels of QoS and QoE. On the other hand, according to Cisco, the information loss for acceptable videoconferencing should be limited to 1%(Szigeti, 2005). As reported by ITU-T, the acceptable level of information loss for videoconferencing is 3%(ETSI, 2006). Figure 3 compares accepted end-to-end delay values for different applications reported by 3GPP, ITU-T and Cisco (3GPP, 2002, Szigeti, 2005, ETSI, 2006). For conversational and videophone applications, the three sources agree that it is preferred to have an end-to-end delay of no more than 150 msec. However, according to ITU-T, this value refers to a long-term achievable value. Given the current technology, an end-to-end delay value of around 400 msec is considered to be acceptable by both ITU-T and 3GPP. For real-time games, 3GPP recommends a delay of no more than 75 msec. In contrast, ITU-T recommends a value no more than 200 msec. The requirements for two-way asymmetric data application such as Telnet also vary from one source to another. ITU-T recommends that the end-to-end delay should be less than 200 msec. However, 3GPP considers 250 msec as an acceptable value. Different sources also give different benchmarks for jitter or delay variations. For instance, Cisco requires the delay variation for an audio call to be less than 30 msec, while ITU-T and 3GPP say it is preferable to have delay variation less than 1 msec(3GPP, 2002, ETSI, 2006).
Fig 3. Comparison of End-to-End Packet Delay
Figure 4 shows the recommended values of information loss for different applications by three key studies (3GPP, 2002, Szigeti, 2005, ETSI, 2006). For loss in audio calls, the sources provide different benchmarks. According to ITU-T and 3GPP, it is preferred to have less than 3% information loss and Cisco sets it to no more than 1%. It is the same situation for streaming applications. According to ITU-T, end-to-end delays of less than 10 second are preferred for video streaming applications. However, Cisco recommends a value of less than 4-5 seconds. Cisco recommends a value of no more than 5% for information loss, where only 1% of loss is recommended by ITU-T. These can be looked at in light of another study conducted in Tanzania (E. Sedoyeka, 2009). That study shows that 74% of users are generally satisfied with 1%-5% of information loss. ITU-T recommendations Y.541 suggest slightly different values for information loss, delay, and delay variation compared to those of other sources(Stankiewicz et al., 2011). Table 1 shows the values relevant to multimedia applications.
Fig 4. Comparison of Acceptable Packet Loss in Different Applications Table 1: ITU-T Rec. Y.541 QoS Values
Fig 5. Comparison of Data Rate in Different Applications
Similarly, different sources recommend different levels of required bandwidth for different applications. Figure 5 is a comparison of recommended data rates suggested by different sources. For instance, ITU-T recommends 16 to 384 Kbps of data rate for video streaming applications, but Cisco has this as 384 Kbps data rate. Additionally, performance parameters are varied based on environmental settings. For example, vehicular and static mobile environment require different QoS parameters (Díaz et al., 2010). Table 2 and table 3 summarize the information loss and mean jitter for stationary and vehicular conditions. The results show that vehicular environment experiences more information loss in mobile networks than that of stationary situations. For instance, when the operator 2 changes the cell, it experiences 3.68% of packet loss using UMTS, which is slightly higher than the previously stated accepted values. The experimental results also show that the information loss varies according to type of radio access technology. For example, under certain circumstances calls using GPRS experience more loss and delay variations compared to those using UMTS and HSDPA (Díaz et al., 2010).
Table 2: Packet Losses in Different Cellular Scenarios Table 3: Mean Delay Variation in Different Cellular Scenarios
Analysis of Parameter Variations on QoS
In this section, to study the effects of different path loss models, varying number of users, and heterogeneous traffic on QoS parameters various scenarios are simulated and analyzed. Each simulation is run for 12 times and an average is taken for all the results with a 95% confidential interval. UMTS and WiMAX are used as the reference technologies for these studies. In the first scenario, 12 and 20 voice communications over UMTS are considered. The clients are located in a macro cell of with a radius of 3 km in stationary modes. The cell is divided into three sectors covered by one base station. To compare the QoS parameters for different conditions, several path loss models are considered. Table 4 summarized the path loss models used for each type of environment. In latter scenarios, streaming server-client model is integrated with these voice traffic models. The streaming server uses WiMAX while the streaming clients use UMTS. An MPEG-4 standard trace file of Jurassic Park I is used as the streaming video file (TKN). The video resolution is set to QCIF (176X144), which is suitable for 3G systems.
With 12 voice calls within the cell, Figure 6 indicates the percentage of information loss for different path loss models. In an indoor environment, the calls experience less information loss than those in other environments. In a rural environment, voice calls encounter an average loss of 3.2%. Calls in the sub-urban environments experience almost similar losses. Free space and Hata-large-city models exhibit the highest levels of information loss. Average end-to-end delay values also show similar behaviors. The indoor environment experiences the lowest average end-to-end delay in comparison to calls in other environments. End-to-end delay values in all environments, except for pedestrians, are within the target performance ranges recommended by 3GPP and ITU-T.
Table 4: Path Loss Models against Different Environment
In the next scenario, the simulations are carried out with 20 active voice communications. The results for rural, urban, pedestrian, and indoor environments are compared. Table 5 shows information loss, end-to-end delay, and packet delay variation for each of these environments. It can be noted that for a pedestrian, the previous scenario with 12 voice communications, showed experience higher levels of information loss, which is unexpected. To see the reasons for this behavior, the levels of loss is further analyzed on a call-by-call basis. Figure 7 demonstrates the information loss for each call in a pedestrian environment model for all 12 voice communications. The figure shows that call number 8 has a higher information loss compared to all other calls, which makes the average information loss appearing higher for this environment.
All the simulation results are then compared with the benchmark values reported in the previous section. For rural environments, ITU-T, 3GPP standard and survey results from Tanzania are considered. Cisco recommendations are used as the benchmark for city environments. In rural environment with 12 and 20 voice calls, the users experience a slightly higher information loss compared to the benchmark values. However, if the results from Tanzanian survey are taken into account, the performance can be regarded as satisfactory. Additionally, call-by-call analysis reveals that the average information loss may increase with certain performance degradation, for instance due to poor signal. End-to-end delay values for both cases meet the acceptable performance values.
Fig 6. Information Loss in Different Path Loss Models for 12 Voice Clients Table 5: QoS Parameter Values Used in Different Path Loss Models
The analysis of the results shows that compared to rural environments, the urban environments experience less information loss. The call-by-call analysis shows that information loss experienced by a certain call takes the average value to a level higher than accepted value. This issue can be easily resolved if the parties with such high values, can move to a place where the coverage is better. However, this simulation model seems less suitable for establishing the benchmark values for open free space and large cities. For these two environments, both information loss and end-to-end delay values are higher than the benchmark values. The result analysis clearly identifies the effects of different environments and the number of users on QoS parameters. User satisfaction may also vary depending on the environment, as users in certain situations may for instance, give more importance to accessibility rather than integrity of service.
Fig 7. Call by Call Analysis for Information Loss in Outdoor to Indoor Pedestrian Environment
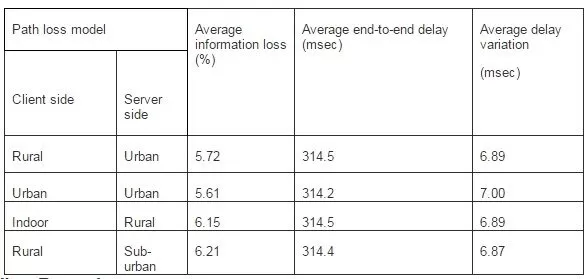
In the next scenario, a streaming client is included in the traffic. The streaming server uses WiMAX. It is first assumed that the 20 voice clients and the streaming client are in a rural environment and the streaming server is in an urban environment. In a later stage of the simulations, on the client side the path loss models are changed to produce a mixed environment. The server side model is also altered to resemble a suburban environment. Table 6 shows the average information loss, average delay and average delay variation values for the streaming clients under different path loss models. It is evident that the presence of the streaming client in the network affects the performance of voice calls. In the rural-urban environment the voice clients experience a packet loss of 5.7%, while in the urban-urban environment, the loss is 5.6%.
Table 6: QoS Parameters for Streaming Clients
Concluding Remarks
This paper has studied QoS requirements for wireless and cellular networks supporting multimedia applications. Given the diversity of underlying technologies, variations in environments, and different client expectations, this work utilizes an application-based approach. Key factors and parameters affecting QoS are examined to identify acceptable levels of the relevant parameters. Also, a conceptual mapping between QoS and QoE is proposed to provide a combined view of network QoS and client’s experience. Various traffic models, based on UMTS and WiMAX, are also designed and analyzed. These models are evaluated for supporting various multimedia applications, including voice and streaming applications, with different path loss models and variant number of users. The results of these analyses show how the underlying networking technology, network congestion, heterogeneous natures of the traffic, and the radio channel conditions affect QoS parameters. In our future works, the traffic models will be expanded to include more sophisticated applications and access technologies. Moreover, QoS and QoE in regards to those applications and technologies will be analyzed in more details.
Acknowledgment
We would like to thank OPNET for providing modeler license.
ETSI, T. S. (2006). ‘Telecommunications and Internet Converged Services and Protocols for Advanced Networking (TISPAN),’ Review of available material on QoS requirements of Multimedia Services. Google Scholar
Mingozzi, E., Stea, G., Callejo-Rodríguez, M. A., Enríquez-Gabeiras, J., García-De-Blas, G., Ramón-Salquero, F. J., Burakowski, W., Beben, A., Sliwinski, J., Tarasiuk, H., Dugeon, O., Diaz, M., Baresse, L. & Monteiro, E. (2009). “EuQoS: End-to-End Quality of Service over Heterogeneous Networks,” Computer Communications, 32, 1355-1370. Publisher – Google Scholar
Soldani, D., Li, M. & Cuny, R. (2006). QoS and QoE Management in UMTS Cellular Systems, /edited by David Soldani, Man Li [and] Renaud Cuny, Chichester:, John Wiley and Sons Ltd, Number of Pages:xxvii, 459 p.; Translator: Soldani, David. Li, Man. Cuny, Renaud. Publisher – Google Scholar