Ioana Cristina FLORESCU1, Silvia Elena CRISTACHE2, Daniela Șerban3 And Andrei BĂDIN4
1Institute of National Economy – Romanian Academy, Romania
2,3,4Bucharest University of Economic Studies, Romania
Volume 2019,
Article ID 124935,
Communications of the IBIMA,
12 pages,
DOI: 10.5171/2019.124935
Received date: 27 February 2019; Accepted date: 12 September 2019; Published date: 25 October 2019
Academic Editor: Elena Bogan
Cite this Article as:
Ioana Cristina FLORESCU, Silvia Elena CRISTACHE, Daniela Șerban And Andrei BĂDIN (2019)," Development of the Tourist Services at European level based on the Public Food Indicators", Communications of the IBIMA, Vol. 2019 (2019), Article ID 124935, DOI: 10.5171/2019.124935
The food represents an important and enjoyable segment of our lives. By the way of organization, the activity of public feeding acquires a special importance in transforming the way of life of the people, offering multiple possibilities of use of the free time. The food services are an integral part of the tourist services. Also, as an economic business, the food services are permanently associated with tourism activities, and their dynamics are significantly influenced by the evolution of the tourist circulation. Considering the culinary technology at the European level, one can reach the conclusion that within it, there are significant changes in the assortments of the commercialized products, which are finally leading to the diversification of the interdependencies with other sectors of activity. The catering operators must face the new challenges generated by the leap forward of science and technology both at the European and the global level. In order to know the dynamism and the changes made at the European level, within the activity of food services, the authors tried to characterize it by using elementary statistical methods (the graphical method) and analytical methods (the regression and correlation method). In the analysis, the data used were those provided by Eurostat, and their processing was performed by the Excel and EViews software packages. The results of the study highlighted the fact that the workforce from the tourist activity out of which the food services are also a part, has a strong influence on the catering services at the European level as well as on the tourist reception structures.
Keywords: tourism activity, macroeconomic indicators, correlation and regression method, catering services, European Union
Introductory Aspects Of Catering
According to Kotler et. all (2006), tourism is considered by some specialists to be the largest and most cosmopolitan industry in the world.
We were all at weddings, at various receptions or conferences, and the only thing these events have in common is the wide range of dishes made available. While most of us only think about the richness of the menu and how to make the diners taste the food available, others with a more developed entrepreneurial spirit, wonder what business opportunities are hiding under the silver dishes filled with food.
As written by Joice Weinberg (2007, p. 8), catering is the business that offers food services to a location, such as a company, a hotel, a kindergarten, a hospital, a physical person and so on.
The catering services are provided at corporate events, team-building activities, banquets, conventions, conferences, weddings, anniversaries, product launches, and fairs and so on.
According to the report of the European Commission (2010, p. 7), there are 5 main reasons why people choose to set up a catering company:
Preparing dishes is a business they are passionate about.
It is a fast-paced business, if they know how to handle their customers.
The market for the products and services that it offers is steadily increasing
Events happen … anytime and anywhere (in large cities, small towns, tourist areas, etc.).
Clients can be from the employees of an institution, to the happy people having a wedding or baptism. In addition, the lunch from the cassolette in front of the computer is much cheaper than a meal at the restaurant.
When we talk about a “catering provider”, we refer to an organizer who serves food, with everything – waiters, tables, Swedish buffet, etc.
Food can be prepared at the place or in the restaurant of the catering company’s owner. Details can also be brought to the “scene”.
Any event with drinks and food or hors d’oeuvres is called a catering event. Many events require a certain color scheme or theme chosen.
A catering company or such a specialist is the one who will prepare food and make it look as attractive as possible. So, some catering companies have adopted a full-service business model associated with event-planners. They deal with food, decorations, tables and the lighting in the hall.
Literature Review
In the framework of the market economy, the consumer is the central axis of all the activities aimed at meeting the exigencies on which the efficiency of the economic activities depends. The public catering, in the category of basic services, aims both to meet the daily needs of food consumers, as well as offering and making a way to spend the free time in a pleasant way.
The basic objective of the culinary technology is to study the culinary procedures under technical and economic conditions; the concept is defined by three main elements: distribution, technical-material supply and manufacturing.
The distribution defines the profile of the unit where the production is dismantled, its nature, the operating regime, the capacity and the assortment program, and the distribution system.
The catering system, as a way of industrializing the production of culinary products, involves the existence of a varied assortment, of an advanced stage of culinary preparation, of portioning in packaging that offers a serving facility.
As seen in the book written by Entrepreneur Press & Jacquelyn Lynn (2012, p. 11), nowadays, modern man is preoccupied with the purchase of ready-to-eat food, and because the classic culinary products do not fully satisfy the desires and demands of the modern consumer and have a narrow range of assortment, the catering system has been searched for and found. This offers easy, quick and economic possibilities of procurement of raw materials to be converted into food.
The catering system can be divided into two separate stages in time and space:
Industrial Catering
Commercial Catering
Industrial Catering
The industrial catering has two phases:
The industrial production (centralized)
The conservation phase (freezing)
In the book of Fosket & Ceserani (2007, p. 347), it can be seen that the industrial catering (the system of feeding the industrial employees) is a catering industry sector which deals with beverage and food at the workplace by the employers’ organizations. The industrial catering services have a more functional importance than the one of relaxation which is entertainment, although the dining space is a place of rest, relaxation and restoration of workforce for the employees who attend these facilities. The industrial catering in the big companies has been practiced since the 19th century when the correlation between physical and mental health of employees has been demonstrated.
Now, it is desired to change the obsolete image of “the industrial canteen” and to make the transition to professional catering styles with an accentuated commercial character. The most dynamic institutions in this respect are the oil, banking and insurance companies. It seeks to offer a wide range of catering services to employees by providing as many types of units as possible. The main types of endowments in the industrial catering are as seen in the book of Stănciulescu (2003, p. 149):
Single-serving cafeteria for employees, offering snacks, full menus, drinks;
Café bar with frugal meals (sandwich, snacks, beverages);
The restaurant for the middle management staff, which offers the main meals but with a wide variety of food and beverages and a high standard of the catering products;
The top managerial restaurant for the main meals, but also for the morning coffee or the afternoon tea;
Non-stop automated machines offering full menus, snacks, drinks used by all the employees;
Banquet facilities for business meetings similar to those in the restaurant.
The charity catering is also practiced as stated by Mattel (2016, p. 2), which is a non-commercial section of the catering industry and deals with the preparation and serving of catering products (food and non-alcoholic beverages) whose prices are not entirely borne by the consumers (hospitals, schools, children and elders’ homes, sanitariums, prisons).
The industrial catering is carried out entirely in specialized production units and consists in the centralized production of culinary preparations, meaning: primary processing, preparation and portioning of the preparations and the second phase, namely; the preservation of the preparations over a longer period by: freezing, refrigeration, sterilization, dehydration. Freezing is the best and most commonly used conservation method.
Commercial Catering
Commercial catering includes:
Conservation phase – storage in freezing rooms;
Conversion phase of the preparation by defrosting and heat treatment;
The consumer phase – the one in the public unit for alimentation or in the family environment.
Commercial catering, as shown by Ceserani & Fosket (2007, p. 16), deals with organizing the unbinding of the industrial catering product, so what links the industrial and commercial catering is the distribution.
There are two basic principles for the distribution of the catering products to be produced in optimum conditions:
Catering cannot be used without a well-established refrigerated chain, without assuring the transportation with specialized vehicles (isothermal installations);
Making cold storages located in the consumer centers, in order to be easily accessible to the outlet centers;
Being a fairly large area, catering has provided several niches, several business areas, each company chooses one or sometimes even two. The largest; regarding the number of persons to serve, is the industrial catering, which involves the supply of gastronomic products on a large scale: in military units, hospitals, large construction sites, and so on. Here, the number of the people served can reach up to five or six thousand. Nowadays, there is a clear tendency for these customers to open their own canteens, administering them alone, or letting a catering company do it, thus, greatly reduce costs.
Research Methodology
The process of knowing the European tourism activity according to Stanciulescu (2003) requires crossing several separate and successive steps that include data collection, systematization and processing operations, analysis and interpretation of results and formulation of conclusions. The research methodology was based on the secondary data taken from Eurostat for the European Union countries. The main research methods used for time series are the total research for the macroeconomic indicators that characterize the tourist activity such as: number of employees in travel agencies, catering services (of public alimentation) and accommodation units.
The data gathered from the national and international statistical publications allowed the use of simple methods of characterizing the tourist activity such as: the graphic method that presents the evolution of the macroeconomic indicators of tourism activity in Romania and in the EU, the method of structural changes, and simple methods of hierarchy and processing of these indicators which are analyzed independently and in correlation with the factors of influence. It should be taken into consideration that the principles of developing the system of tourism indicators should ensure its efficiency and increase the degree of applicability and comparability. For a more complex analysis of the link and interdependence between the macroeconomic indicators that characterize the tourist activity at the EU level, the basic methods have been completed with econometric modeling methods. The stages of the econometric analysis that were used in the paper are: establishing the correlation level and intensity, identifying the regression function for the data from the analyzed period, validating the obtained model and so on. Thus, the single-factorial and multifactorial regression method was used which implies an estimation of the regression function parameters through the OLS method as stated by Voineagu (2007, p.277).
The Results Obtained on The Basis of The Secondary Data Regarding the Tourism Activity at The Level of The EU Countries
Analysis of the statistical distributions in order to characterize the evolution of tourism at a European level, based on specific indicators during 2014-2016
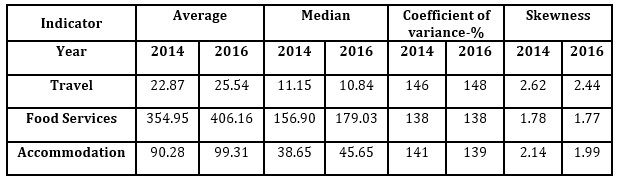
As a result of the systematization of the statistical data regarding the tourism activity, derived indicators (indicators of the central trend, variation and asymmetry indicators, concentration indicators) were determined, which allowed for the characterization in the first form of the tourist activity at the EU level in 2014-2016 (see Table 1) for:
Travel Agency
The average value of the number of employees in the travel agencies at the EU level in 2014 was of about 23 thousand people / country with a representation that exceeds the 100% threshold, namely; 146%, due to a very high dispersion of 1116.31. Compared with 2014, in 2016, there was an increase in the number of employees in tourism agencies with 3 thousand persons / country. According to the calculation of the median value based on the formula from the book of Yule & Kendall (1960, p. 216), we can conclude that 50% of the travel agencies in the European Union have a number of employees in 2014 of over 11 thousand persons / country, and in 2016 of about 11 thousand people.
The number of employees in the travel agencies at the EU level records different values compared to an average of 23 thousand persons in 2014 and 26 thousand persons in 2016. The value of the asymmetry coefficient in 2016 was 2.44 with 0.18 lower than the one recorded in 2014. This positive value suggests that the average number of employees in tourism agencies in 2016 and 2014 at the EU level does not exceed its median value of 11 thousand people / country.
Food Services
The macroeconomic indicator depending on the number of employees in the travel agencies in 2014 records an average of 354.95 thousand services / country, and in the year 2016, it registered an increase of 0.18 thousand / country. The average of catering services is not significant because the value of the homogeneity coefficient is very high (138%). This high value of the homogeneity coefficient is due to the fact that the performances of tourist activity in the EU countries are heterogeneous due to the disparities existing in their level of development. This is confirmed by the positive and fairly high value of the asymmetry coefficient of 1.7, because in 2014 and 2016, less than 40 thousand services are recorded in 6 countries.
Accommodation
The average value of the accommodation units in 2016 was about 99 thousand units / country, more than 2014 with 9 thousand units / country. This indicator has a very high heterogeneity (variation coefficient of 141% in 2014 and 139% in 2016). The maximum variation range of about 491,000 units / country in 2014 and 524,000 units / country respectively in 2016 is high, resulting in a pronounced and positive asymmetry (2.14 in 2014 and 1.99 in 2016).
Table 1: Determination of the central trend, variation and asymmetry for the main macroeconomic indicators that characterize the evolution of tourism at U.E. (2014-2016)
Source: own computations based on the data gathered from Eurostat
The analysis of the uniformity / deformity of the tourist activity at the EU level corresponds to the measurement of the concentration by country through the comparison of the structure of the number of accommodation units, catering services and the structure of the employees of the travel agencies. The numerical measurement of the concentration is achieved by determining the Corrado Gini concentration coefficient thus obtaining the following results: CGunitandaccomodation=0.32, CGservicies=0.31, CGagencies=0.33. The value of the Gini coefficient revealed a relatively uniform distribution of the indicators taken into account in the paper, so the degree of concentration is quite low. The differences from the lower limit (0.19) are not high; these differences are due to the EU countries which have a higher economic and social development (Germany, Great Britain, Spain, and so on).
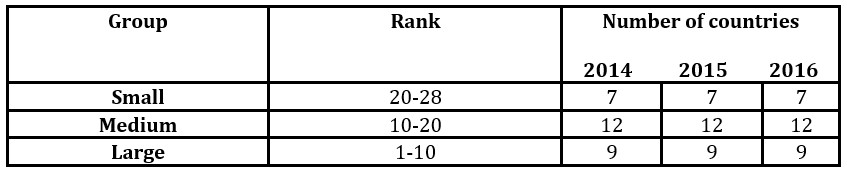
Regarding the multicriterial classification of the countries of the EU, this ranking that was made in the paper allowed the measurement of the gaps between the EU countries as well as the elaboration of some optimal development strategies. The method that was used was the ranking method that led from the book of Gujarati (2006) to the next ranking (see table 2). The large group means the countries that have maximum performance, the average group are the ones with the average performance and the small group is the countries that have minimal performance of touristic effects.
Table 2: Multicriterial ranking of EU
Source: Source: own computations based on the data gathered from Eurostat
As a paradox in the 2014-2020 periods, the ranking of the EU countries for the three indicators included in the paper remained unchanged. Although the Europe 2020 strategy has been applied at the level of the member countries, its impact is currently not very significant at the moment. By implementing the strategy, the following axes are attempted:
Boosting the competitiveness of the tourism sector in Europe;
Promoting the development of a sustainable, responsible and quality tourism;
Making the most of the EU financial policies and instruments in order to develop attractive forms of EU funding
The first places in terms of tourism activity in EU countries (the large group) are the following countries: Germany, Great Britain, Spain, Italy, France, Poland, Austria, Greece and Portugal, which have a rich touristic potential and where all the forms of tourism are practiced. At the opposite pole, we have the following EU countries in the small group such as the Netherlands, Luxembourg, Lithuania, Estonia, Cyprus, Slovenia and Finland.
Analysis of Dependencies Between Variables That Influence and Characterize the Tourism Development at The European Level
In the second stage of the statistical approach, the chosen indicators are characterized quantitatively and qualitatively by the main dependent variables mentioned above. Thus, the analysis of complex correlations and interdependence of economic and social phenomena, elementary statistical methods are often inadequate as seen in the book of Andrei and Bourbonnais (2008).
Thus, the trends in the evolution of tourism activity at European level were complemented by an analysis of the link and interdependence between the indicators that characterize the tourism activity at the level of the EU countries: the number of the employees in the tourism agencies, the catering services (of public alimentation), and the accommodation. In order to verify the existence / absence of a relationship between the above-mentioned indicators in the paper, a multiple linear regression model was used as seen in the theory of Andrei et all (2008, p. 66).
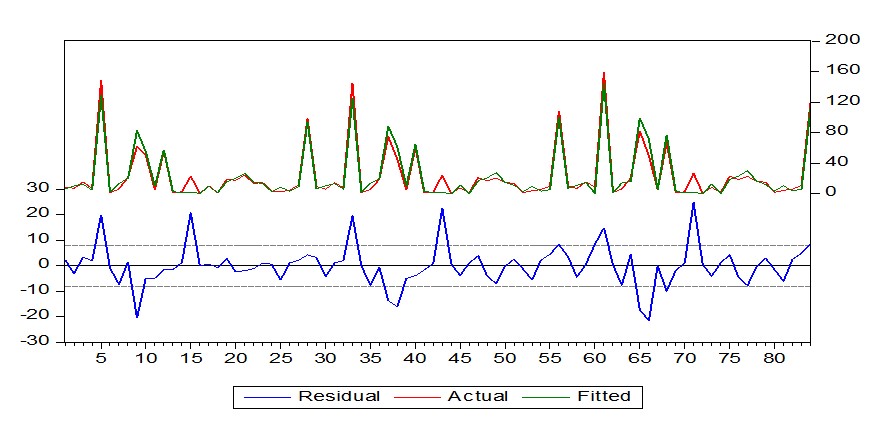
In the model, the number of employees in travel agencies was considered as a dependent variable and catering (of public alimentation) and accommodation units as independent variables. The multiple regression analysis covered the following steps as seen in the book of Stancu (2011, p. 255): the development of the regression model, the estimation of the model parameters and the verification of the accuracy of the results. From the correlation chart, it was appreciated that the points in the chart network (Figure 1) are evenly distributed without any disparities between them, therefore, it can be concluded that the link between the independent variables characterizing the tourist activity at the EU level and the number of employees in the tourism agencies as a dependent variable is linear, direct and significant.
Fig.1: Actual, Fitted, Residual Graph
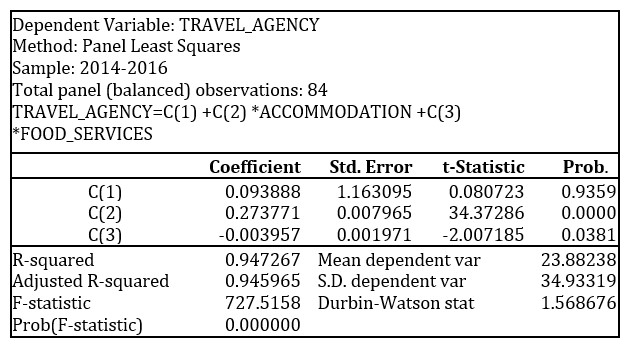
By applying a multiple linear regression model, using the EViews program, the following results of the multiple regression function using the multifactor linear regression model were obtained (see Table 3):
Table 3: The multiple correlation between the number of employees in travel agencies and the evolution of catering (of public alimentation) and accommodation units as independent variables at the European level
Source: own computations made in EViews based on the data gathered from Eurostat
By applying the known statistical tests to verify the significance of the model parameters (Student test), the significance of the OLS model and of its assumptions, it was discovered that the estimation results and the model were statistically significant for a significance level of 5% for all the independent variables included in the model.
The intensity of the link between the variables included in the multiple regression model was measured by the multi-correlation ratio, whose value is of 0.96, the link between the variables is linear, significant and direct. The coefficient of determination shows that 94% of the variation of the number of employees in the travel agencies is explained by the influence of the catering (of public alimentation) variables and the number of accommodation units, as well as the adjusted R indicator but taking into consideration the number of degrees of freedom. Verifying the veracity of the multifactor regression model and the multiple correlation ratio based on the “Fisher” criterion led to the following conclusion: since the probability of Sig. F is less than 0.05, the multifactor regression model is valid, as well as the multiple correlation ratio for a significance threshold of 0.05. In conclusion, it can be appreciated that the independent variables included in the model have a significant influence over the variance of the dependent variable (the number of employees in the travel agencies) contributing to its average annual growth.
The OLS assumptions are verified for the same level of significance, except for the autocorrelation error assumption, this is tested using the Durbin-Watson test. The DW statistics recorded a calculated value of DW = 1.56, which was compared with critical statistical values for α = 0.05, p = 2 and n = 84; d1 = 1.62 and d2 = 1.72 suggests that the errors are auto correlated positively.
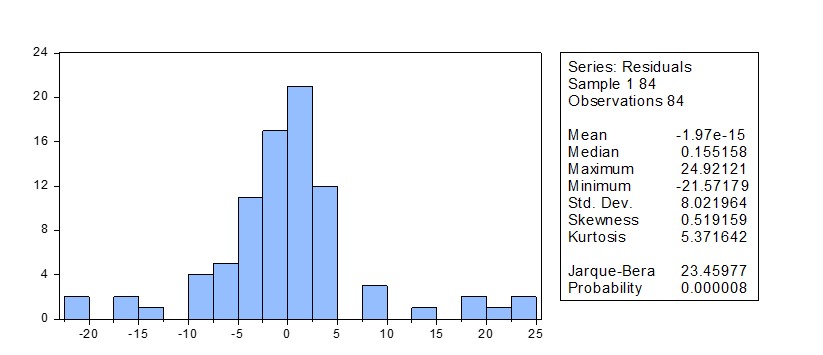
Using the EViews program to calculate the Jarque-Berra test (Figure 2), the value of the JB =23.45 >χ 2 0,005;2 =5,9915 test and of p(JB) = 0.00 was obtained, thus, assuming that the normality assumption of errors cannot be accepted.
Fig.2: Distribution of error normality
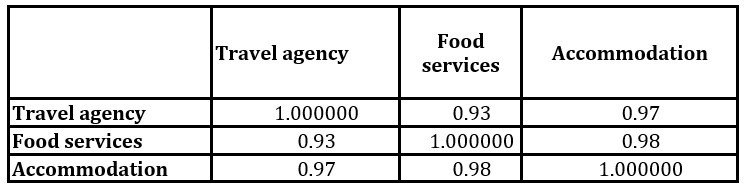
The model is affected by multicollinearity, so a further development would be to develop a simple regression models analysis (see Table 4).
Fig. 3: The correlation between the number of accommodation units and the number of employees in the travel agencies
As a result of the correlation matrix analysis, it was considered that its exemplification consists in using the simple linear regression method, based on the least squares method as seen in the book of Cristache (2009), which complements the multiple linear regression analysis exemplified earlier.
Table 4: Correlation Matrix
Source: own computations based on the data gathered from Eurostat
In this context, the theoretical linear equation (see Figure 3) was determined by the Excel program; in the case of the simple linear correlation between the number of the accommodation units and the number of employees in the travel agencies at the level of the EU countries, the equation is:
The value of the determination coefficient of 0.94 shows that 94% represents the influence of the accommodation on the number of employees in the travel agencies, the remaining 6% comes from other random factors. The regression equation and its comparison with the Gauss Laplace function illustrated in Figure 3 shows that from the analysis of the points arranged in the graphical network, it can be observed that they have a linear trend, therefore, there is a linear and significant link between the two variables. The obtained value of the slope of the regression line is 0.26 thus showing that with the increase by one thousand units of accommodation, the number of employees in the travel agencies will increase to an average of 0.26 thousand people annually.
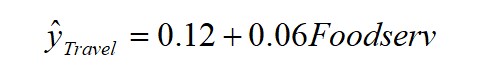
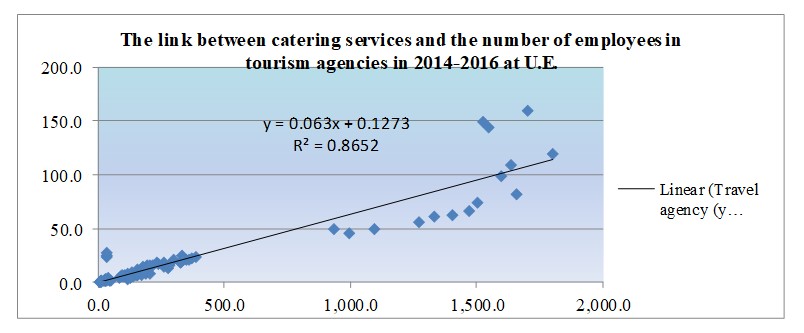
The linear theoretical equation (see Figure 4) was determined by the Excel program in the case of the simple linear correlation between the catering services and the number of employees in the travel agencies at the level of the U.E. is:
The regression equation and its comparison with the Gauss Laplace function illustrated in Figure 4 shows that from the analysis of the points arranged in the graph network, it is observed that they have a linear trend, therefore, there is a linear and significant link between the two variables.
The value of the determination coefficient of 0.86 suggests that 86% represents the influence of the catering services on the number of employees in tourism agencies, while the remaining 16% is due to other random factors, such as: net tourism investments obtained by travel agencies, the degree of liquidity of travel agencies, and so on.
Fig. 4: The correlation between the number of accommodation units and the number of employees in the travel agencies
According to the regression equation, it was concluded that the increase in catering services by one thousand, respectively by one unit of measure, will increase the number of employees in travel agencies by an average of 0.06 thousand people per year.
The intensity of the link between the variables of this model was determined in the paper by the correlation ratio (Ry/x = 0.93) which confirms that the link between the two correlated variables is linear, direct and significant.
In conclusion, we appreciated that the independent variables included in the model have a significant influence on the variance of the dependent variable (the number of employees in the travel agencies) contributing to its average annual growth.
Conclusions
The statistics regarding tourism are used to monitor not only the EU tourism policies, but also the EU regional policy and sustainable development policy.
According to Eurostat’s analysis (2017) in 2012, one of 10 companies from the non-financial sectors of the European economy belonged to the tourism sector. In these 2.2 million companies, approximately 12 million people were employed. The employees of the enterprises in tourism related sectors represented 9% of the persons employed of the total of non-financial sectors of the economy and 21.9% of the persons employed in the services sector. In addition, based on the data and analyzes made by Eurostat in 2014, it has been found that the number of nights spent (for residents and non-residents) can be analyzed in perspective by reference to the demographic dimension of each country, thus obtaining an intensity indicator of the tourism activity.
As a result of this computation, the Mediterranean destinations Malta, Cyprus and Croatia as well as the Austrian and Alpine destinations represented the preferred touristic destinations in the EU 28 from the perspective of touristic intensity.
According to the European Commission’s (2006) communication across the EU, the top five most popular destinations for non-residents in 2014 and 2015 were Spain, Italy, Germany, France and the United Kingdom, which together accounted for more than half (about 60%) of the total number of nights spent by non-residents in the EU-28. The least sought-after destinations in 2015 and 2016 were Luxembourg, Lithuania and Latvia; for the interpretation of these figures, it is necessary to consider the size of those Member States. This ranking of the European Commission has also been confirmed by the multicriterial ranking that was made in the paper. At the same time, it can be concluded that there are disparities in the tourist activity of the EU countries, due mainly to the existing economic disparities: weak infrastructure, low investment level, inadequate training and improvement of employees, limited entrepreneurial culture, and so on. These negative aspects characterize some of the EU countries, although they have significant tourism potential, such as Slovenia, Croatia, Cyprus, Romania, and so on. Through the variables analyzed in the paper, it can be considered to reflect the development and the opportunities of tourism development at the European level.Finally, although in terms of infrastructure and tourism units, the European area offers multiple possibilities, they are not yet fully exploited. In view of these possibilities, many jobs have also been created both in areas directly dependent on tourism such as travel agencies and adjacent ones. By this, the development of catering services is understood. That is why tourism brings a considerable boost to the total economy of the European space.
References
Andrei, T. and Bourbonnais, R., (2008) Econometrie, Economica Publishing House, Bucharest.
Andrei, T., Stancu, S., Iacob, A. I., et al. (2008) Introduction to econometrics using EViews, Economica Publishing House, Bucharest.
Boudon, R. and Lazarfeld, P., (1969) L’Analyse empiriques de la causalité, Mouton, Paris
Cristache, S., (2009) Introducere in econometria activitatii turistice, ASE, Bucharest.
European Comission. (2006), ‘A renewed EU Tourism Policy: Towards a stronger partnership for European Tourism’,
European Commission. (2010). ‘Communication from the Commission to the European Parliament, the Council, the European Social and Economic Committee and the Committee of the Regions’, Brussels.
(2017). Accommodation and food service statistics – NACE Rev. 2. [Online] [Retrieved from February 10, 2019], http://ec.europa.eu/eurostat/statistics-explained/index.php/Accommodation_and_food_service_statistics_-_NACE_Rev._2
Fosket, D., and Ceserani, V. (2007) The Theory of Catering, Trans-Atlantic Publication,
Gujarati, D., (2006) Essentials of Econometrics, Mc. Graw Hill, New York.
Kotler, Philip, Bowen, John T, Makens and James C. (2006) Marketing for Hospitality and Tourism , 4th edition, Pearson Education International, London.
Mattel, B. (2016) Catering – A Guide to Managing a Succesful Business Operation, 2nd Edition, John Wiley & Sons, New Jersey.
Press, E., and Lynn, J. (2012). Start Your Own Restaurant and More – Pizzeria, Coffeehouse, Deli, Bakery, Catering Business, Entrepreneur Press, Irvine.
Stanciulescu, G. (2003) Management of tourism operations, 2nd edition. All Beck, Bucharest.
Stancu, S. (2011) Econometrics – Theory and Applications Using EViews, ASE Publishing House, Bucharest.
Voineagu, V. at all (2007) Theory and econometric practice, Meteor Press Publishing House, Bucharest.
Weinberg, J. (2007) The everything guide to starting and running a Catering Business. Adams Media, Avon.
Yule, U. G. and Kendall, M. G. (1960). Introduction in Statistical theory, Griffin, London.