Vaggelis SAPRIKIS, Giorgos AVLOGIARIS, Androniki KATARACHIA and Agapi ALTINI
University of Western Macedonia, Kozani, Greece
Volume 2020,
Article ID 301245,
Communications of the IBIMA,
13 pages,
DOI: 10.5171/2020.301245
Received date: 1 October 2019; Published date: 6 May 2020
Academic Editor: Leila Othmani
Cite this Article as:
Vaggelis SAPRIKIS, Giorgos AVLOGIARIS, Androniki KATARACHIA and Agapi ALTINI (2020)," Mobile Augmented Reality Apps in Shopping Malls in Greece: Exploring Users’ Behavioral Intentions", Communications of the IBIMA, Vol. 2020 (2020), Article ID 301245, DOI: 10.5171/2020.301245
The ability of Augmented Reality (AR) to blend digital information into the physical world has enhanced its vast range of applications potential. It has, thus, increased the number of smartphone AR users and challenged researchers and a number of industries to try to understand and anticipate its impact on people’s perceptions, adoption intention and level of use. The present paper explores a specified number of underlying factors, which affect the behavioral intentions of smartphone users towards applying AR in shopping malls in Greece. The relevant theoretical constructs are combined with information in the extant literature with a view to extending the Unified Theory on Acceptance and Use of Technology (UTAUT) proposed by Venkatesh et al. in 2003. The research, based on data drawn from a sample consisting of university students, elaborates on the proposed conceptual framework and examines AR use in terms of Performance Expectancy, Effort Expectancy, Social Influence, Facilitating Conditions, Behavioral Intention, Reward and Enjoyment. It also examines the framework on the basis of the demographic characteristics of the respondents. The results enhance perceptions about the users’ perspective of AR applications and provide meaningful insights to both the academia and AR practitioners.
Augmented Reality (AR) has been among the most popular and promising subjects of scientific and technological research for the last few decades and has been gaining a considerable share especially in the mobile technology industry, in which advancements in smartphone applications and mobile networking have substantially contributed to facilitating web users’ everyday life. Augmented Reality, coined in 1992 by Thomas Caudell and David Mizell (Martínez et al., 2014), has been commonly defined as an emerging technology integrating and ‘augmenting’ the users’ real perceptions of their environment, by blending digital information into the physical and interactive real world (Höllerer & Feiner, 2004; Klopfer & Squire, 2007; Vallino, 1998, and Wellner & MacKay, 1993). In Chang et al.’s (2010) terms, it links the real and virtual world in a seamless way; in Augmented Reality, environments are enhanced with digital/ virtual information or/ and multimedia from the system (Lee, 2012) in such a way that information is perceived as real.
Despite the fact that AR has been investigated for about 30 years (Saha & Mukherjee, 2003), only recently has it been used as a popular and affordable technology worldwide, especially via smartphones, which appear to meet all requirements for AR applications (camera, fast Internet connection, GPS and digital compass (Olsson & Salo, 2011). Based on information technology (IT) innovations, AR provides users with a great variety of values and benefits (Kim & Forsythe, 2008 and McCarthy & Wright, 2004), such as ease of use and entertainment, and facilitates the decision-making purchase process (Huang & Liao, 2015). AR applications have been employed in numerous sectors of life and various industries, such as tourism, education, construction, culture, retail, marketing and gaming industry (e.g., Chung et al., 2015; He et al., 2018; Jung et al., 2015; Kang, 2014; Kourouthanassis et al., 2015; Lee, 2012; Lum, 2013, and Olsson et al., 2013), creating ground breaking and innovative customer experiences across industries (He et al., 2018). The great popularity of Augmented Reality is demonstrated in the gaming industry with ‘Pokemon Go’, which successfully introduced AR to a mass audience (Wingfield & Isaac, 2016), with one billion downloads worldwide in less than 3 years (Van Book, 2019), and enhanced perceptions about the AR technology potential. The of Augmented Reality technology in various other fields apart from the mobile telephony, such as photos/videos with digital information, is extremely popular nowadays. Thus, the AR market share is expected to reach $117.4 billion by 2022 at a compound annual growth rate of 75.72% (Forbes Agency Council, 2017). In business contexts, AR technology has received considerable attention from researchers and scholars, who focused on various aspects of AR; applications and limitations (e.g., Lee, 2012; Martínez et al., 2014, and van Krevelen & Poelman, 2010), use (e.g., Olsson & Salo, 2011), usage intention (e.g., Chung et al., 2015, and Kang, 2014) and adoption intention (Bojórquezet al., 2016; Javornik et al., 2016; Kourouthanassis et al., 2015; Rauschnabel & Ro, 2016, and Rese et al., 2014).
Based on the above considerations, and highlighting the fact that shopping malls can combine various user needs and tasks performed via AR, such as advertisements, AR-supported navigation, mobile payment services, social interaction, additional product information, etc. (Olsson et al., 2013), the present empirical study investigates smartphone users’ behavioral intentions and attitudes towards using Augmented Reality in shopping malls in Greece. The import of the specific research, which focuses mainly on young people, and in particular, university students, lies in the fact that such use has not been previously explored and, thus, the potential benefits of the specific application have not been given proper emphasis by the academia and the mobile applications industry. The proposed conceptual research framework is based on the Unified Theory on Acceptance and Use of Technology (UTAUT) developed by Venkatesh’s et al. (2003), and is tested both in the whole sample and its demographic characteristics.
The paper is organized as follows: section 2 includes a review of the relevant literature, whereas section 3 and 4 discuss the applied research methodology and the results. Finally, section 5 includes a discussion of the results and recommendations about future research.
Literature Review
The extant literature in information systems and innovative technology places great emphasis on the behavioral intention schemes applied in the number of contexts of technology adoption, such as the Theory of Reasoned Action (TRA) (Fishbein and Ajzen, 1975), the Theory of Planned Behavior (TPB) (Ajzen, 1991), the Diffusion Of Innovations (DOI) theory (Rogers, 2003), etc. Typically, however, AR adoption intention is investigated in terms of the Technology Acceptance Model (TAM) and the Unified Theory of Acceptance and Use of Technology (UTAUT).
The Technology Acceptance Model (TAM), which is the most frequently applied or extended model in AR adoption, suggests that perceived ease of use and perceived usefulness are major determinants of people’s intention to use technology (Davis, 1989). Rauschnabel & Ro (2016) emphasized the importance of functional benefits, ease of use, individual difference variables, brand attitudes and social norms in AR smart glass behavioral adoption. In addition, Haugstvedt & Krogstie (2012) highlighted the direct impact of perceived usefulness and enjoyment on mobile AR adoption for cultural heritage, and Rese et al. (2014) confirmed the positive effect of perceived ease of use, perceived usefulness and enjoyment on behavioral intention to adopt the IKEA’s AR mobile catalogue app. Finally, Huang & Liao (2014) posit that the consumers’ level of cognitive innovativeness has an impact on the sustainable relationship behavior towards using the interactive technology of AR, whereas Balog & Pribeanu (2010) stated that perceived usefulness and enjoyment significantly affect users’ behavioral intention.
The Unified Theory of Acceptance and Use of Technology (UTAUT) combines various models based on the theories discussed above with a few of their extensions in a unified concept of technology acceptance. The UTAUT model proposed by Venkatesh et al. (2003) includes five determinants: performance expectancy, effort expectancy, social influence, facilitating conditions and behavioral intention, whereas UTAUT 2 (Venkatesh et al., 2012) is enhanced with three additional variables: hedonic motivation, price value and habit. Additionally, among the various applications of UTAUT in AR research, which demonstrate its great significance and potential in terms of technology adoption, the research carried out by Shang et al. (2017) highlights the impact of performance expectancy and facilitates conditions on the adoption of a mobile AR app for historical monuments, whereas Paulo et al.’s (2018) UTAUT 2 model studies the adoption of AR in the tourism industry.
Conceptual Framework and Research Hypotheses
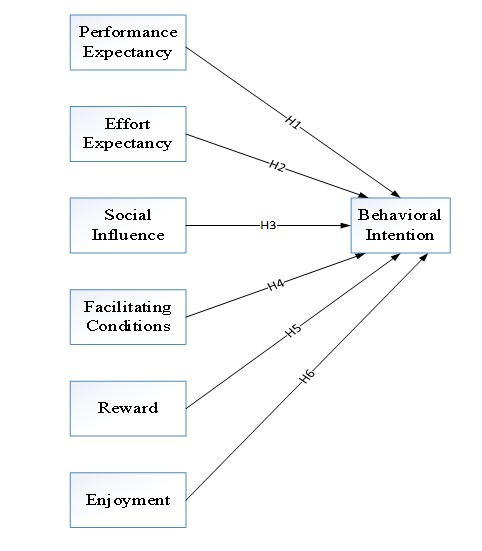
In the framework of the above considerations, the present paper aims at investigating the demographics and behavioral intentions and attitudes of users towards mobile AR applications in a shopping mall. As shopping malls are contemporary shopping, entertainment and dining/fast food areas, which attract a great number of visitors/consumers, a research in the users’ adoption intention of mobile AR apps for such purposes is considered significant. Accordingly, the results of the investigation are expected to derive valuable information. It is also worth noting that, to enable a more comprehensive approach, apart from the key UTAUT variables, the research employs two additional determinants, Reward and Enjoyment. In detail, Reward is expected to have a positive impact on mobile AR app behavioral intentions (Kim & Kim, 2004; Jang et al., 2013, and Saprikis et al., 2018), similar to Enjoyment, which is argued to positively affect behavioral intentions (Balog & Pribeanu, 2010; Haugstvedt & Krogstie, 2012; Rese et al., 2014; Saprikis et al., 2018, and Saprikis & Markos, 2018). Thus, the proposed conceptual framework involves the following six hypotheses (Figure 1):
Figure 1: Research Conceptual Framework
H1: Performance Expectancy has a positive impact on Behavioral Intention.
H2: Effort Expectancy has a positive impact on Behavioral Intention.
H3: Social Influence has a positive impact on Behavioral Intention.
H5: Reward has a positive impact on Behavioral Intention.
H6: Enjoyment has a positive impact on Behavioral Intention.
Research Methodology
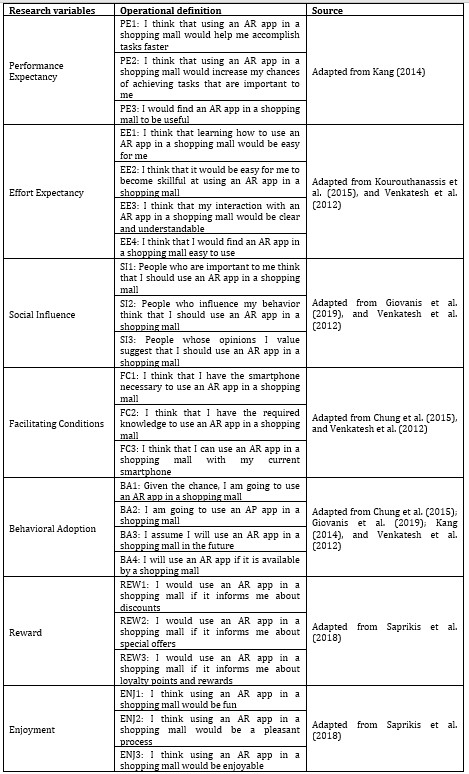
To explore the behavioral intentions of mobile users towards AR apps in shopping malls, the research employed a web-based questionnaire, which was sent to Greek university students from April to May 2019. The sample was drawn from a number of university students, as this has frequently yielded successful results in the primary research (i.e., Saprikis, 2018; Saprikis & Antoniadis, 2019, and Shead et al., 2012). To ensure validity and reliability of the measurement items, the research was based on previous research (Table 1). It is also worth noting that, prior to the specific survey, a pilot study was carried out using a sample of thirty subjects to identify any possible constraints in terms of clarity and accuracy, whereas the measurement instrument was reviewed by two academics. As a result, the respondents’ comments and feedback were valuable information for refining the measurement instrument.
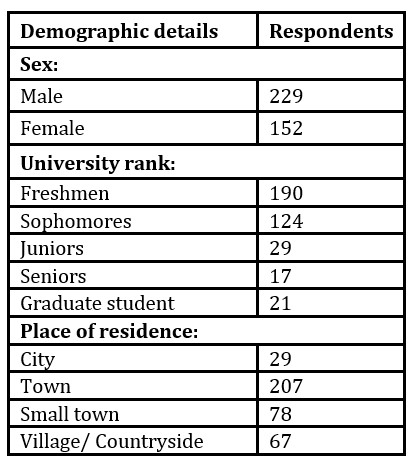
The web-based questionnaire, accompanied by a video explaining AR technology and the purpose of the study, was sent by e-mail to various university students and to Facebook closed university student groups. The corpus of data includes answers from 381 students. Incomplete answers given by thirty-two respondents were not included in the research analysis (Table 2).
To test the proposed conceptual framework (Figure 1), the data analysis was conducted in two stages. The first stage employed factor analysis using Principal Component Analysis (PCA) and orthogonal rotation (VARIMAX) to test the data validity and reliability, followed by stepwise regression analyses to examine the six hypotheses in the whole sample and its demographics.
For all the questions, except for those investigating the subjects’ demographic information (Table 2), a 5-point Likert scale was applied. In detail, to exploit the underlying theoretical dimension for each independent variable a multiple-item scale was developed. All measurement items were based on the relevant literature and previous empirical studies corroborated validity and reliability; however, they were modified to fit the research. Three items were employed to measure “Performance Expectancy”, “Social Influence”, “Facilitating Conditions”, “Reward” and “Enjoyment”, and four items to measure “Effort Expectancy” and “Behavioral Intention” (Table 1).
Table 1: Research variables: operational definition
Table 2: Demographic information
Results
Factor analysis was employed with a view to testing variable validity, classifying and reducing questions into sub-variables, and calculating factor loadings. In detail, firstly, the Principal Component Analysis (PCA) using orthogonal rotation (VARIMAX) was performed to assess the underlying data structure. The specific method is principally used to summarize the original information (variance) in a minimum number of factors for prediction purposes (Hair et al., 2006). Orthogonal extraction, by means of VARIMAX rotation, was employed to test the research objectives and reduce a large number of variables to a smaller set of uncorrelated variables. In addition, VARIMAX rotation was applied to minimize the number of variables with high factor loadings, and, thus, enhance factor interpretability (Hair et al., 2006). To test data appropriateness for factor analysis, several measures were applied to the entire population matrix. More specifically, Bartlett’s test of sphericity (p = .0) confirmed the statistical probability that the correlation matrix has significant correlations among the variables, whereas the result of Kaiser-Meyer-Olkin (KMO) measure of sampling adequacy was .921. In
addition, all values of Measure of Sampling Adequacy (MSA) exceed .50 for both the overall test and each individual variable (Hair et al., 2006). Notably, the specific measures demonstrated that factor analysis was suitable.
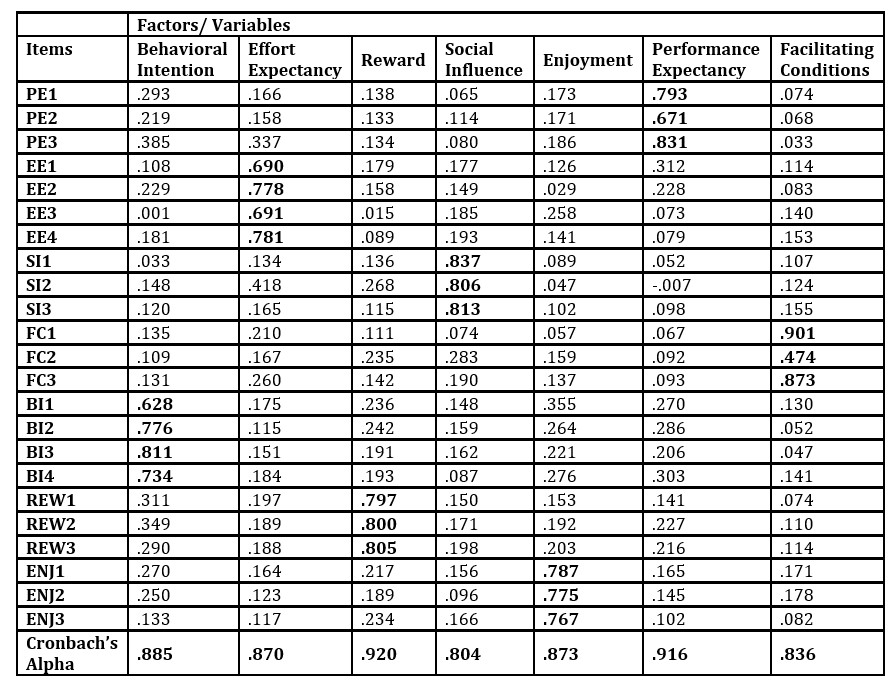
The Kaiser Eigen values criterion enabled extracting seven factors, which collectively explained 78.848% of the variance in all items, whereas all the communalities were greater than .50, ranging from 575 to .874, providing sufficient explanation of the results (Hair et al., 2006). In terms of construct validity, which demonstrates the degree to which a test measures what it claims, and proves that it fits the applied theories (Crabbe et al., 2009), two broadly applied tests were employed; convergent and discriminant validity. In terms of Hair et al. (2006), “convergent validity is demonstrated if the items load strongly (>.50) on their associated factors, whereas discriminant validity is achieved if each item loads stronger on its associated factor than on any other factor”. Table 3 below demonstrates that loadings for all items are greater than .50, except for one (FC2), and a load stronger on their associated factors than on other factors. Thus, convergent and discriminant validity are confirmed. The seven survey factors (Performance Expectancy, Effort Expectancy, Social Influence, Facilitating Conditions, Behavioral Intention, Reward and Enjoyment) are rather easy to interpret, due to their strong variable loadings. Finally, Cronbach’s alpha was applied to measure construct reliability (or internal consistency). In Table 3 below, it is demonstrated that values ranged from .804 to .920, which corroborates Hair et al.’s (2006) view, that scores greater than .70 are considered acceptable for field research.
Table 3: Rotated component matrix
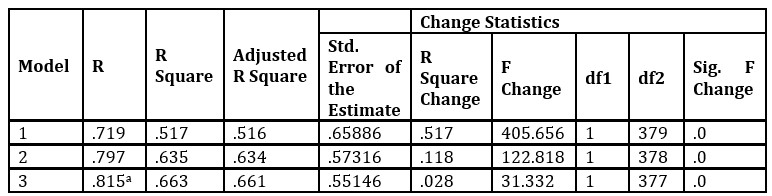
A stepwise regression analysis, which is considered the most popular sequential approach to variable selection (Hair et al., 2006), was employed to assess the best predictors of the independent variables expected to affect AR behavioral intentions and indicate which of the six hypotheses were acceptable. The results (Table 4) demonstrate that 81.5% of the variance in AR behavioral intention is explained by three predictors. Enjoyment possesses the highest explanatory value; 51.7% (b = .385, t = 9.838, p = .0), followed by Performance Expectancy 11.8% (b = 0.4, t = 10.165, p = .0) and Reward 2.8% (b = .21, t = 5.598, p = .0). Accordingly, three of the six research hypotheses are supported.
Table 4: Stepwise regression analysis: results
a Predictors: (constant), Enjoyment, Performance Expectancy, Reward
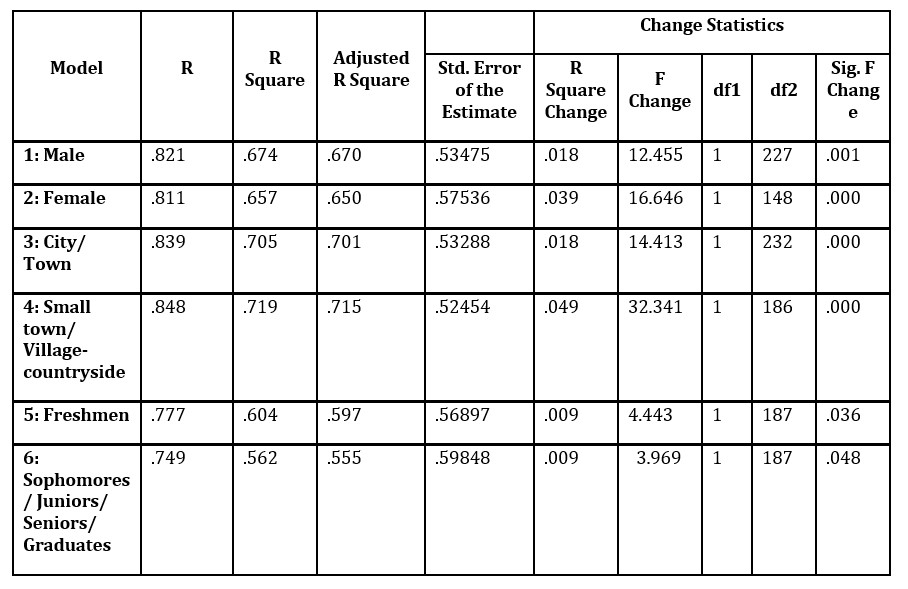
In addition, six, separate, stepwise regression analyses were applied to assess the best predictors among the proposed conceptual framework independent variables believed to have an impact on mobile AR app behavioral intention. More specifically, these six analyses were applied to examine each of the three demographic characteristics of the sample. Therefore, two regression analyses investigated the respondents’ gender (a. male and b. female), two regression analyses investigated their place of residence (a. city/ town and b. small town/ village-countryside), and two regression analyses examined their university rank (a. freshmen and b. sophomores/ juniors/ seniors/ graduate students). The decision was made to group city and town responses together, similar to small town and village-countryside responses in order to reveal possible differences based on the number of inhabitants. Following the same procedure, freshmen were analyzed separately from the rest of the sample because they might reveal differences, as this is their first year in a new and completely different educational environment. The results of the six regression analyses are as follows (Table 5).
Table 5: Results of the six stepwise regression analyses for students’ demographics
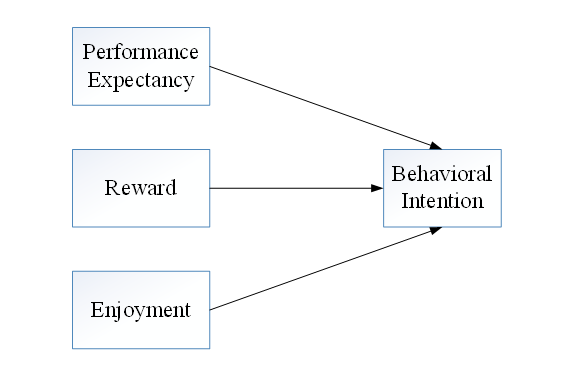
The present research explores the behavioral intentions of smartphone users towards using AR applications in shopping malls in Greece, which has not been previously researched. Notably, the paper comprises the first part of an ongoing research, aiming to illustrate mobile AR adoption in shopping malls. Three of the six research hypotheses of the proposed conceptual framework were supported. Figure 2 below demonstrates the final framework with the confirmed hypotheses.
Figure 2: Final Framework
Overall, the effect of Enjoyment was proved as the most critical factor and demonstrated the great significance of joy and pleasure in applying AR applications. The research subjects claimed that AR apps could be mainly used for amusement, which was rather expectable, considering that the respondents were university students, who commonly use smartphones mostly for enjoyment. The specific result is significant for shopping malls, which should carefully consider enjoyment as a major factor to design and develop mobile AR apps since such applications derive happy emotions and are more likely to be used in shopping malls. In terms of Enjoyment, the research results demonstrated that Performance Expectancy was also significant, as users perceive that AR applications would help them decide faster about purchases. More specifically, among the major benefits of AR is to offer users additional information, such as product details, comparison of prices, customers and influencers’ reviews, advertisements, mobile payment processes, guidelines and advice, etc. The specific information is considered significant and has a great impact on the consumers’ purchase attitudes. Finally, the results also revealed Reward as a substantial factor, as special offers, discounts and loyalty points are crucial to using such applications and people tend to use them when they are challenged. Overall, to encourage users to embrace interactive technology, AR developers should focus on providing substantial incentives (Haller et al., 2007; Rogers, 2003) and highlight the unique benefits offered by technology (Chiou & Shen, 2012).
Concerning the investigation of the proposed framework based on the respondents’ demographics, all the regression analyses reveal that the three afore-mentioned factors, Enjoyment, Performance Expectancy and Reward, have an impact on behavioral intention with the same declining significance order. However, there was an exception regarding students ranked in the second or higher academic year (Table 5 – Model 6). This group of respondents stated that Performance Expectancy is slightly more important to them compared to Enjoyment. Thus, it can be concluded that they mostly intend to adopt a mobile AR app in shopping malls to be able to accomplish their duties and goals more quickly rather than for fun or pleasure. This is a vital observation, which has to be further investigated in the ongoing AR study.
Despite the meaningful implications of the research results about AR users’ behavioral intentions, further research focused on a number of other variables suggested in the relevant literature, such as security, innovativeness or/ and trust beyond any limitations of the conceptual frameworks will allow valuable additional conclusions to be drawn. These will enable a more thorough and comprehensive approach to Augmented Reality by means of applying advanced data analysis methods (i.e. Structural Equation Modeling (SEM)), and will offer an even more solid conceptual framework including the relationships between the examined variables. Further evidence from heterogeneous samples is also required to ensure that the observed relationships are similar in terms of gender, education or age, thus, corroborating the reasons why the variables Effort Expectancy, Social Influence and Facilitating Conditions were not supported. It is also worth noting the limitations of the specific findings, as the sampling includes only Greek users. Thus, with a view to providing comparative data to the benefit of the industry of mobile AR applications, similar cross-cultural studies on sampling from various countries should be carried out, focusing on the respondents’ different cultural aspects.
Acknowledgment
The project has been funded by the Research Committee of the University of Western Macedonia, Greece
Ajzen, I. (1991) ‘Theory of planned behavior,’ Organizational Behavior and Human Decision Processes, 50 (2), 179–211.
Balog, A., andPribeanu, C. (2010) ‘The role of perceived enjoyment in the student’s acceptance of an augmented reality teaching platform: A structural equation modelling approach,’ Studies in Informatics and Control, 19 (3), 319-330.
Bojórquez, M. E., Villegas, V. O. O., Sánchez, C. V. G., García-Alcaraz, L. J., and Vara, F. J. (2016) ‘Study on mobile augmented reality adoption for Mayo language learning. Mobile Information Systems,’ Hindawi Publishing Corporation, Article ID 1069581.
Chang, G., Morreale, P., and Medicherla, P. (2010) ‘Applications of augmented reality systems in education,’ In D. Gibson & B. Dodge (Eds.), Proceedings of Society for Information Technology & Teacher Education International Conference 2010, 1380-1385. Chesapeake, VA: AACE.
Chiou, J. S., and Shen, C. C. (2012) ‘The Antecedents of online financial service adoption: The impact of physical banking services on internet banking acceptance,’ Behaviour & Information Technology, 31(9), 859–871.
Chung, N., Han, H., and Joun, Y. (2015) ‘Tourists’ intention to visit a destination: The role of augmented reality (AR) application for a heritage site,’ Computers in Human Behavior, 50, 588-599.
Davis, D. (1989) ‘Perceived usefulness, perceived ease of use and user acceptance of information technology,’ MIS Quarterly, 13 (3), 319-340.
Fishbein, M., and Ajzen, I. (1975) Belief, Attitude, Intention and Behavior: An Introduction to Theory and Research,Addison-Wesley, MA, USA.
Forbes Agency Council (2017) ‘11 creative uses of augmented reality in marketing and advertising’. [Online], [Retrieved July 31, 2017], https://www.forbes.com/sites/forbesagencycouncil/2017/06/13/11-creative-uses-of-augmented-reality-in-marketing-and-advertising/#72488fb86b12.
Giovanis, A., Athanasopoulou, P., Assimakopoulos, C., and Sarmaniotis, C. (2019) ‘Adoption of mobile banking services: A comparative analysis of four competing theoretical models,’ International Journal of Bank Marketing, 37 (5), 1165-1189.
Hair, J., Black, W., Babin, B., Anderson, R. and Tatham, R. (2006) Multivariate Data Analysis (6th Edition), Pearson Prentice Hall, New Jersey, USA.
Haller, M., Billinghurst, M., and Thomas, B. (2007) Emerging technologies of augmented reality: Interfaces and design, Idea Group Pub, Hershey.
Haugstvedt, A.-C., and Krogstie, J. (2012) ‘Mobile augmented reality for cultural heritage: A technology acceptance study,’ IEEE International Symposium on Mixed and Augmented Reality, 5-8 November, Atlanta, Georgia, USA.
He, Z., Wu, L., and Li, X. (2018) ‘When art meets tech: The role of augmented reality in enhancing museum experiences and purchase intentions,’ Tourism Management, 68, 127-139.
Höllerer, T., and Feiner, S. (2004) ‘Mobile augmented reality,’ In Karimi H. & Hammad A. (eds) Telegeoinformatics: Location-Based Computing and Services, Taylor & Francis Books Ltd.
Huang, T.-L., and Liao, S. (2015) ‘A model of acceptance of augmented-reality interactive technology: the moderating role of cognitive innovativeness,’ Electronic Commerce Research, 15, 269-295.
Jang, , Ko, I., and Kim, J. (2013) ‘The effect of group-buy social commerce and coupon on satisfaction and continuance intention,’ In 46th Hawaii International Conference on System Sciences, Hawaii, USA, 2938-2948.
Javornik, A., Rogers, Y., Moutinho, A. M., and Freeman, R. (2016) ‘Revealing the shopper experience of using a ‘magic mirror’ augmented reality make-up application,’ ACM Conference on Designing Interactive Systems, 4-8 June, Brisbane, Australia.
Jung, T., Chung, N., and Leue, M. C. (2015) ‘The determinants of recommendations to use augmented reality technologies: The case of a Korean theme park,’ Tourism Management, 49, 75-86.
Kang, M. J.-Y. (2014) ‘Augmented reality and motion capture apparel e-shopping values and usage intention,’ International Journal of Clothing Science and Technology, 26 (6), 486-499.
Kim, J., and Forsythe, S. (2008) ‘Adoption of virtual try-on technology for online apparel shopping,’ Journal of Interactive Marketing, 22 (2), 45–59.
Kim,-Y., and Kim,Y.-K.(2004) ‘Predicting online purchase intention for clothing products,’ European Journal of Marketing, 38 (7), 883–897.
Klopfer, E., and Squire, K. (2007) ‘Environmental detectives – the development of an augmented reality platform for environmental simulations,’ Educational Technology Research and Development, 56 (2), 203–228.
Kourouthanassis, P., Boletsis, C., and Bardaki, C. (2015) ‘Tourists responses to mobile augmented reality travel guides: The role of emotions on adoption behavior,’ Pervasive and Mobile Computing, 18, 71-87.
Lee, K. (2012) ‘Augmented reality in education and training,’ TechTrends, 56 (2), 13-21.
Lum, R. (2013, January 11) ‘Unilever Uses Augmented Reality (AR) To Spread Digital Romance’. [Online], [Retrieved March 7, 2014], http://www.creativeguerrillamarketing.com/au gmented-reality/unilever-uses-augmentedreality-ar-to-spread-digital-romance.
Martínez, H., Skournetou, D., Hyppölä, J., Laukkanen, S., and Heikkilä, A. (2014) ‘Drivers and bottlenecks in the adoption of augmented reality applications,’ Journal of Multimedia Theory and Application, 1, 27-44.
McCarthy, J., and Wright, P. (2004) Technology as experience, The MIT Press, Cambridge, MA.
Olsson, T., and Salo, M. (2011) ‘Online user survey on current mobile augmented reality applications,’ IEEE International Symposium on Mixed and Augmented Reality, 26-29 October, Basel, Switzerland, 73-84.
Olsson, T., Lagerstam, E.,Kärkkäinen, T., and Väänänen-Vainio-Mattila, K.(2013) ‘Expected user experience of mobile augmented reality services: A user study in the context of shopping centres,’ Personal and Ubiquitous Computing, 17 (2), 287–304.
Paulo, M. M., Rita, P., Oliveira, T., and Moro, S. (2018) ‘Understanding mobile augmented reality adoption in a consumer context,’ Journal of Hospitality and Tourism Technology, 9 (2), 142-157.
Rauschnabel, A. P., and Ro, K Y. (2016) ‘Augmented reality smart glasses: An investigation of technology acceptance drivers,’ International Journal of Technology Marketing, 11 (2), 123-148.
Rese, A., Schreiber, S., and Baier, D. (2014) ‘Technology acceptance modeling of augmented reality at the point of sale: Can surveys be replaced by an analysis of online reviews?,’ Journal of Retailing and Consumer Services, 21, 869-876.
Rogers, E. M. (2003) Diffusion of innovations (5th Edition), Free Press, New York.
Saha, D., and Mukherjee, A. (2003) ‘Pervasive computing: a paradigm for the 21st century,’ Computer, 36 (3), 25–31.
Saprikis, V. (2018) ‘Examining Behavioral Intention Towards Social Commerce: An Empirical Investigation in University Students,’ Proceedings of the 32nd IBIMA Conference, November 15-16, Seville, Spain, 831-843.
Saprikis, V. and Antoniadis, I. (2019) ‘An Empirical Investigation on University Students’ Perceptions toward Contactless Card Adption and Use for Financial Transactions,’ Proceedings of the 33nd IBIMA Conference, April 10-11, Granada, Spain, 1425-1437.
Saprikis, V., and Markos, A. (2018) ‘Modeling users’ acceptance of social commerce,’ International Journal of E-Business Research, 14 (4), 28-50.
Saprikis, V., Markos, A., Zarmpou, T., and Vlachopoulou, M. (2018) ‘Mobile shopping consumers’ behavior: An exploratory study,’ Journal of Theoretical and Applied Electronic Commerce Research, 13 (1), 71-90.
Shang, W. L., Siang, G. T., Zakaria, M. F., and Emran, H. M. (2017) ‘Mobile augmented reality applications for heritage preservation in UNESCO world heritage sites through adopting the UTAUT model’, 1830, 030003, https://doi.org/10.1063/1.4980928.
Shead, W., Derevensky, J., Fong, T., and Gupta, R. (2012) ‘Characteristics of internet gamblers among a sample of students at a large, public university in Southwestern United States,’ Journal of College Student Development, 53 (1), 133-148.
Vallino, J. (1998) Interactive augmented reality, Ph.D. Dissertation, University of Rochester.
Van Boom, D. (2019) ‘Pokemon Go has crossed 1 billion in downloads’. [Online], [Retrieved September 12, 2019], https://www.cnet.com/news/pokemon-go-has-crossed-1-billion-in-downloads.
Van Krevelen, D. W. F., andPoelman, R. (2010) ‘A survey of augmented reality technologies, applications and limitations,’ The International Journal of Virtual Reality, 9 (2), 1-20.
Venkatesh, V., Morris, M.G., Davis, G. B., and Davis, F. D. (2003) ‘User acceptance of information technology: toward a unified view,’ MIS Quarterly, 27 (3), 425-478.
Venkatesh, V., Thong, J. Y. L., and Xu, X.(2012) ‘Consumer acceptance and use of information: extending the unified theory of acceptance and use of technology,’ MIS Quarterly, 36 (1), 157-178.
Wellner, P., and Mackay, R. W. (1993) ‘Gold. Back to the real world,’ Communications of the ACM, 36 (7), 24–26.
Wingfield, N., and Isaac, M. (2016, July 11) ‘Google and Facebook take aim at fake news sites’. [Online], The New York Times, [Retrieved September 9, 2019] https://www.nytimes.com/2016/07/12/technology/pokemon-go-brings-augmented-reality-to-a-mass-audience.html?_r=1.