The aim of this paper is to illustrate how statistical tools can benefit healthcare policy makers specialised in the rabies management. Understanding the prevalence of such a disease is crucial for management teams. Seasonality may be a salient feature of data series provided by medical units, that is why the use of an innovative tool for seasonal adjustment is needed. For this paper, the data series (number of persons examined for rabies, by age and residency) were provided by one single health care unit – TheNational Institute of Infectious Diseases “Matei Bals”. Methodologically, the graphs of both series were analyzed in order to indicate the type of transformation needed: seasonality test and outlier detection. When seasonality is detected, the data series were seasonally adjusted using JDemetra+ 2.2.2, a software recommended by Eurostat, which incorporates TRAMO-SEATS and X13 procedure specifications. Following the Hungarian Central Statistics Office’s guidelines (2007), if the seasonal variation is not changing along with the trend, then no transformation is needed; however, if the seasonal variation is changing along with the trend, a log-transformation is necessary. The results of the analysis show that all the series display clear seasonal patterns and that should be log-transformed prior to seasonal adjustment. The only series that displayed outliers is the number of persons examined for rabies from Bucharest. JDemetra+ offers not only seasonality tests and an automatic procedure for seasonal adjustment, but also a very useful tool for policy makers; the outlier detection tool, which could be used to evaluate different policies in time.
In the last 30 years, due to the technological progress, the focus of development has been concentrated on the development of innovative tools for public health (Bos, L. and Blobel, B., 2007; Friede, A. et al. 1995; Baker, E. L. et al. 1995; Khan, A. S. et al. 2010). For this reason, investments in statistical tools for public health have also appeared, these being done by researches organizations or state governments (Lauren, N. Carroll et al. 2014; Driedger, S. M. et al. 2007; Kothari, A. et al. 2008; Robertson, C. and Nelson, T. A., 2010). One of the most widespread research topics has been in the surveillance and management of infectious diseases, mostly on pandemic risk cases (Hills, R. A. et al. 2008; Reis, B. et al. 2007; Chen, H. et al. 2010). One of the most important tools is to view the map or network through which an infection can be transmitted. In the 19th century, John Snow made the first map of London with cholera cases, but nowadays this task is carried out by the computer science, according to Koch, T. and Denike, K., and Chen, H. et al. (2010). One such example is the dashboard created by John Hopkins University (2020). The usefulness of these technologies is also suggested by the significant increase in the last years on all PubMed articles of terms such as “GIS” (Geographic Information System) or “social network analysis” (Lauren, N. Carroll, et al. 2014). In general, data are used to identify diseases clusters, how diseases spread and predict the other outbreaks (AvRuskin, G. A. et al. 2004; Castronovo, D. A. et al. 2009; Dominkovics, P. et al. 2011).
With the diversification of data, intelligent management is also needed. It raises the issue of integrating data from several sources, for example about mortality, clinical data (what vaccines a population has, their health status, etc.), geographic status, relationships (name of the family, name of students in a school, friends etc.), travel plans, etc. (Gao, S. et al. 2008; Basta, N. E. et al. 2009; Polgreen, P. M. et al. 2010; O’Carroll, P. W. et al. 1998). Another important aspect is the legality of obtaining and processing this data (Lauren, N. Carroll, et al. 2014).
According to the World Health Organization (2020), a death caused by the infection with rabies virus, transmitted in 99% of the cases by dog bite, occurs every 9 minutes, going up to more than 59,000 deaths annually (an estimation subjected to underreporting and uncertainty), and with 40% of the victims being children bellow the age of 15, predominantly in rural areas. The same organization claims that rabies is 100% preventable, if at least 70% of the dogs in a region are vaccinated against the virus, the transmission cycle is broken. Hampson, et al. (2015) provided valuable insights, that due to national markets inefficiencies in promoting canine vaccination and post-exposure prophylaxis, they provided an estimation on the worldwide economic burden of contracting and treatment of rabies, incurring a direct loss of productivity, and death by rabies infection to 8.6 billion dollars, at 95% confidence interval: 2.9-21.5 billion dollars. This argument contradicts the 100% rabies preventability claimed by WHO. The same authors point out that the most affected regions are those subjected to extreme poverty, like those in rural India, which account for nearly 35% of the global death toll. A 2017-2018 study (Sreenivasan, et al. 2019) across 23 Asian and African poorest countries which account for more than 90% of deaths by rabies infection, identified the main factors affecting the access to post-exposure prophylaxis, from which this paper enumerates: limited availability of post-exposure prophylaxis at lower administrative levels; patients are required to pay for it; and the fact that although the medical procedures are theoretically free, there is a lack of funds for a state-level prevention strategy for rabies infections and the lack of effective monitoring tools of potentially infected patients. To enhance the national initiatives, WHO with the Food and Agriculture Organization and the World Organization for Animal Health made a commitment in 2015 to globally eradicate dog-mediated human rabies (2015). This initiative, along with all other public policies targeted at rabies prevention, makes use of the statistical tools ranging from simple descriptive statistics, like those used by WHO (2020), to raise the awareness among the public and for setting the public policy agenda, to more sophisticated instruments, such as decision trees (Anothaisintawee, et al. 2018) or simulation models, providing a more robust decision support in selecting the optimal intervention route (Rattanavipapong, 2018). Based on these arguments, this paper proposes a novel statistical approach in the statistical treatment of data pertaining to this subject-matter.
Broadly, the aim of this paper is to illustrate how statistical tools can benefit healthcare policy makers specialised in the rabies management. Managing such a disease means ensuring enough personnel, equipment and spaces dedicated to the treatment as well as current supplies. In this respect, it is crucial for management teams of medical facilities to understand the patterns of the prevalence of such a disease. A critical component in understanding the patterns in a data series with a frequency less than a year is exploring seasonality (Mirica, et. al. 2019). Seasonally adjusted data are used in order to calculate growth rates between consecutive sub-periods of a year; therefore, choosing the suitable techniques and tools for this process is extremely important (Mirica, et al. 2016). In this respect, the specific objective of this paper is to analyse whether or not the number of persons examined for rabies present a seasonal component and if seasonality is indeed present, to demonstrate the use of an innovative, easy to use tool for seasonal adjustment.
Methodology
For the purpose of this paper, data on the number of persons examined for rabies at the National Institute of Infectious Diseases “Matei Bals” – Centre against rabies will be used. One should note that Toma and Mirica (2018) pointed out that the lower the aggregation level, the more statistically relevant it is. In this respect, analysing seasonal patterns in the number of persons examined for rabies should be performed for data at health care units. The dataset can be found at https://www.mateibals.ro/index.php/component/content/category/13-antirabic-statistici?layout=blog (accessed February 3, 2020) and contains the total number of persons examined for rabies, as well as by age (children and adults) and residency (Bucharest or not) from January 2015 to May 2019.
In order to seasonally adjust these series, the methodology proposed by Andrei, et. al. (2019) will be used. The graph of each series will be analysed in order to have some insights with regard to the appropriate type of transformation. Seasonality tests and outlier detection techniques will be performed for each series; in case seasonality is present, each series will be seasonally adjusted using TRAMO-SEATS and X13 procedure. In order to apply this methodology as efficiently as possible, JDemetra+ 2.2.2, a software officially recommended by Eurostat, will be used as it incorporates several seasonality tests, an outlier detection tool, a calendar tool as well as predefined specifications for both X13 and TRAMO_SEATS (Grudkowska, 2015). Moreover, JDemetra+ provides an automatic procedure for choosing the ARIMA model as well as other specifications of the seasonal adjustment model (Grudkowska, 2015). The appropriate transformation for the time series will be decided based on the guidelines of the Hungarian Central Statistical Office (2007) as follows: if the seasonal variation is not changing along with the trend, then no transformation will be applied; however, if the seasonal variation is changing along with the trend, a log-transformation will be performed. If the automatic procedure will select a different transformation compared to the decision taken based on the graphical inspection, the respective time series will be seasonally adjusted manually. With regard to seasonality tests, both for the initial series as well as for the residuals, all the tests available in JDemetra+ will be considered. However, when conflicting results occur, the autocorrelation at seasonal lags will be used (Mirica, et al. 2016). Considering the time series length, each series will be tested as it is, as well as for the last 3 years (as suggested by UNECE (2012) to be the minimum length). In order to choose from TRAMO-SEATS and X-13 as well as from different series spans, the AIC will be used (as suggested by Andrei, et al. 2019). Moreover, a similar template will be used for reporting the results (as suggested by Andrei, et al. 2019).
Results
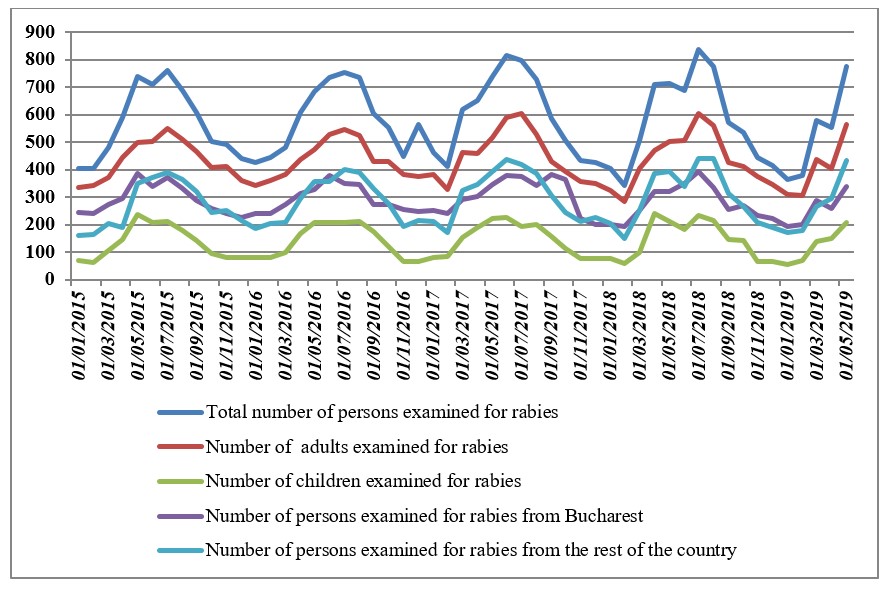
Figure 1 displays the evolution of the total number of persons examined for rabies by age and area of residency. As one can observe, all the series display clear seasonal patterns. Also, one can observe that all the series present a relatively constant trend with small changes in the magnitudes of the seasonal variations. Therefore, all the series should be log-transformed prior seasonal adjustment.
Figure 1: Total number of persons examined for rabies, by age and area of residency at the National Institute of Infectious Diseases “Matei Bals” – Centre against rabies
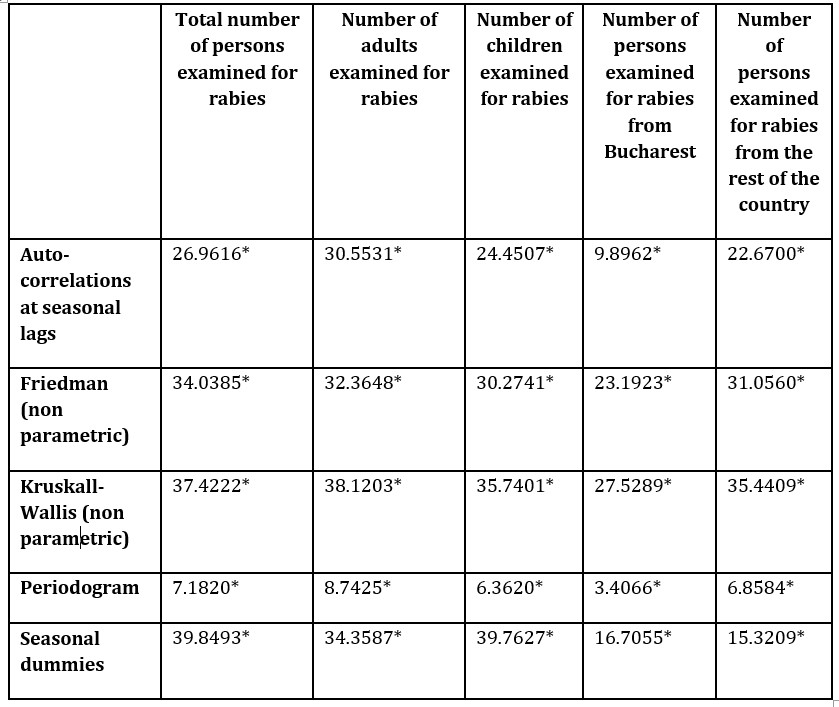
Table 1 presents the results of the seasonality tests applied to the selected time series. As one can observe, all the tests showed significant results at 5% threshold. Therefore, there is clear evidence that seasonality is present within all the time series.
Table 1: Results of the seasonality tests (values), source: designed by the authors
*P-Value lower than 5%
Next, all the series were analysed using the outlier detection tool in JDemetra+. The only series that displayed outliers is the number of persons examined for rabies from Bucharest. Thus, the tool detected a transitory change outlier in September 2017 (381 persons), a level shift outlier in November 2017 (222 persons) and another level shift outlier in April 2018). This outlier in September 2017 could be explained that, in the long run, the series returned to its usual level, even if in the short, starting October 2017 and culminating in November 2017, a sharp decrease can be observed. The return of the series to its original level prior August 2017 happened following the second level shift outlier.
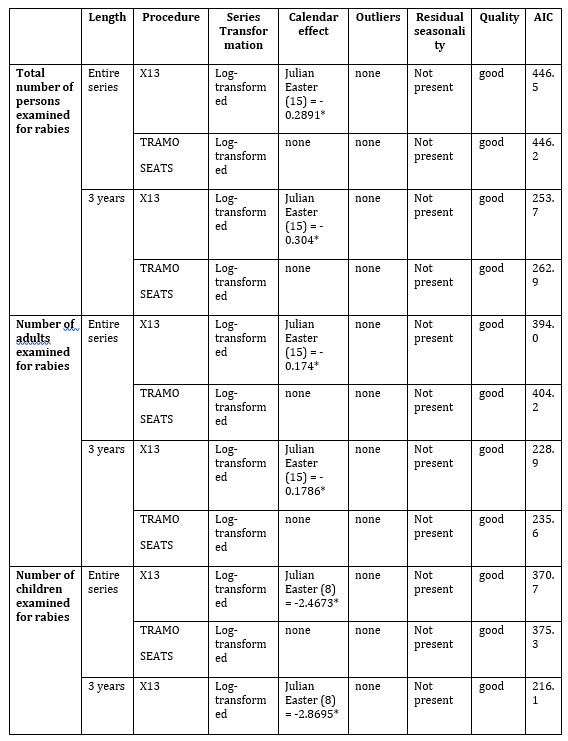
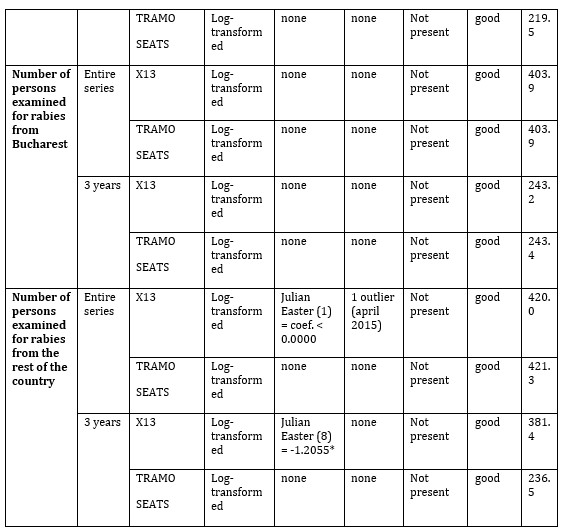
Table 2 presents the results of the automatic procedure implemented in JDemetra+ 2.2.2 for TRAMO-SEATS and X13 used in order to seasonally adjust the five series. As one can observe, for the total number of persons examined for rabies, the number of adults examined for rabies, the number of children examined for rabies and the number of persons examined for rabies from Bucharest, the lowest AIC was obtained using X13 on a three years length. In the case of the number of persons examined for rabies from the rest of the country, the lowest AIC was obtained using TRAMO-SEATS on a three years length. Moreover, one can observe a negative Easter Effect in the case of the first three series. This means that the total number of persons, adults and children may decrease before Easter.
Table 2: Results of the seasonal adjustment process of the entire series
*P-Value lower than 5%
source: designed by the authors
Conclusions
This study was based on researching the effect of using an easy to use and innovative tool for seasonal adjustments on the seasonal component of people examined for rabies. This research contributes to the existing literature illustrating how statistical tools can benefit healthcare policy makers specialised in the rabies management in two ways: firstly, to our knowledge, as the National Institute of Infectious Diseases “Matei Bals” – Centre against rabies is the only entity that publicly discloses monthly data on examinations of rabies in Romania, permitting an analysis at the lowest aggregation level possible of a healthcare unit; and secondly, the paper proposes the use of JDemetra+, an open source software, easy to use for non-statisticians. The seasonally adjusted data can be used by decision makers to compare between consecutive months within a year so that they can better allocate resources.
In order to seasonally adjust data regarding the rabies examinations, one should be careful when choosing the series span, the series transformation as well as the procedure. With regard to the series span, the best results were obtained with 3 years series. The automatic procedure implemented in JDemetra+ chooses whether or not the series should be log-transformed. However, the user should endorse the choice based on a graphical examination. Finally, the X13 procedure proved to be the best option when choosing the procedure.
Beside the seasonality tests and the automatic procedure for seasonal adjustment, JDemetra+ offers a very useful tool for policy makers; the outlier detection tool. This tool can be used to identify abnormal values within the time series (whether very low or very high) and hence evaluate different policies in time.
Anothaisintawee, T., Genuino, A. J., Thavorncharoensap, M., Youngkong, S., Rattanavipapong, W., Meeyai, A. and Chaikledkaew, U. (2019). Cost-effectiveness modelling studies of all preventive measures against rabies: A systematic review. Vaccine, 37, A146-A153. [Online], [Retrieved February 18, 2020], https://www.sciencedirect.com/science/article/pii/S0264410X18316347.
AvRuskin, G.A. et al. (2004). Visualization and exploratory analysis of epidemiologic data using a novel space time information system. International Journal Health Geographics. 3 (1). [Online], [Retrieved February 4, 2020], https://link.springer.com/article/10.1186/1476-072X-3-26.
Baker, E.L. et al. (1995). CDC’s Information Network for Public Health Officials (INPHO): a framework for integrated public health information and practice. Journal of Public Health Management and Practice. 1 (1), 43–7, DOI: 1097/00124784-199500110-00009.
Basta, N.E et al. (2009). Strategies for pandemic and seasonal influenza vaccination of schoolchildren in the United States. American Journal of Epidemiology. 170 (6), 679–686, DOI: 1093/aje/kwp237.
Bos, L. and Blobel, B. (2007). Semantic interoperability between clinical and public health information systems for improving public health services. Med Care Compunetics Four. 4.
Castronovo, D.A., Chui, K.K.H. and Naumova, E.N. (2009). Dynamic maps: a visual-analytic methodology for exploring spatio-temporal disease patterns. Environmental Health. 8. [Online], [Retrieved February 4, 2020], https://ehjournal.biomedcentral.com/articles/10.1186/1476-069X-8-61.
Chen, H., Zeng, D. and Yan, P. (2010). Data visualization, information dissemination, and alerting. In: Infectious disease informatics. Springer. 73–87.
Dominkovics, P. et al. (2011). Development of spatial density maps based on geoprocessing web services: application to tuberculosis incidence in Barcelona, Spain. International Journal of Health Geographics. 10. [Online], [Retrieved February 4, 2020], https://ij-healthgeographics.biomedcentral.com/articles/10.1186/1476-072X-10-62.
Driedger, S.M. et al. (2007). Correction: using participatory design to develop (public) health decision support systems through GIS. International Journal of Health Geographics. 6. [Online], [Retrieved February 4, 2020], https://link.springer.com/article/10.1186/1476-072X-6-53.
Friede, A. Blum, H.L. and McDonald, M. (1995). Public health informatics: how informationage technology can strengthen public health. Annual Review of Public Health. 16 (1), 239–252.
Gao, S. et al. (2008). Online GIS services for mapping and sharing disease information. International Journal of Health Geographics. 7. [Online], [Retrieved February 4, 2020], https://link.springer.com/article/10.1186/1476-072X-7-8.
Hampson, K., Coudeville, L., Lembo, T., Sambo, M., Kieffer, A., Attlan, M. and Costa, P. (2015). Estimating the global burden of endemic canine rabies. PLoS neglected tropical diseases, 9 (4). [, https://www.ncbi.nlm.nih.gov/pmc/articles/PMC4400070/.
Hills, R.A., Lober, W.B. and Painter, I.S. (2008). Biosurveillance, case reporting, and decision support: public health interactions with a health information exchange. Biosurveillance and biosecurity. Springer. 10–21.
Hungarian Central Statistical Office. (2007). Seasonal Adjustment Methods and Practices. [Online], [Retrieved February 4, 2020], https://www.ksh.hu/docs/files/527167.PDF.
Khan, A.S. et al. (2007). The next public health revolution: public health information fusion and social networks. American Journal of Public Health. 100 (7), 237–242.
Koch, T. and Denike, K. (2009). Crediting his critics’ concerns: Remaking John Snow’s map of Broad Street cholera, 1854. Social Science and Medicine. 69 (8), 1246–1251.
Lauren, N.C. and al. (2014). Visualization and analytics tools for infectious disease epidemiology: a systematic review. Journal of Biomedical Informatics. 51, 287-298. [Online], [Retrieved February 4, 2020].
MIRICĂ, A., Andrei, T., Dascălu, E. D., MINCU RĂDULESCU, G. I. and GLĂVAN, I. R. (2016). Revision Policy of Seasonally Adjusted Series – Case Study on Romanian Quarterly GDP. Economic Computation & Economic Cybernetics Studies & Research, 50 (3).
MIRICĂ, A., GLĂVAN, R. I., TOMA, I. E. and PĂTRAŞCU, L. (2019). Understanding Patterns in the Consumption of Agro-Food Products in Romania – An Analysis at Regional Level. Romanian Statistical Review, 81 (4).
O’Carroll, P.W. et al. (1998). Information needs in public health and health policy: results of recent studies. Journal of Urban Health. 75 (4), 785–793.
Rattanavipapong, W., Thavorncharoensap, M., Youngkong, S., Genuino, A. J., Anothaisintawee, T., Chaikledkaew, U. and Meeyai, A. (2019). The impact of transmission dynamics of rabies control: Systematic review. Vaccine, 37, A154-A165. [Online], [Retrieved February 18, 2020], https://www.sciencedirect.com/science/article/pii/S0264410X18315585.
Reis, B., Kohane, I. and Mandl, K.D. (2007). An epidemiological network model for disease outbreak detection. PLoS Med. 4 (6). [Online], [Retrieved February 18, 2020], https://www.ncbi.nlm.nih.gov/pmc/articles/PMC1896205/.
Robertson, C. and Nelson, T.A. (2010). Review of software for space-time disease surveillance. International Journal of Health Geographics. 9. [Online], [Retrieved February 18, 2020], https://link.springer.com/article/10.1186/1476-072X-9-16.
Sreenivasan, N., Li, A., Shiferaw, M., Tran, C. H., Wallace, R., Blanton, J. and Tahmina, S. (2019). Overview of rabies post-exposure prophylaxis access, procurement and distribution in selected countries in Asia and Africa, 2017–2018. Vaccine, 37, A6-A13. [Online], [Retrieved February 18, 2020], https://www.sciencedirect.com/science/article/pii/S0264410X1930475X.
Toma, I. E. and Mirica, A. (2018). Using Statistical Data to Better Understand Business Environment –Case Study on Export and Import Data at County Level. Romanian Statistical Review, (2).