Volume 2021,
Article ID 524370,
Communications of the IBIMA,
12 pages,
DOI: 10.5171/2021.524370
Received date: 12 February 2020; Accepted date: 15 January 2021; Published date: 5 March 2021
Academic Editor: Aleksandr Kozlov
Cite this Article as:
Alexandru Marius OBRETIN (2021)," “Sensor-based Methodology for Indoor Trajectory Determination”", Communications of the IBIMA, Vol. 2021 (2021), Article ID 524370, DOI: 10.5171/2021.524370
The unprecedented development in the realm of Internet of Things in recent times has facilitated the adoption and integration of microcontrollers and sensors into a large variety of contexts and at a significant scale. Among the multitude of concepts that derive from this paradigm, a topic that recently grabbed both industry and academic interest is the indoor location, a field where dynamic challenges are currently tackled in order to enhance existing emergency evacuation systems, behavioural based recommendation engines and improve indoor assistants for optimized path finding and accurate guidance. Although valuable and thought-provoking exponents of these categories are further presented in detail in the related work section, most of them are designed to address particular cases, without considering a broader spectrum of variables, often being state-of-the-art academic initiatives. This paper analyses already proposed architectures that rely on common infrastructure – hardware capabilities that are found in a smartphone, identifies a series of flaws in the implementation and provides solutions for the emphasized issues. Overall, this article presents a software architecture that relies on open-source technologies and standards to collect sensor data from a smartphone, details the statistical methods involved in the filtration phase and describes the processing techniques used for indoor trajectory determination. The design is light, oriented towards easy interaction and composed of multiple microservices that address specific functions which can be enabled on demand.
In recent years, indoor positioning has evolved from a peripheral research topic to a developing industry where more and more academic and commercial initiatives try to innovate and design novel and ingenious algorithms that can tackle stringent challenges in order to capitalize and gain recognition. International events are held for stakeholders to meet and exchange ideas, special issues are dedicated to the topic in research journals and overall prospects are positive.
Although indoor positioning systems are yet expensive, complicated and sometimes inefficient, they reveal atypical use cases in indoor routing, asset tracking, real-time personnel management and monitoring, behavioural studies and emergency situations management. Over the years, various concept applications have been designed to approach indoor positioning challenges, the most interesting relying on neural networks to assist victims in cases of emergency – Falcon and Schulzrinne (2018), augmented reality tools for environment scanning – Rajagopal et al. (2019), Haynes et al. (2018), Cankaya et al. (2015) or image-based facility management – Baek et al. (2019), Koch et al. (2014).
Moreover, a classification initiative from Lashkari et al. (2019) categorized available indoor positioning systems into crowdsensing and crowdsourcing. While the former is characterized by mandatory implicit initiative from the user, the latter insists on explicit initiative. Concretely, crowdsourcing systems gather information directly from the users. Differently, crowdsensing systems collect data from already deployed networks of sensors. In spite of the increased attention both groups have received in the past years, the initiatives are rather sporadic, they do not have a high degree of generality and what is appropriate in one context may be inappropriate in another, because indoor location systems are often sensitive to the particularities of the environment in which they are deployed.
Related work
Another classification might categorize indoor positioning systems into hardware backed systems and software backed solutions. The first category is heavily dependent on existing information exchange protocols and technologies, such as Near Field Communication, Wi-Fi, Bluetooth Low Energy or magnetic field detection. One major disadvantage of this category is represented by the strong correlation between the system’s accuracy and the physical characteristics of the sensors networks that support the entire infrastructure, networks that are usually expensive to deploy and maintain. Nevertheless, the accuracy of these layouts tends to get affected when the reference buildings get crowded, when the batteries run out of energy or when they interfere with materials that have particular physical properties that block signal propagation. The second identified paradigm involves the use of innovative information technology solutions to compensate for the logistical and economic disadvantages of the first category. The studied initiatives belonging to this spectrum generally use common infrastructure, elements that the subjects possess in their great majority, in a modern society. In particular, the most used device in experiments in this way is the mobile phone. The prominent technological evolution of the last decades, the miniaturization of integrated circuits and hardware components, the increasing performances of the processing units, the incorporation in a mobile device of a wide variety of sensors and the development of innovative technologies such as artificial intelligence or augmented reality have facilitated new research opportunities. A number of initiatives have been successfully developed and tested in isolated contexts, either capturing video streams via the camera, which they then process using image recognition techniques and geometric analysis – Jeong et al. (2017), Zhang et al. (2016), or using artificial intelligence algorithms to estimate, based on data collected in real time, the mileage – Sui and Wang (2015), Ha et al. (2018), Huang et al. (2017).
A major disadvantage of the latter category compared to the former is the dependency on an updated building model of the reference venue. More precisely, for software solutions that rely on image processing techniques that compare video streams captured with the camera with an already known model, external changes, like advertisements, posters, lighting can prevent pattern recognition. Therefore, such applications require model maintenance and for example, in the context of large shopping centre, whenever a shop is replaced, or with every season’s new collections that get displayed behind glass walls or holidays decorations, the reference images need update to reflect the reality. A solution for this stringent issue in the realm of software based indoor positioning systems is to rely on something more static, like the floor plans.
The hereby paper will adapt, test, analyse and enhance several indoor location techniques detailed in Xu et al., where the authors proposed a software solution using smartphone capabilities to determine displacement inside venues. Although, this is not the only article of its kind, other similar initiatives that outline thought-provoking results being available in Truong et al. (2016), Zhang, Liu and Qu (2016) and Puangnak (2019), it would be the reference material for the research efforts detailed in this work, as some strategies can be adjusted and extended to a large variety of contexts, providing the prerequisites for a more general purpose indoor location application.
Theories and Methods
Since the sensors present in smartphones are capable of high frequency measurements, an architectural decision has involved the migration of processing algorithms to a stand-alone service, isolated from the source of information gathering, so as to avoid overloading the system. As such, the mobile phone remains responsible only for data acquisition and display of results, while the processing logic is migrated to a dedicated web server. This separation of responsibilities has favoured the development of individual modules, with a specific, well-defined role. In addition, during the implementation, the need for a mechanism to facilitate a phase-out and at the same time dissociated communication has been identified, because the frequency with which the information can be generated exceeds the frequency of its processing. Therefore, the entire architecture has evolved around the producer-consumer pattern, in which a number of components of the application are responsible for generating information, while others aim to process existing information and determine derived results.
The attempt to implement a software solution that integrates distinct components that communicate with each other through Apache Kafka has materialized in defining a service responsible on the one hand for aggregating and processing the values collected from the accelerometer, and on the other hand for correlating these values with angles measured by the gyroscope. The values from the accelerometer describe the acceleration exerted on the mobile phone, which is decomposed into a three-dimensional system associated with forward-backward, left-right, top-down motions, also known as roll, pitch and yaw – Fig. 1.
Fig. 1: The roll, pitch and yaw of a phone
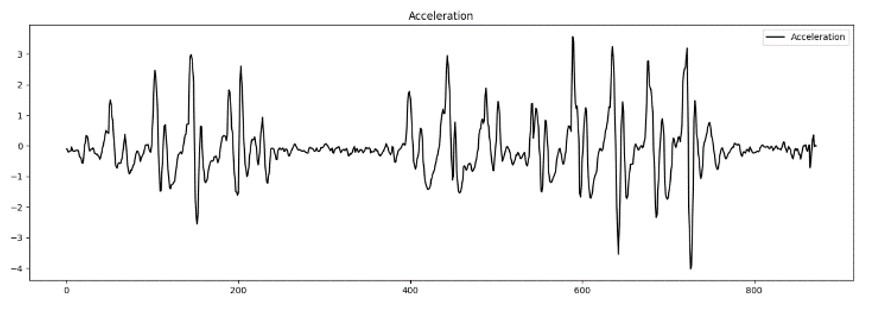
The values obtained with the help of the gyroscope highlight the angle between the front of the phone and the magnetic North Pole. The displacement estimation service reads these values from the Kafka cluster and ensures the data integrity, verifying that the measurements made by the two sensors are recorded simultaneously and the length of the data sets corresponds. For each monitored time interval, an aggregate acceleration is determined as the difference between the root of the sum of the squares of the decomposed accelerations and the gravitational acceleration, as suggested in Xu et al. Once the aggregated acceleration has been computed, by simply graphing the values, the need for an intermediate stage of statistical processing is noticed, as the values obtained in this manner faithfully reflect the raw quiddity of the digital signals, being therefore strongly altered by digital noise. The hardware characteristics of the accelerometer, as well as the imperfect nature of the measurements that are heavily influenced by frictional forces with various surfaces and oscillations specific to human movement while the position of the phone varies simultaneously on the three components during a step, lead to the appearance of local extrema points in the graph that distort the representation and alter the result, as shown in Fig. 2.
Fig. 2: Unfiltered acceleration values measured with phone’s accelerometer
In an attempt to remove the noise and smooth the graphical representation, one tested solution is filtering using a simple moving average. Starting from a numerical series and a fixed size subset of it, usually the first n elements of the series, the first value of the simple moving average is obtained by calculating the arithmetic mean of the whole subset. In general, a reasonable size of this subset is chosen, so that the resulted average is representative for the measured values. In this case, the chosen size is 10. Subsequently, the subset is altered by forward translation, which involves excluding the first element from the set and including the next, then the average of the new range is computed. The process is repeated until the complete processing of the initial series values.
Simple moving averages are generally used in time series processing to smooth short-term fluctuations and highlight long-term trends or cycles. Areas that make extensive use of such instruments include financial analysis, in particular the estimation of stock market prices and traded volumes, the examination of the gross domestic product value, the unemployment rate and other macroeconomic time series. From a mathematical point of view, a moving average is a type of convolution and can therefore be used as a low-frequency filter in the processing phase of time series that describe measured values of signals.
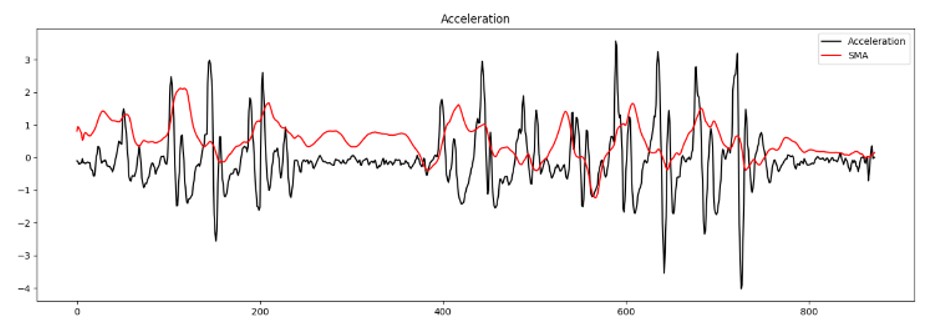
Through its intrinsic characteristics, the simple moving average is able to correct the presence of invalid local extrema points, the result thus obtained being much more malleable in the perspective of further processing and more accurately reflecting the dynamics of motion. However, the simple moving average can neither completely remove the statistical noise collected by the accelerometer when stationary, nor can it flatten all the measured pseudo-peaks, as can be seen from Fig. 3.
Fig. 3: Simple moving average (red) of the measured acceleration (black)
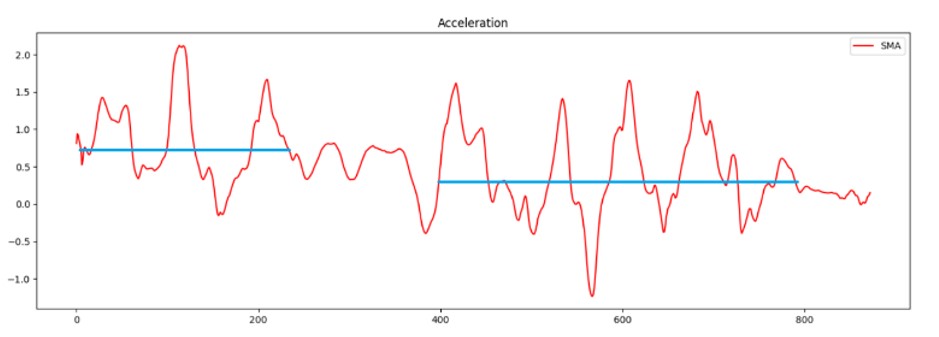
Given the smoothing of the graph, the next step would be to determine the local extrema points and apply a threshold filter, resulting in a set of points corresponding to the footsteps that the user performed while walking. This detail is relevant in the consideration of an empirical observation that outlines the fact that between successive motion intervals, separated by rest moments, the average values of the acceleration vary. In other words, the average acceleration monitored by the phone sensor is not constant over the motion intervals and therefore the transitions from motion to rest can project local extrema points that in the prospects of future processing represent invalid points that need to be filtered, but which cannot be excluded with a threshold filter, without eliminating values associated with valid extrema points, as well. Fig. 4 graphically represents the values recorded by the accelerometer in the context of a rectilinear motion, where the subject is walking in two successive intervals, separated by a stationary period. It is visible how the trend decreased between the monitored intervals and the same characteristics have been noticed also for short stops required for door openings or changes in navigation direction, when the subject turns to one side to enter a room that is not collinear with the previous path.
Fig. 4: Different trend values of acceleration in successive rectilinear motions separated by a stationary period
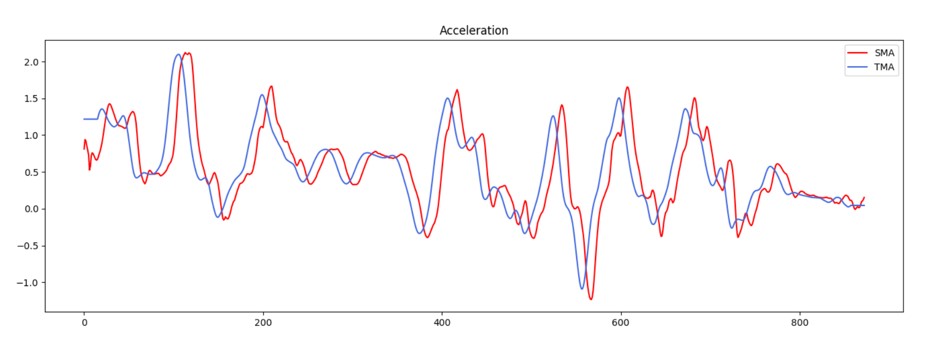
Consequently, the use of the simple moving average has been reconsidered and a triangular moving average has been opted for, as the second choice does not react as quickly in conditions of frequent variability. In the case of accelerometer signals, pseudo-peaks generated by measurement errors and digital noise, identified by the successive presence of two peaks of similar amplitudes in very short time intervals, largely double the number of oscillations, which impacts the result of a simple moving average. The triangular moving average represents the average of the averages for a given data set. In the first stage, the simple moving averages for a conveniently chosen window are calculated, and then, based on the obtained simple averages, a secondary average is similarly determined. Visually, a triangular moving average describes a graph whose evolution is constant and slow compared to a simple moving average, that forces such representations to remain in trend for a longer period of time, providing a more accurate picture of the studied phenomenon. The differences between the two are visible in Fig. 5.
Fig. 5: Simple moving average (red) and triangular moving average (blue) of the measured acceleration
The main advantage offered by a triangular moving average is that of staying in trend for a longer period, which produces in terms of graphics processing a superior flattening of the secondary peaks, resulted from measurement errors. However, not all secondary peaks are flattened below a triangular moving average and the method also alters the amplitudes of the initial data set. Therefore, the use of a triangular moving average has been in turn reconsidered to the detriment of a Savitzky-Golay filter, described in Schafer (2011).
The algorithm proposed by Savitzky and Golay, as outlined by Ostertagová and Ostertag (2016), involves a digital filter that can be applied to a set of points in order to smooth the graph they describe, thus achieving superior accuracy, without distorting the general trend of the signal. To obtain this result, a convolution is used to try to match subsets of adjacent points with a low-grade polynomial, based on the least squares method. When the points are evenly spaced, a solution for the least squares’ equations can be identified as a set of convolution coefficients, which can then be applied to all other subsets, to obtain a continuous and uniform representation of the signal at all central points of each subset – Pandia et al. (2010).
However, a distortion of the initial signal following the convolution process is inevitable. From a polynomial degree higher than 3, when the values describing local extrema points are smoothed, the amplitude of the vertex will be reduced, and the median width of the graph portion will increase. Both the magnitude of the distortion and the improvement of the signal-to-noise ratio decrease with increasing polynomial degree, respectively increase with the size of the convolution function.
Although moving averages provide better digital noise reduction, they are unsuitable for smoothing functions that have curves described by point subsets. A quadratic function used as a filter is inappropriate for obtaining the derivative of a parabola with an inflection point, because a quadratic polynomial has no inflection points. The Savitzky-Golay filter can be explained in a few words as an effective interpolation in the case of univariate time series. From a graphical point of view, all variants represent techniques used for smoothing data series and it would be erroneous to assess one being better than the other, as their performance level is strongly dependent on the particularities of the data. Fig. 6 depicts a graphical representation of them in the current context.
Fig. 6: Simple moving average (red), triangular moving average (blue) and Savitzky-Golay filter (green) of the measured acceleration
Because footsteps determination is strongly correlated with the aggregate acceleration, which is computed as a square root from the sum of the squares on the three components, from which the gravitational acceleration is subtracted, the application considers redundant movements as displacement, with associated graphical highlighting. Repetitive sequences of steps to the left and right cause oscillations of acceleration on the X component, which successively record positive and negative values. As the used calculation function is based on the square value of this record, the direction of travel is ignored, the value is always positive, and the algorithm assumes that the user is moving at a constant pace in a certain direction, a chart describing this case being detailed in Fig. 7.
Fig. 7: Graphical representation of a linear left-right motion of the phone on a flat surface
Similarly, the same erroneous behaviour has been noticed for repetitive forward-backward navigation, this time the impact being on the Y coordinate. By analogy, climbing and descending the same step on a stair repeatedly will determine the distance calculation function to assume that the user is advancing to an upper floor of the building.
Following the reasoning described above, but introducing the orientation angle in the equation, it must also be considered the scenario in which the user rotates with the phone in an arc of a circle or even in a complete circle, sitting more or less in place. Such movements describe changes in the direction of travel or even turns, many of them inherent in the context of motions. However, rotating on the spot determines either positive or negative values, depending on the rotation direction, for acceleration on the X component. A correct behaviour of the displacement function should identify the moments when the user makes turns and not consider the data associated with these movements.
Experimental Results
These impediments identified in the process of concrete experiments led to transition from the aggregated approach proposed in Xu et al., in which the acceleration is perceived as a cumulation of values on the three components towards a solution that distinguishes between these values and makes informed decisions, taking into account the position of the phone and the behaviour of the user. Thus, depending on the values recorded by the accelerometer in the three-dimensional reference system, the displacement consideration is mainly assessed in relation to a single component. Specifically, if the user uses the phone perpendicular to the normal plane, the accelerations related to the Z component are the ones that determine the motion, while in the context of using the phone in a position parallel to the normal plane the Y or X component is the relevant one.
The strength of this approach consists of two distinct aspects. On the one hand, there is an isolation between the gravitational acceleration exerted on the phone naturally and the concrete acceleration the user impresses to the device while walking. On the other hand, by eliminating the use of the squared components, an indication of the moving direction is kept during the measurements. From this point of view, not only can positive and negative values be seen at data set level that suggest depending on the position of the phone the direction of motion, but several generally valid assumptions can also be identified.
Some empirical observations during the tests:
having the mobile phone in portrait mode, with the screen parallel to the floor and facing the ceiling and the top of the phone away from the subject, at rest, the acceleration values on the components are: X approximate 0, Y approximate -1, Z approximate -9.8
having the mobile phone in portrait mode, with the screen parallel to the floor and facing the ceiling and with the top of the phone close to the subject, at rest, the acceleration values on the components are: X approximate 0, Y approximate 1, Z approximate -9.8
having the mobile phone in landscape mode, with the screen parallel to the floor and facing the ceiling and the top of the phone oriented towards the right of the subject, at rest, the acceleration values on the components are: X approximate 1, Y approximate 0, Z approximate -9.8
having the mobile phone in landscape mode, with the screen parallel to the floor and facing the ceiling and with the top of the phone oriented towards the left of the subject, at rest, the acceleration values on the components are: X approximate -1, Y approximate 0, Z approximate -9.8
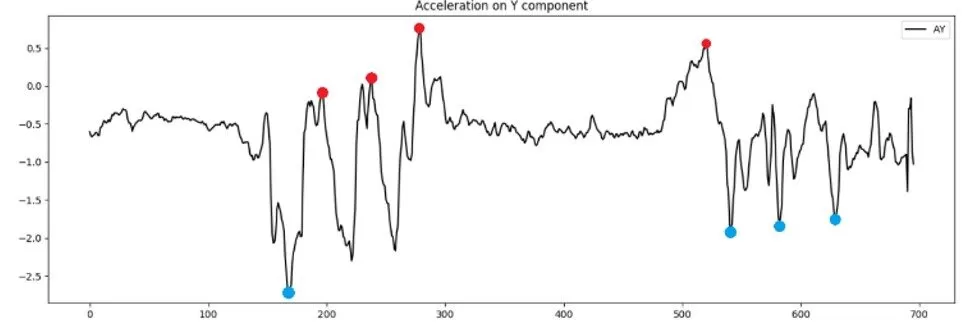
when moving in the forward direction, with the mobile phone in portrait mode, with the screen parallel to the floor, on Y component of the acceleration, before the first step there is a slight decrease in the acceleration value on this segment, followed by steep increases associated with each step, these increases exceeding in value the adjacent trend;
when moving in the backward direction, with the mobile phone in portrait mode, with the screen parallel to the floor, on the Y component of the accelerator, before the first step there is a slight increase in the acceleration value of this segment, followed by sudden decreases associated with each step, these decreases being below the value of the adjacent trend – Fig. 8;
Fig. 8: Identified patterns in linear forward – backward motion
Identifying the aforementioned patterns in the graphical representation is a key aspect, as it helps understanding the way the information is collected from the sensor and provides a visual tool for identifying sequences of steps in either direction. Besides the positive/negative values the accelerometer collects, that are further stored in an unfiltered manner in the Kafka cluster, the graphical analysis module integrated in the solution represents an inspection mechanism that can validate the results. Currently, the proposed software solution integrates two distinct services that are accountable for interpreting raw data. On the one hand, there is a plotting module that portrays the information in convenient visual ways, and on the other hand, there is the navigation module that can determine displacement.
Considering the previously mentioned data processing techniques and the strengths and weaknesses of each approach, the proposed architecture has adopted a Savitzky-Golay filter for noise reduction. Having three different streams of data, representing acceleration values on each axis, the filter eliminates the pseudo-peaks resulted from measurement errors, followed by a secondary threshold filtration that removes peaks which are located too close to a neighbour, as body mechanics brings some constraints that prevent consecutive steps in less than 0.4 seconds – Chen et al. (2015), in a walking context. After the filtration process, the resulted data set is used to determine local extrema points corresponding to the subject’s footsteps while navigating inside a building.
The developed application requires a QR code reading in the initial point of the mapping that contains details about the respective position relative to the entire building representation. Following this step, the user gives the consent for data collection and the application starts gathering information from the sensors. While navigating inside the venue, the sensors harvest data and send them in an asynchronous manner, in batches, to the server where the information is stored in predefined Kafka topics. Further, when a detailed representation of the mileage is requested from the webpage, the solution determines the original user’s coordinates in the floor plan from the metadata written in the QR code, and then, incrementally, based on the identified local extrema points, calculates the displacement using the current position and the angle relative to the magnetic North Pole. This is a sequential process where the steps are determined one by one. The displacement is estimated using a linear mathematical model for estimating the length of a step depending on the height of the subject – Guest et al. (2017) and the step frequency. Precise estimation of each step is retrieved in a Cartesian system, using trigonometric functions to calculate the relative distances on the horizontal and vertical axes. Currently, the solution is capable of retrieving indoor location in a moment subsequent to the actual motion.
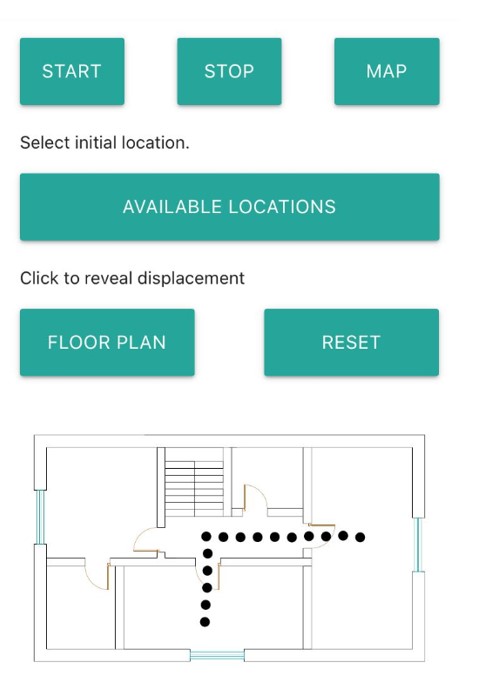
Fig. 9 shows the motion between two rooms located on the same level in a residential building.
Fig. 9: Screen capture from the web interface of the navigation service
Conclusions
The proposed solution addresses several challenges that other studies mentioned in the related work section have not considered, providing an effective solution for indoor location in a one-story building context. The decomposed acceleration approach provides the necessary means for correctly estimating the movement direction depending on the values sign. A comprehensive filtration step flattens the measurement prominences and outlines a continuous, smooth graphical representation that is suitable for mathematical analysis. Local extrema points correspond to actual footsteps that can be represented on a bidimensional floor plan, computing precise coordinates using basic trigonometry and relative angles between the gyroscope recordings and the magnetic North Pole. Correlated with a magnetometer, these principles emulate the behaviour inside an attitude and heading reference system capable of correctly assessing the current position of an object over time.
The architectural strategies applied to this project offer two major advantages over other projects mentioned in this paper. On the one hand, the segregation of concerns allows the complex, laborious tasks to run on a different device, saving energy and resources on users’ smartphones. Compared to native applications, the proposed solution does not require any storage space on the actual device, it does not store any temporary data other than those of the browser when the page is loaded. On the other hand, the approach proposed in the hereby paper relies on sensors that already work in the background for monitoring device rotations or falls and collects information from them in an asynchronous manner, using web workers that run on separate threads, without interfering with the main user interface thread. Moreover, the information is collected and sent to the Kafka cluster in batches, drastically reducing the number of message exchanges between the client and the server. Therefore, the energy consumption is diminished, avoiding a battery drain that would otherwise impact the user experience.
The system has been successfully tested in two distinct reference buildings providing accuracy levels under a meter for various scenarios that include linear motion, turns over sharp, straight or obtuse angles, walking backwards or in-place rotations. Last, but not least, this infrastructure free software solution can easily be extended to different structures grace to its loosely coupled design and further improvements can include routing capabilities or real-time indoor location.
Acknowledgement
This paper was co-financed by The Bucharest University of Economic Studies during the PhD program.
Baek, F., Ha, I. & Kim, H., 2019. Augmented reality system for facility management using image-based indoor localization. Automation in Construction, Volume 99.
Cankaya, I. A., Koyun, A., Yigit, T. & Yuksel, A. S., 2015. Mobile indoor navigation system in iOS platform using augmented reality. Rostov on Don, s.n., pp. 281-284.
Chen, G. et al., 2015. Integrated WiFi/PDR/smartphone using an unscented Kalman filter algorithm for 3D indoor localization. Sensors, 15(9), pp. 24595-24614.
Falcon, W. & Schulzrinne, H., 2018. Predicting floor-level for 911 calls with neural networks and smartphone sensor data. Vancouver, s.n.
Guest, R., Miguel-Hurtado, O., Stevenage, S. & Black, S., 2017. Exploring the relationship between stride, stature and hand size for. Journal of Forensic and Legal Medicine, Volume 52, pp. 46-55.
Ha, I., Kim, H., Park, S. & Kim, H., 2018. Image retrieval using BIM and features from pretrained VGG network for indoor localization. Building and Environment, Volume 140.
Haynes, P., Hehl-Lange, S. & Lange, E., 2018. Mobile augmented reality for flood visualisation. Environmental Modelling & Software, Volume 109, pp. 380-389.
Huang , J., Huang, Z. & Chen, K., 2017. Combining low-cost Inertial Measurement Unit (IMU) and deep learning algorithm for predicting vehicle attitude. Taipei, s.n.
Jeong , E. et al., 2017. An indoor positioning method in a concert hall using optical camera communication (OCC) technology. Jeju, s.n.
Koch, C., Neges, M., König, M. & Abramovici, M., 2014. Natural markers for augmented reality-based indoor navigation and facility maintenance. Automation in Construction, pp. 18-30.
Lashkari, B., Rezazadeh, J., Farahbakhsh, R. & Sandrasegaran, K., 2019. Crowdsourcing and sensing for indoor localization in IoT: a review. IEEE Sensors Journal, pp. 2408-2434.
Ostertagová , E. & Ostertag , O., 2016. Methodology and Application of Savitzky-Golay Moving Average Polynomial Smoother. Global Journal of Pure and Applied Mathematics, 12(4), pp. 3201-3210.
Pandia, K. et al., 2010. Motion artifact cancellation to obtain heart sounds from a single chest-worn accelerometer. s.l., s.n.
Puangnak, K., Waladit, . S., K. , P. & Pukjar, S., 2019. Real-time Distance Measuring Evaluation for Accelerometer Sensor on Smartphone. Pattaya, s.n.
Rajagopal, N., Miller, J. & Kumar, K., 2019. Improving augmented reality relocalization using beacons and magnetic field maps. Pisa, s.n., pp. 1-8.
Schafer, R. W., 2011. What Is a Savitzky-Golay Filter?. IEEE Signal Processing Magazine, Volume 11, pp. 111-117.
Sui, W. & Wang, K., 2015. An accurate indoor localization approach using cellphone camera. Zhangjiajie, s.n., pp. 949-953.
Truong, P. H., Kim, S. & Jeong, G., 2016. Real-Time Estimation of Distance Traveled by Cart Using Smartphones. IEEE Sensors Journal, 16(11), pp. 4149-4150.
Xu, S. et al., 2019. Locating Smartphones Indoors Using Built-In Sensors and Wi-Fi Ranging With an Enhanced Particle Filter. IEEE Access, Volume 7, pp. 95140-95153.
Zhang, R., Liu , X. & Qu, Z., 2016. The Research of Distance Measurement Method Based on Mobile Phone MEMS Accelerometer. Hangzhou, s.n.
Zhang, Y., Ma, L. & Tan, X., 2016. Smart phone camera image localization method for narrow corridors based on epipolar geometry. Paphos, s.n., pp. 660-664.