International Banking Institute, St.-Petersburg, Russia
Volume 2022,
Article ID 165496,
Communications of the IBIMA,
19 pages,
DOI: 10.5171/2022.165496
Received date: 16 March 2021; Accepted date: 26 May 2022; Published date: 6 July 2022
Academic Editor: Olga Kalchenko
Cite this Article as:
Igor K. KLIOUTCHNIKOV and Anna I. Klioutchnikova (2022)," Long-Tail Distribution Financial Recommender Systems Embedded into Social Networks", Communications of the IBIMA, Vol. 2022 (2022), Article ID 165496, DOI: 10.5171/2022.165496
Modern financial recommender systems of online social networks have switched to using extended databases that take into account not only mass and typical, but also peripheral and personalized requests of network users. Such systems use ‘long-tail’ technology. ‘Long-tail’ recommender systems demonstrate the ability to consider the interests of network users more accurately and better meet their needs, as well as allow differentiating and significantly expanding the range of financial services. This article discusses some approaches to using the information contained in the long tails of web user requests. This article answers the questions: why are custom tail queries starting to play an important role in financial recommender systems? How are tail technologies changing recommender systems? To what extent are the changes in line with the interests of network users, and how do they consider their interests and participate in the development of recommendations? Generative adversarial networks (GANs) are chosen as an example of using tail technologies to develop financial recommendations. Generative adversarial networks are a highly performance methodology that can be used to discover, filter, and incorporate tail data into financial recommender systems. A hypothesis is put forward – the long tail (LTD) technology improves the accuracy of recommendations, since it allows you to check and correct preliminary recommendations (R) developed by the discriminator system (DM): LT®DM®GAM®R. The concept of long-tailed data (LTD) improves the reliability of recommendations, expands the user base, increases the availability of services, and improves the accuracy of user behavior estimates.
Keywords: long-tail, recommender system, financial intermediary, social network
Introduction
The pandemic has significantly accelerated the movement of various types of human activity to the Internet. Financial services were no exception. One of the consequences of the accelerated development of financial services on the Internet is the ability to use a variety of information to increase competitiveness and growth. Much of the important information relates to data located in the tails of a normal distribution. Until quite recently, tail data remained aloof from analysis and did not participate in decision making.
The long-tail in financial referral networks is a retail concept of financial intermediation. It offers an expansion of both financial services and their users – network users who access financial services. The technological basis of this concept is big data and technologies such as, for example, generative adversarial networks (GANs). This concept originated and developed within the financial applications of online social networks. Modern financial culture, as well as settlements and lending, is steadily shifting from office processes and a small set of typical loan products to many specific, niche financial products in the “tail” of mass supply and demand of the online network space.
The modern digital world generates an unimaginable amount of data about everyone and everything. Recommender systems gain experience in the targeted use of information in the interests of both business and network users. This article proposes some practical approaches and conceptual justifications for using several big data domains related to the long tails of the distribution of network user requests in the financial services industry. Recommender systems based on information derived from the tail distributions of data have received additional attention due to the numerous applications in online services that are increasingly considering “peripheral” data. As long-tail data becomes dominant in many scenarios, there is growing interest in using it.
Big data analytics helps to create value not only in frequently used data, but also beyond them. To do this, a mechanism is being developed for extracting such information, separating the necessary data from noise, filtering and connecting such information to a recommender system. In recent years, the toolkit has expanded significantly, the reliability of business intelligence has increased, which made it possible to attract new methods to the analysis of the tails of consumer requests. As a result, it became possible to expand the personalization of approaches to network users, which increased the reliability of forecasts of demand for services and the accuracy of recommendations (Verhoef et al, 2016). New concepts and methods from related industries, as well as network architectures such as TailNet, increase the performance of tail data in recommendations, which can improve the competitiveness and accuracy of recommendations (Liu and Zheng, 2020).
The rapid evolution of financial applications in social networks to serve retail financial clients leads to the development of a mechanism for financial intermediation. Its basis is the use of social networks as a platform not only for social, but also for financial intermediation. However, this phenomenon, despite its importance and fundamental novelty, is not considered in this study since it requires a detailed independent analysis.
A hypothesis is put forward: social networks mediate the connections of financial intermediaries with clients; mediation is the basis for the interaction of financial intermediaries with social networks; mediation defines consistency in behavior, technique, organizational convergence, and the ability to integrate certain functions. Mediation also defines the scope and overall technical feasibility of migrating the data provided by user tail requests to the recommendation analytics engine.
The purpose of the article: to study methods of working with user requests in social networks that go beyond the normal distribution; develop new provisions, clarify terms, put forward new hypotheses and identify prospects for further research on tail data in financial applications of social networks.
Findings and added value: the information-behavioral features of business analytics of tail requests of network users and the methodology for their inclusion in recommender systems are determined.
A hypothesis is put forward about using long-tailed data in training recommender systems. The hypothesis aims to improve the accuracy of recommendations (R) by using long-tail data (LTD) in discriminator models (DM) to validate the recommendations proposed by the generative model (GM): LTD®DM®GM®R; LTD®GAN®R; The usual mechanism of operation of a generative adversarial network (GAN) on data (D) of normal distributions: D®GAN®R.
Related Works
Financial recommendation systems in social networks are a new challenge for science and practice. Its study began at the very end of the last decade. The authors of the article participated in substantiating the nomination of this problem as a new research topic and began to develop some of its aspects (for example, Klioutchnikov et al., 2020). However, a common understanding of the role and place of the mechanism of financial recommendations in the system of financial intermediation, social communications, and the information sphere, as well as in big data analytics, has not yet developed.
Early successes in the use of social media financial recommendation systems indicate the prospects for their widespread adoption and the need to move towards more accurate and personalized recommendations. Development prospects are connected, firstly, with the transition to business analytics of user request data related to outliers of normal distributions. Recommender systems represent new methods for considering all signals, including those associated with long tails, and turning them into value (Vidgen et al, 2017).
Probability theory and statistics have developed a clear approach to analyzing the distribution of data, including their heads and tails (e.g., Erhan, 2011). In recent years, business intelligence has increasingly focused on data outside the normal distribution. Interest in this topic has especially increased due to the emergence of big data technologies and the development of methods for working with them (Mikalef et al, 2019).
The problems of using tail data to determine the demand for financial services and make recommendations for web-users are related to the distribution of clicks and views of users on the web. At the same time, many clicks are associated with random views, among which only a few reflect the real interests of users and are representative. In recent years, research has begun on ways to recognize, classify, and label long-tailed data in such distributions (van Horn and Perona, 2017). As a rule, the recognition system is classified into head and tail classes. At the same time, different distributions with long tails and different classifications of data in the tails have proliferated. There are several good systems for recognizing them, differentiating them, and using them to make recommendations. They differ in recognition methods and accuracy optimization according to several criteria (Liu et al. 2019). The prevailing approach is in favor of the dominant labels. Recently, there has been renewed interest in long tail learning in the context of neural networks. At the same time, two active areas of work have emerged – a posteriori weight normalization (Ye et al., 2020) and modification of initial losses without considering various penalties (Tan et al. 2020). However, significant unresolved issues remain, including the separation of values between the head and tail classes and the use of tails to test the accuracy of recommendations. However, to our knowledge, there are no studies that consider the specifics of working with financial data in the tails of distributions.
Features of the Use of Long Tails in the System of Basic Structures
The data obtained from the peripheral requests of network users are not random. There are various approaches to their study. For example, Marlin et al. (2007) consider data that are outside of normal distributions, i.e., in the “long tail”, as missing data with predominantly negative estimates. Many other examples can be found of how netizens reveal their preferences through long tail data. The opposite approach is that peripheral requests do not affect the determination of the interest and demand of network users. In this case, they are simply cut off and not considered. The third option – with appropriate filtering and evaluation, tail data characterize the behavior of web users and confirm or correct data from a normal distribution. The fourth option is that tail data on user behavior, regardless of their place in the overall rating system, indicate consumer preferences. This means that recommender systems, with the right approach, can choose which elements to evaluate in the context of recommendations and how to use data located at different distances (d) from the data distribution center (m).
In conventional recommender systems, the amount of data is limited by the normal distribution. Therefore, a significant amount of data is missing (Zhao et al. 2015) because the systems are oriented towards a single standard of consumption and are not designed to use tail data. This approach characterizes the service provider market. Tail data changes the overall picture – the market begins to be determined by consumers, and suppliers begin to adapt to their needs.
All datasets can be divided into two sets: one is the dataset (c+) that conventional recommender systems select for evaluation, and the other is the dataset (c–) that recommender systems leave out of analysis. Traditional recommender systems use a portion of the data included in a normal distribution (c+) to generate recommendations; the remaining data related to the tail of the distribution (c–) are most often not used to make recommendations. This article proposes a mechanism for incorporating data that previously had no value for recommender systems into the recommendation generation process (c– Þ c+).
Approaches to data evaluation and filtering methods
The organization of work with data in recommender systems and methods for filtering them have been studied for more than a quarter of a century. There are two ways to collect data to create recommender systems – explicit and implicit. The data selected for recommender systems are divided into two categories: the “head” and “tail”. In practice, the normal distribution correlates with explicit data, while tail data are more related to implicit data. The transition to big data technology has had an important impact on working with data. Recommender systems open great prospects for working with big data. The transition of recommender systems to the use of tail data has significantly expanded the boundaries of the concept of big data (Themistocleous et al, 2014; Nagy, 2012).
Explicit data refer to direct requests from network users and fixed demand. They are quite distinct and clear enough to be easy enough to use in recommender systems. Explicit data also include data on already realized demand from other users, which is compared with the interests of the new user. Implicit data refer to the user’s random search on the Internet. Typically, explicit data are included in normal distributions, and implicit data are associated with their tails. Implicit data are more difficult to collect and filter. To organize work with them, special equipment is needed. It is based on noise filtering, data sampling, ranking, weighting, missing data modeling, intra-group comparisons, and especially comparisons with other data groups, including explicit data related to a normal distribution.
If one adheres to an intuitive approach to solving this problem, then one should highlight negative examples and use them along with positive ones in recommender networks. This approach is quite appropriate. But it requires a more careful assessment and using the weighting characteristics of each circumstance. The second approach is to add tail data to the main data during the preparation of the recommendation. This approach is associated with access to binary data: head/tail. There are two ways to work with such data. The first has to do with sequentially passing them through the GAN: first the head data are filtered, then the tail data, and then the results are compared. The second method is that the generative network filters the data from the head and the degenerative network uses the tail data to check the generated results. In this paper, we mainly consider the second method.
Basic approaches to data filtering:
1) rating forecasting. Typically, this approach is used to provide personal recommendations. A popular method is collaborative filtering, which allows the use of swarm intelligence. These algorithms fall into two classes: (i) memory-based – heuristic methods with similarity calculation (Verma and Aggarwal, 2020) and (ii) model-based, including Bayesian clustering (Ludewig et al., 2021), matrix factorization (Koren, 2008) and topic modeling (Hofmann, 2004).
2) ranking of forecasts. Many researchers view the recommender process as a user preference rating problem. Therefore, the following approaches are used: (i) direct modeling of user preferences using matrix factorization (Weimer et al. 2007), (ii) similarity method with correlation ratings of various users with similar values (Lui et al. al. 2019), (iii) probabilistic analysis of latent preferences (Liu et al. 2009), and (iv) filtering based on the use of consumer reviews (Koren and Sill, 2011).
3) missing data. Most traditional collaborative filtering approaches only use explicit data. The data in the tail go beyond the usual recommender systems. The data that are in the tails of the distributions are unobserved data. The authors propose a methodology for working with such data. The following sections describe the schemes for working with them.
Social media datasets typically have a few classes with more samples (i.e., head classes) and many others with fewer samples (i.e., tail classes). Unfortunately, this imbalance allows the recommender system to work well with head classes but poorly with tail classes (Dionelis et al, 2020). To address this imbalance, the paper proposes a new method for including tail data in the preparation of recommendations. It is based on a GAN-based tail data learning model with maximum entropy of regulation in two ways – by including tail data with certain weights in the generative model and adjusting the recommendations provided by the generative model based on the head data, the discriminator model working with the tail data.
New business model – support for long tail data
Social networks open up new opportunities for preparing financial advice for online users. They allow previously unused data related to tail distributions to be included in the recommendation development process. This approach is related to the concept of big data; it improves the efficiency of financial intermediation.
Introduced by Chris Anderson in 2004 in Wired magazine and two years later in Long Tails (2006), the new business model became popular on the Internet. It has become the basis of modern recommender systems, since Anderson’s approach has significantly expanded both the audience of users and the range of services. In addition, the new business model provided a more accurate picture of user behavior, which improved the accuracy of forecasts.
Recently, various approaches and definitions of the long tail effect have become widespread. However, many are confused about the definitions of “head” and “tail” and fall into the usual trap of percentage analysis in the world of absolute numbers. This problem has become especially acute in connection with the transition to big data, which forced us to take a fresh look at the organization and use of the dataset. Many previously unused data are important enough, but they have gone beyond the traditional interests. In this regard, the question arose: how to use them and how to include them in the behavior model of online users to predict their behavior and interests?
Diversity, personalization, low costs, and ideally an unlimited customer base are the business benefits of long-tail data and the new direction for recommender systems. To consider the effect of the “long tail” in recommender systems, it is necessary to consider some circumstances that can be attributed to the rules of the “long tail”: the availability of information and services for all users, various alternatives, a variety of requests and offers. At the same time, both on the demand side and on the supply side, elements appear that were not previously considered by both users and service providers. This approach allows you to customize consumer behavior and offer services that are more in line with the interests of consumers. In this direction, the long tail rules are implemented in recommender systems.
In statistics and business, the long tail of number distributions is the part of the distribution that occurs away from the head or core (Bingham and Spradlin, 2011). There is a fair amount of literature describing distributions and their various parts, including tails. There are two areas of analysis of distributions, depending on their purpose – probabilistic-statistical and business-marketing models. In statistics, the term “long-tailed distribution” has a narrow technical meaning and is a subtype of the stochastic “distribution” (Meerschaert and Scheffler, 2003).
In business, the term “long tail” is often used more broadly to describe a niche economy. In business, the term “long tail” is applied to rank and size distributions, which often form power laws and thus are long tail distributions in a statistical sense. This approach is used to analyze and describe a retail strategy with relatively small sales volumes for each of a wide range of products (“long tail”); in contrast to the main strategy with the usual popular goods in large quantities (“head”).
The specific limits of distribution to the tail and head are often arbitrary, but in some cases, they can be determined objectively. Many real financial problems are related to power datasets. For data with multiple variables, the power law tail index usually depends on the coordinates, which may be dependent. Financial recommendation systems are just getting started with customized retail scaling concepts. Microfinance-related recommender systems were the first to come up with this concept. However, retail equity trading, financial consulting, and retail portfolio management also have a wide scope for this concept. Particularly great prospects are opening in the field of so-called viral retail micro-investments.
The online lending and settlement industry, as well as financial consulting and stock trading, have changed the financial market and filled it with regular Internet users. Since the space was unlimited, there was no need to tie financial clients to the office. In addition, this phenomenon is known as the “long tail effect”. It is based, on the one hand, on the offer of an unlimited product line in the financial market that meets the interests of the most ordinary consumers with different capabilities and demands, on the other hand, on the scaling of the client base with the involvement of small and unusual consumer service needs. Online recommendation systems have completely coped with these tasks.
A long tail distribution means fewer items that are often rated by users. This fact is fundamental for filtering information, since often important data can not only be accompanied by noise, but also be presented as noise. In many cases, the scores for items in the high frequency head are not representative of the low frequency items in the tail. As a result, the process of evaluating user behavior and forecasting demand can lead to misleading results.
In many real-world scenarios, the distribution of user requests usually has a long tail. Some financial services can be very popular. They can repeatedly appear in the ratings of different users. Such ratings most often limit recommendations and exclude requests from microfinance users from large financial intermediaries, which dilutes this demand from the traditional financial market and switches users to microfinance institutions. Modeling this kind of data requires choosing the right coordinates, estimating the tail index for those coordinates, and determining the relationship between them.
In recommendations, relevance and timeliness are inextricably linked. The processing speed and reaction of the recommender system to user clicks determine the effectiveness of recommender systems. Efficiency is confirmed by the use / non-use of recommendations by users.
Binary thinking or dualism divides supply and demand into two opposite categories, and within supply and demand, the distribution of data is delimited into “head” and “tail”; one part of the data acts as the main (“head”), and the other – as the background (“tail”). At the same time, the majority and minority of data in the proposed context have the opposite meaning. An example is the ratio of urban to rural areas. Thus, urban areas are much smaller, but incomparably higher in terms of economic potential, and rural lands are much larger in area, but much more modest as GDP creators. However, in terms of food security, the importance of rural areas is enormous. Such an analogy is quite appropriate for different parts of the data coming from network users – the “head” and the “tail”.
A histogram of data values shows a right-handed or tailed distribution. How to match data in distribution with tails? There are several data classification methods for statistical mapping, such as equal steps, quantiles, geometric progression, standard deviation, covariance coefficients, and natural discontinuities (Devriendt et al, 2022; Clauset et al., 2009). In this study, a simplified binary classification of the distribution into “head” and “tail” is used.
Hypothesis: with a high degree of probability, it can be assumed that the self-evident reliability of the recommendation can be achieved by tracking the interests of network users in the opposite direction – first the main (by the “head”), and then the peripheral (“tail” of distribution) requests of network users. For example, creating recommendations on the “head” and checking them with the help of the “tail”.
In the program of recommended system, elements for evaluation are selected from the entire data set. As a result, when data are included in the model, preferences are determined. To avoid data bias, unsupervised machine learning is commonly used (Shrestha et al., 2020). In the first step, all data are identified and verified (Castelblanco et al. 2020). It is proposed to extract and analyze data, as well as the formation of a communication pipeline into two modules: a module for working with the “head” and a module for the “tail”.
If the head data are sufficiently grouped and give a general picture of the interests of the network user, then the tail data are extremely fuzzy and often obscure fuzzy, and a certain technique is needed to understand them. Ratings and/or clustering are commonly used. In both cases, metrics are used. When parameterizing, it is important to take into account the following properties: (i) Data persistence, for example, the remoteness of the data flow in a cluster, and calculate the distances of all cluster points from the center of this cluster. The smaller the inertia force, the more accurately the user’s interest is determined, i.e., inertia characterizes the distribution/concentration of the user’s interests; (ii) The difference between different clusters is measured by the DUNN index (distance from the centers of two different clusters – the index was introduced in 1974 as part of cluster analysis) (Ben n’cir, et al., 2021).
The extraction of useful information from a large data set is determined by various data mining rules that characterize the interests and needs of users. The most common methods in recommender systems are (i) association – identifying relationships between different products and services, and (ii) consumer classification – identifying differences based on predetermined parameters. The most important information is obtained by combining these two techniques, which allows for more accurate decision making and modeling of the financial behavior of users (Sriramoju et al. 2018). Some algorithms are focused only on customers, while others are only focused on products. These algorithms are quite applicable for data mining and financial queries of users.
Recently, the analysis of the behavior of network users is carried out using a graph that allows you to identify the structure of the site and find hidden connections that can affect the behavior of network users. In early studies, the structure of a website was usually represented as a multidigraph containing directed edges, which can have multiple edges between the same pair of vertices (Kassak et al., 2018). The analysis allows you to identify unique addresses that provide new content to include recommendations in the system. However, such an analysis is static and does not allow observing the dynamics of user interests, as well as page updates. Currently, the web mainly contains dynamic pages that are updated at short intervals, adapting to each user, and receiving data in dynamics. Another problem with Graph-analysis of user behavior is that this method does not consider the importance of pages (vertices). The solution is to use ranking algorithms that also calculate page value for dynamically changing sites (Mohan, 2017).
When choosing an algorithm for vector analysis of the behavior of network users, the actual needs and resources, as well as their distribution, are usually taken into account. In this case, the core (“head”) and peripheral data (“tail”) are indicated. A family of probabilistic time series models is used to collect extensive content (Ye, 2021; Blei and Lafferty, 2006). In recent years, researchers have begun to focus on distributed text concepts. Integrated models highlight important while excluding less important and redundant data in text features (Marujo et al., 2016). This approach allows you to optimize the data and find a compromise between the effectiveness of training and the scale of the subject area (Agmon, 2020).
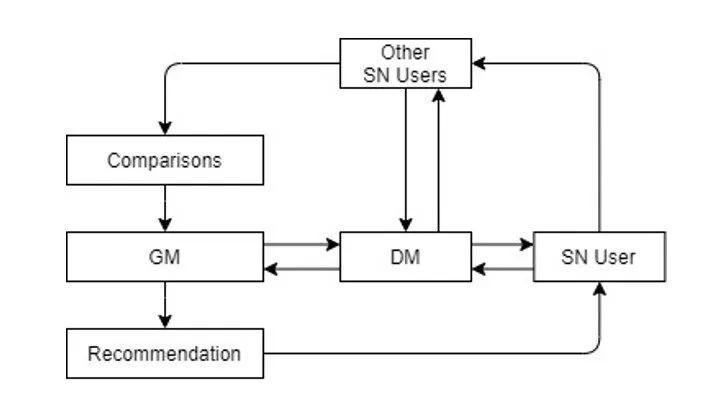
As the online economy develops, it becomes possible to quickly respond and influence the behavior of network users. The interests and demands of users become more dynamic and fleeting. All this requires a change in the concept of recommender systems – from proactive to reactive. When modeling the behavior of network users to organize the work of recommender systems, the following are considered: (i) a basic set of decisions that determines the perception of external signals by network users and the reaction to them; (ii) ways to focus the attention of network users and redirect their interests through the organization of the network operator’s work. There are two options for accessing the operator: first, the user does not have direct access to the operator’s work – P(D,F); second – the user can use the feedback method to influence him (in this case, the conditional distributions are blurred – P(D|F). The second principle corresponds to the operation of a generative-adversarial system (Fig. 1).
Fig 1. Basic guideline development of recommendations
Figure 1 depicts the basic decision-making process, including data selection from the user for whom the recommendation is intended, comparison with other users, decision preparation (GM) and solution verification (DM), and the final recommendation. This basic process learns to choose its actions to make recommendations using its experience. Decisions are made based on the system’s perception of the user’s actions and comparison of his actions with the actions of other users with whom the recommender system can interact. In particular, the consequences of their actions are modeled. This basic mechanism produces primitive predictions (recommendations), the accuracy of which underlies the feedback learning mechanism.
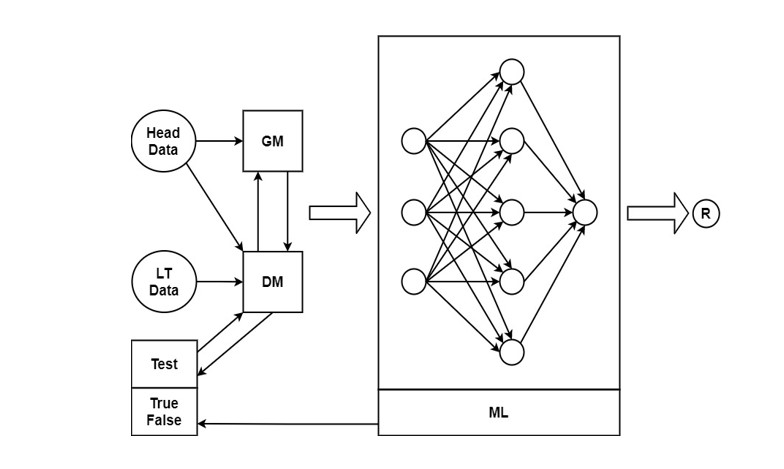
The core process considers the actions of both the user who is offered the recommendation and evaluates and compares requests, recommendations, and other users’ reactions to the recommendation. Thus, requests received from other users are also involved in the development of recommendations for a particular user. This approach allows more accurate forecasting of demand (expectations). The accuracy of estimating the demand of network users is improved by feedback machine learning with the inclusion of long data in the recommendation validation process (Fig. 2). Recursive processing of results improves the accuracy of recommendations. Data processing is carried out by a generating adversarial network (GAN), which consists of two adversarial networks – generator (GM), which prepares the decision, and discriminatory (DM), which “checks” and corrects the decision using long tail. (LT) data. Considering the principle of refusal, adjustment and competition, the system achieves a greater likelihood of recommendations and their compliance with the client’s request. Machine learning (ML) in recommender systems quickly became widespread.
Fig 2. Long tail data “correct” the output of the generative model
Conventional machine learning models are better at recognizing and processing the most common requests (“head”) and are not designed to handle infrequent user requests (“tail”). There are some downsides to deterring the use of long tails: (i) long tailed data can reduce the accuracy of the system, i.e. backfire recommendations and exhibit negative economies of scale, such as shift learning to irrelevant user interests, which skews the results (Menon et al, 2020); (ii) require the use of additional methods outside of the existing network infrastructure; (iii) incentivize exponential growth of data being processed for a small increase in efficiency, which can also slow down the system; (iv) The problem of long tail data distribution is often reduced to a state of no data at all. This situation occurs when the data is extremely blurry, with a large spread and a huge volume. It is difficult to structure such data and choose the most representative of them and use them to assess demand.
The initial prediction and feedback adjust the result with a long tail data set. The first samples of the system worked with a set of initially entered data, with the help of which the result was brought to the desired level of likelihood. A set of new algorithms allows you to increase the likelihood of a recommendation by including additional data that are taken not only from the head, but also from the tail. Modern algorithms work not only based on initially selected statistics, but also allow you to collect data from the tails. A set of master data is added and approximated by data that are on the periphery of consumer requests but may be relevant to the results and therefore correct the generation results. Most often, this process is reduced to a simple improvement in the quality of the model.
The task of determining the “edges” of a sample of peripheral data
The extraction of peripheral data becomes a new stage in the organization of work with long-tail data, requiring high accuracy in determining the representativeness (including classifications of levels of representativeness) of data and noise filtering. There is a large set of algorithms capable of detecting peripheral information. One of these methods is based on the gradient function f(x,y), which is a vector showing the direction of growth or the rate of change of the user’s search interests. It is defined as follows: , , where x and y are the direction of change in the peripheral search parameters, which are determined using the directional derivative, for example, ∂f / ∂x. When determining the boundary of space, ∂f/∂x usually characterizes the rate of change of a function (often used to determine the illumination of an object). For peripheral user queries, this indicator can characterize the compliance of the search with the financial interests of the user. There are other options for defining the boundaries of search queries that meet the requirements of the client, such as Gaussian filtering parameters, encoding and decoding system (Dado et al., 2022; Singh and Jaun, 2021; Mlsna et al., 2009).
The set of edge detectors commonly used in image processing (brightness, depth, orientation, material properties, light direction, a set of associated curves denoting object boundaries) is quite useful for filtering peripheral requests from network users. With it, you can create a vector map of the search orientation of a web user. Any edge detector allows a trade-off between identifying relevant user queries at the edge and a good noise suppression property that allows you to highlight relevant queries in the noise (Zhong et al., 2020).
Many of the proposed solutions tend to be too general and difficult to adapt to recommender goals by adjusting the dataset delimitation settings. For these purposes, the Generalized Edge Detector (GED) is more suitable, which can detect and model edge queries with a wide variety of characteristics. This method is quite suitable for tail data analysis.
The following two-level structure is suitable for working with peripheral data. First level: GED marks some signals in the database as marginal and non-marginal. Feature vectors are then extracted from these labeled signals, consisting of filter responses to G-filters at various scales. The edge detection problem is defined as a classification problem for two classes. By itself, the classifier is not suitable for extracting the desired edges for the dataset in question. Second level: A dataset with long tails is treated as a single search direction. The sets are then matched against the sets in the training set (ML). Only matching sets are kept, and the rest of the sets are deleted. To improve the efficiency of working with long tails of data, the recommender system uses synthetic data and solves related tasks – the core (head) and long tails are considered simultaneously with the exchange of information between them. In addition, Softmax cross-entropy learning is applied – logit settings based on tag frequencies (Menon et al, 2020).
In the learning process, there is both a loss of part of the data (losses occur with each subsequent training cycle), and the introduction of new ones. Gradient descent sets control points and loss functions improve data quality by including tail data. There are various options to improve data learning such as TracIn (TracIn Code) or Clowder (a data management system designed to support long tail data (Marini et al, 2018)). The challenge is to scale data retrieval and include it in a variety of use cases with a flexible core and metadata support.
Adjusting Recommendations with Long Tail Distribution
The hypothesis of using data long tails (DLD) to adjust recommendations explains how long data tails improve the accuracy of recommendations. The main goal of the hypothesis is to introduce data into the process of preparing recommendations that were not previously included in the information circle of recommender systems. The recommender system learns from messages received from long tails. Typically, information with a long tail was considered peripheral. It was considered random and insignificant – a kind of search outlier that belongs to the side interest of netizens and therefore does not deserve attention.
The technical basis of the hypothesis is Big Data technology; organizational basis – general adversarial networks; the goal is to improve the accuracy of setting the recommendation system.
Two main forms of hypothesis are proposed:
“Weak form” – additional representativeness. Data with a long tail suggest additional representativeness. They prove the requirements and interests of network users after passing through a special filter that assumes validity and corrects the recommendations (discriminatory network) prepared by the generative network.
“Strong form” – increased representativeness. Formally, correctly filtered random and non-standard clicks can more accurately and fully reflect customer demand. Using the special properties of the long tails of the data, it is possible to determine the parameters of a particular consumer demand and more fully extend the perception of the long part to the user’s consumer interest, different from the previously compiled consumption model based on the prevailing user behavior. This result can be seen as a “paradoxical enrichment”. However, data with long tails can also destabilize the results obtained from normal distribution analysis.
The enrichment paradox can be used to describe three situations:
– data with a long tail can completely change the meaning of the initially received recommendations (based on normal distributions generated by the network);
– Enrichment can be perceived as an increase in the amount of data considered, for example, when moving to work with big data.
– The process of additional training, adjustment and tuning of the system using discriminator algorithms.
In some cases, the tail data simply have properties that can increase the representativeness of the sample and provide recommendations that are better suited to demand. The problem is filtering the tail data. This problem is solved in the following way:
– Formation of a more complete picture of consumer demand (algorithms for measuring opportunities). This valid representation propagation approach is derived from a sample with an expected tail over all data. At the same time, the representativeness of the tail data is a rather formal concept. Its compliance with reality is expressed through the magnitude and boundaries of the confidence interval.
– Under normal conditions, the value of the confidence interval is calculable and depends on the size of the general population (“head”) and sample, as well as on the selection method. In most cases, sampling theory (both in mathematical statistics and in computer science) usually considers data that enter a normal distribution and leaves outliers (tail data) outside the scope of the study. To include tails in the system, it is necessary to change the approach to the confidence interval – to evaluate the parameters not only in the normal distribution, but also in the long tail, that is, to approach the outlier of the normal distribution as a new sample, which is considered separately from the rest of the dataset.
– The new sampling theory paradigm is that sampling is no longer the result of capturing the value being recorded in the data set but is the result of a projection onto an operator in which the signal is sparsely represented. To select a coefficient from a representation, a measure of sparsity associated with the selection algorithm must be applied (the greedy or minimization algorithm is most used) (Picart, 2021). As a result, the role of the operator in the process of preparing recommendations in the GAN increases. The sampling method allows an effective technique to carry out a logical semantic link between the statistical properties of the sample and the purpose of modeling – the preparation of accurate recommendations. Using this method in GAN increases the dimensionality of the confidence interval; at the same time, this method acts as a means of solving Pareto optimality by selecting individual criteria and ranking them (Arora, 2017).
– Recently, there has been a sharp increase in interest in sampling from a known set of vertices. This assumes that nodes that are close to each other have similar values, i.e., the graph encodes the similarity between the values observed at the vertices (Lorenzo et al., 2018). In this case, the sample design affects the mitigation of the effect of noise on the result and the comparison of different samples (primarily the “head” and “tail”).
– New approaches to solving distribution “errors”. Generally, data outside of the normal distribution are considered probable errors. They are cut off or considered with errors that do not go beyond the calculated parameters and are not taken into account in the overall calculation. Such “errors” can be optimized using minimax algorithms (“error algorithms”) (Diana et al., 2021).
Can long tail algorithms retrain and reprogram recommendation engines? New technologies can open up such prospects. They can be messengers for learning algorithms based on information from long tails. Schematic analogues can be algorithms that describe the mechanism of action of an innovative vaccine against COVID-19, which sends a message to cells to learn how to produce a protein that triggers an immune response. The basic technology developed in biology is also available for other information systems. Theoretically, it is quite possible to assume that special algorithms built into the GAN can generate a network to develop new conditions and methods for extracting and filtering data, as well as developing and adapting financial recommendations for specific network users.
In recommender systems, the influence of tail distributions on the accuracy of recommendations and tracking the reaction of network users to recommendations are implemented through a generative adversarial network. GAN uses a pattern that includes the normal distribution of data. Based on it, recommendations are prepared, which are checked by a discriminatory network, considering tail distributions. Accordingly, filtered data with a long tail retrain the entire system and prepare more reliable and popular recommendations (Verification Technology – data validation based on messages received from long tails). Thus, long-tailed data are not only connected to the network training, but also restart the recommender calibration through the discriminator system.
Findings and Discussion
With a massive transition to online financial services in a lightning-fast response mode to network user requests, the main problems are the scale of collection, reliability, and the ability to integrate various data, as well as adjusting recommendations and improving their accuracy. The proposed options for introducing new data sets into recommender systems largely allow solving these problems. On the one hand, user queries related to long tails provide missing data, on the other hand, they allow you to check the recommendations prepared by the standard method and improve their accuracy. Most studies treat missing data as unknown information and only use data from normal distributions. They are the basis for studying, modeling, and making recommendations. It is not uncommon to neglect tail data because they are considered random and irrelevant. In practice, they are a source of rich, but fuzzy and noisy information. Part of the missing data is on the periphery of the interests of users and can be obtained by appropriate filtering of the tail distributions.
In this article, we have proposed three schemes for using tail distributions:
verification by discrimination networks using tail distributions of recommendations prepared by generative networks based on the normal distribution.
Integration of tail data into the overall GAN system, i.e., extension of the traditional data distributions considered by networks.
Additional differentiation of the distribution not only for the head and tail, but also for tail distributions into different groups with fragmentation and segmentation of data in the tails according to features. This direction requires further study, and the authors plan to continue work in this direction.
The transition from using normal distribution data in GANs to connecting to a system of distribution tails is associated with new technologies based on big data. It is shown that generative networks prepare recommendations based on head data, and tail data falling into discriminating networks are used to test recommendations. The authors believe that this approach of splitting the data set and grouping elements in different competing systems (GM and DM) increases the scale and efficiency of the system. It is also shown that this grouping is better than using only the head data.
The transition from considering the normal distribution in recommender systems to using the tail distribution is seen as part of the transition to big data, modern business intelligence and online financial intermediation. This transition begins to play an increasingly important role in the activities of financial intermediaries and allows the user to fully realize their interests. To capitalize on big data analytics (not just the “head” but also the “tail”) and turn it into a new value, ways of incorporating tail distributions into recommender systems and predictive models are being considered.
The inclusion of long tails in an analytical recommender system modifies the interaction of financial intermediaries with clients. These changes have significant organizational and behavioral implications, as they prepare for a change in the interests and power of participants in financial interactions, change the direction of driving forces and the traditional business model. Various aspects of embedding long tails in analytics and making recommendations are considered, starting with the amount of data covered, sources of their generation, aspects related to the use of data, their priority level, and methods of analysis. As tail data and their business intelligence become an increasingly important component of today’s recommender systems, they are involved in creating value for financial intermediaries. Connecting edge data to recommender systems poses many challenges and opens additional opportunities for new research across a variety of fields. Based on the critical appraisal, new methods are proposed, and the framework is expanded, and some potentially interesting research opportunities are discussed.
The move to include tail information in policy recommendations is conceptualized in terms of the level of structure and technology, as well as utility and value. The following areas of research on the use of long tails in social media recommender systems can be identified, which are of increased importance for the development of the financial intermediation system:
– Unlike the normal distribution, the time factor plays a more important role in tail distributions since many requests are emotional in nature and are determined by current and momentary interests. Therefore, the principle of working 24/7 in tail queries is especially important.
– Tail distributions are more dependent on the location of the client and the direction of his requests. They allow you to expand the geography of customers.
– Isolation of key problems in the general noise. The transition to intelligent systems for analyzing text messages and network user requests allows you to identify and / or clarify key problems.
– Frontier queries affect the effectiveness of recommendations. Social media user queries create added value through synergies based on data interaction and high representativeness.
– New technologies arising from the development of recommendations for network users affect the development of financial intermediation. The technology of tail distributions in the social environment can stimulate further differentiation of financial products and services and increase financial inclusion.
– Recommendations based on tail distributions are more related to potential interests and can influence the behavioral intentions of network users.
– It is necessary to move on to the evaluation and measurement of additional values derived from peripheral information.
– Conceptualization of the processes associated with the connection of the tail distributions of network user requests to the development of recommendations and the development of financial intermediation is associated with the definition of consumer properties and evaluation parameters of both information and technological changes, and financial intermediation.
The long data that are used to form recommendations are only a small part of the entire dataset that recommender systems rely on. The proposed approaches aim to improve the accuracy of the recommendations, as well as to better consider the financial needs and behavior of network users. The aim is to review hand tailing techniques and their role in the development of both financial intermediation and recommender technologies.
In further research, the authors propose to use the above three-loop design to solve the problem of including tail data in recommendations. The first level is based on the weighing technique. He considers all tail data as examples with varying degrees of confidence – moving from negative values to positive values (from c- to c+). The second is based on the random sampling method. This requires examples of tail data with a stochastic Bayesian approach. The third – also refers to the sampling method but considers neighboring algorithms to create examples with a heuristic idea. In general, such studies allow increasing the level of evidence and conceptual justification for the use of the “long tail” technology for the development of financial intermediation in the retail sector and increase of financial inclusion.
References
Agmon, A. (2020), ‘Semi-Supervised Classification of Unlabeled Data (PU Learning),’ Medium, Mar 6.
Arora, J.S. (2017), Multi-objective Optimum Design Concepts and Methods, Introduction to Optimum Design, Fourth Edition, Chapter 18, Academic Press, 771-794.
Ben n’cir, C-e., Bouaguel, W., Hamza, A. (2021), ‘Parallel and scalable Dunn Index for the validation of big data clusters,’ Parallel Compution, 102(1), 102751.
Blei, DM., and Lafferty, JD. (2006), ‘Dynamic topic models,’ ACM Proceedings of the 23rd International Conference on Machine Learning, 113–120.
Castelblanco A., Solano J., Lopez C., Rivera E., Tengana L., Ochoa M. (2020), Machine Learning Techniques for Identity Document Verification in Uncontrolled Environments: A Case Study, Figueroa Mora K., Anzurez Marín J., Cerda J., Carrasco-Ochoa J., Martínez-Trinidad J., Olvera-López J. (eds), Pattern Recognition, MCPR 2020, Lecture Notes in Computer Science, vol 12088, Springer, Cham.
Clauset A., Shalizi C. R., and Newman M. E. J. (2009), ‘Power-law distributions in empirical data,’ SIAM Review, 51, 661–703.
Dado, T., Güçlütürk, Y., Ambrogioni, L.et al. (2022), ‘Hyperrealistic neural decoding for reconstructing faces from fMRI activations via the GAN latent space,’ Sci Rep 12,
Devriendt, K., Martin-Gutierrez, S., Lambiotte, R. (2022), ‘Variance and Covariance of Distributions on Graphs,’ SIAM Review, 63 (2), 1-38.
Dhelim, S., Ning, H. and Aung, N. (2021), ‘ComPath: User Interest Mining in Heterogeneous Signed Social Networks for Internet of People,’IEEE Internet of Things Journal, 8, 7024-7035.
Dionelis, N., Yaghoobi Vaighan, M., Tsaftaris, S.(2020), ‘Tail of Distribution GAN (TailGAN): Generative-Adversarial-Network-Based Boundary Formation,’ 2020 Sensor Signal Processing for Defence Conference (SSPD), 1-5.
Diana, E., Gill, W., Kearns, M. et al. (2021), ‘Minimax Group Fairness: Algorithms and Experiments,’ AIES ’21: Proceedings of the 2021 AAAI/ACM Conference on AI, Ethics, and Society, 66-76.
Duarte, K., Rawat, Y.S., & Shah, M. (2021), ‘PLM: Partial Label Masking for Imbalanced Multi-label Classification,‘ 2021 IEEE/CVF Conference on Computer Vision and Pattern Recognition Workshops (CVPRW), 2733-2742.
Erhan, Ç. (2011), ‘Probability and stochastic, Springer, New York.GitHub, Datasets For Recommender Systems, RecSysDatasets, GitHub,’ [10 May, 2022] Available: URL https://github.com/RUCAIBox/RecSysDatasets
Eshtokin, S.V. (2021), ‘Тotal digitalization and the COVID-19 pandemic as strategic catalysts for creating adaptive models for promoting banking products,’ Market economy problems.
Feldman, V. (2020), ‘Does learning require memorization? a short tale about a long tail,’ Proceedings of the 52nd Annual ACM SIGACT Symposium on Theory of Computing.
Flores-Gallegos, N. (2019), ‘On the calculations of Shannon’s entropy in atoms and molecules I: The continuous case in position and momentum spaces,’ Chemical Physics Letters, 720, 1-6.
Ge, S., Dou, Z., Jiang, Z., Nie, J. and Wen, J. (2018), ‘Personalizing Search Results Using Hierarchical RNN with Query-aware Attention,’ Proceedings of the 27th ACM International Conference on Information and Knowledge Management.
Ge, Z. and Li, X. (2021), ‘To Be or not to Be, Tail Labels in Extreme Multi-label Learning,’ Proceedings of the 30th ACM International Conference on Information & Knowledge Management.
Grami, A. (2016), Probability, Random Variables, and Random Processes, Introduction to Digital Communications. Academic Press, 151-216.
Hao B., Zhang M., Ma Q. et al. (2021), ‘A Parge-Scale Rich Context Query and Recommendation Dataset in online Knowledge-Sharing,’ arXiv:2106.06467v1 [cs.IR] 11 Jun 2021.
Hofmann, T. (2004), ‘Latent semantic models for collaborative filtering,’ ACM Transactions on Information Systems, 22 (1), 89–115.
Hu, X., Jiang, Y., Tang, K., Chen, J., Miao, C. and Zhang, H. (2020). Learning to Segment the Tail.2020 IEEE/CVF Conference on Computer Vision and Pattern Recognition (CVPR), 14042-14051.
Jacov, L., Bach, F. and Vert, J-P. (2008), ‘Clustered MultiTask Learning: A Convex Formulation,’ arXiv:0809.2085v1 [cs.LG] 11 Sep 2008, 1-14.
Jarrahi, M.H., Newlands, G., Butler, B., et al. (2021), ‘Flexible work and personal digital infrastructures,’ Communications of the ACM, 64(7),72-79.
Jurdi W.A., abdo J.B., Demerjian J. and Makhoul A. (2021), ‘Critique on Natural Noise in Recommender Systems,’ ACM Transactions on Knowledge Discovery from Data, 15 (5),1-30.
Kang, B., Li, Y., Xie, S., et al. (2021), ‘Exploring balanced feature spaces for representation learning,’ International Conference on Learning Representations, 2021.
Kassak O., Kompan M. and Bielikova M. (2018), ‘Acquisition and Modelling of Short-Term User Behaviour on the Web: A Survey,’ Journal of Web Engineering, 17 (5), 23-70.
Klioutchnikov, IK., Kliuchnikov, OI., and Molchanova, OA. (2020), ‘Alliance of Commerce and Financial Intermediation with Social Networks: Problems and Prospects,’ Journal of Internet and e-Business Studies, 2020.
Klioutchnikov I.K., Kliuchnikov O.I. and Molchanova O.A. (2020), ‘Financial Intermediary Recommender Systems,’ Journal of Eastern Europe Research in Business and Economics, Vol 2020.
Koren, Y. (2008), ‘Factorization meets the neighborhood: a multifaceted collaborative filtering model,’ Proceedings of the 14th ACM SIGKDD International Conference on Knowledge Discovery and Data Mining (KDD ’08), August 2008, 426–434.
Koren, Y. and Sill, J., (2011), ‘Ordrec: an ordinal model for predicting personalized item rating distributions,’ Proceedings of the 5th ACM Conference on Recommender Systems,117–124.
Lorenzo, P.D., Barbarossa, S., Banelli, P. (2018), ‘Sampling and Recovery of Graph Signals,’ in Cooperative and Graph Signal Processing: Principles and Applications, Chapter 9, Academic Press, 261-282.
Ludewig, M., Mauro, N., Latifi S., Jannach, D. (2021), ‘Empirical analysis of session-based recommendation algorithms,’ User Modeling and User-Adapted Interaction, 31 (5), 1-33.
Ma, Z., Dou, Z., Bian, G. and Wen, J. (2020), ‘PSTIE: Time Information Enhanced Personalized Search,’Proceedings of the 29th ACM International Conference on Information & Knowledge Management.
Marini, L., Gutierrez-Polo, I., and Kooper, R. (2018), Clowder: Open Source Data Management for Long Tail Data, PEARC ’18, Proceedings of the Practice and Experience on Advanced Research Computing. July 22–26, 2018, Pittsburgh, PA, USA, Article No. 4, 1-8.
Marlin, BM., Zemel, RS., Sam, R., and Slaney, M. (2007), ‘Collaborative filtering and the missing at random assumption,’ Proceedings of the 23rd Conference on Uncertainty in Artificial Intelligence, July 2007, 267–275.
Marujo, L., Ling, W., Ribeiro, R., Gershman, A., Carbonell, J., de Matos, DM., and Neto, JP. (2016), ‘Exploring events and distributed representations of text in multi-document summarization,’ Knowledge-Based Systems, 94, 33–42.
Meerschaert, MM. and Scheffler, H-P. (2003), Nonparametric methods for heavy tailed vector data: A survey with applications from finance and hydrology, Recent Advances and Trends, Nonparametric Statistics, Michael G. Akritas and Dimitris N. Politis (Editors), Elsevier Science, 265-279.
Meng, Y., Huang, J., Zhang, Y. and Han, J. (2021), ‘On the Power of Pre-Trained Text Representations: Models and Applications in Text Mining,’ Proceedings of the 27th ACM SIGKDD Conference on Knowledge Discovery & Data Mining.
Menon, A. K., Jayasumana, S., Rawat, A. S., et al. (2021), ‘Long-tail learning via logit adjustment,’ International Conference on Learning Representations, 2021.
Mikalef, P., Pappas, I., Krogstie, J., Pavlou, P. (2019), ‘Big Data and baseness analytics: research agenda for realizing business value,’ Information & Management, November 2019.
Mlsna, PA. and Rodriguez JJ. (2009), Gradient and Laplacian Edge Detection, The Essential Guide to Image Processing, 495-525.
Mohan, K., Kurmi, J., and Kumar, S. (2017), ‘A Survey on Web Structure Mining,’ International Journal of Advanced Research in Computer Science, 8 (3), 227–232.
Nagy Z. (2012), ‘AJAX-Based Data Collection Method for Recommender Systems,’ Recent Research in Communications and Computers, January, 446-451.
Liu, j., Dolan PJ., and Pedersen ER. (2010), ‘Personalized news recommendation based on click behavior,’ Conference: Proceedings of the 2010 International Conference on Intelligent User Interfaces, February 7-10, 2010, Hong Kong, China, 1-9.
Liu, S. and Zheng, Y. (2020), ‘Long-tail Session-based Recommendation’, Fourteenth ACM Conference on Recommender Systems (RecSys ’20), September 21–26, 2020, Virtual Event, Brazil.
Pagel, J.F. and Kirshtein, P. (2017). ‘Neural Networks,’ Machine Dreaming and Consciousness, 1st Edition, Academic Press.
Picart, P. (2021), ‘Recent advances in speckle decorrelation modeling and processing in digital holographic interferometry,’ Photonics Letters of Poland, 13 (4), 73.
Qadri, Y.A., Nauman, A., Zikria, Y.B., Vasilakos, A.V., and Kim, S.W. (2020), ‘The Future of Healthcare Internet of Things: A Survey of Emerging Technologies,’IEEE Communications Surveys & Tutorials, 22, 1121-1167.
Qaraei, M., Schultheis, E., Gupta, P. and Babbar, R. (2021), ‘Convex Surrogates for Unbiased Loss Functions in Extreme Classification With Missing Labels,’ Proceedings of the Web Conference 2021.
Rawlley, O. and Gupta, S. (2022), ‘Achieving Ambient Intelligence in Addressing the COVID-19 Pandemic Using Fog Computing-Driven IoT,’Advances in Systems Analysis, Software Engineering, and High Performance Computing.
Revathy, V.R. and Anitha, S. (2018), ‘Cold Start Problem in Social Recommender Systems: State-of-the-Art Review,’ Advances in Intelligent Systems and Computing.
Sahni, B. (2021), ‘Banking-as-a-Service: A revolution for financial institutions,’ The Economic Times. Spectrum, October 29.
Samuel, D. and Chechik, G. (2021), ‘Distributional Robustness Loss for Long-tail Learning,’ ArXiv, abs/2104.03066.
Savage, I.R. (1990), Leonard J. Savage, Utility and Probability, Eatwell J., Milgate M., Newman P. (eds), Palgrave Macmillan, London.
Seghouani, N.B., Jipmo, C.N., and Quercini, G. (2018), ‘Determining the interests of social media users: two approaches,’Information Retrieval Journal, 22, 129-158.
Selvaraj, S., Sadasivam, G.S., Goutham, D., Srikanth, A. and Vinith, J. (2021), ‘Privacy Preserving Bloom Recommender System,’ 2021 International Conference on Computer Communication and Informatics (ICCCI), 1-6.
Sriramoju, SB., Ramesh G., and Srinivas B.(2018), ‘An Overview of Classification Rule and Association Rule Mining,’ International Journal of Scientific Research in Computer Science, Engineering and Information Technology, 3 (1), 2456-3307.
Shi, F., Wang, W., Wang, H., & Ning, H. (2021), ‘The Internet of People: A Survey and Tutorial,’ArXiv, abs/2104.04079.
Shrestha RB., Raszvi M, and P.W.C., P. (2020), ‘An Unsupervised Machine Learning Technique for Recommendation Systems,’ Conference: 2020 5th International Conference on Innovative Technologies in Intelligent Systems and Industrial Applications (CITISIA), 25-27 Nov 2020.
Shu, J., Xie, Q., Yi, L., Zhao, Q., Zhou, S., Xu, Z. and Meng, D. (2019), ‘Meta-weight- net: Learning an explicit mapping for sample weighting,’ Advances in Neural Information Processing Systems, 1919–1930.
Singh, S. and Jain, P.K. (2021), ‘COVID-19 Diagnosis using Laplacian Edge Detection & Morphological Dilation,’ Conference: 2021 Second International Conference on Electronics and Sustainable Communication Systems (ICESC), 1164-1169.
Stamatelatos, G. et al. (2021), ‘Point-of-interest lists and their potential in recommendation systems,’ Information Technology & Tourism, February.
Sun, J., Yang, Y., Xun, G. and Zhang, A. (2021), ‘A Stagewise Hyperparameter Scheduler to Improve Generalization,’ Proceedings of the 27th ACM SIGKDD Conference on Knowledge Discovery & Data Mining.
Tan, J, Wang, C., Li, B., Li, Q., Ouyang, W., Yin, C., and Yan, Y. (2020), ‘Equalization loss for long-tailed object recognition,’ arXiv:2003.05176v2 [cs.CV] 14 Apr 2020, 662–671.
Taylor D. (2021), ‘How People Search: Understanding User Intent,’ Search Engine Journal, March 7.
Tiong, A.M., Li, J., Lin, G., Li, B., Xiong, C. and Hoi, S.C. (2021), ‘Improving Tail-Class Representation with Centroid Contrastive Learning,’ ArXiv, abs/2110.10048.
TracIn Code. [10 May, 2022] Available: URL https://github.com/frederick0329/TracIn.
van Horn, G. and Perona, P. (2017), ‘The devil is in the tails: Fine-grained classification in the wild,’ arXiv preprint arXiv:1709.01450, 2017.
Vidgen, R., Shaw, S., and Grant, D. B. (2017), ‘Management challenges in creating value from business analytics,’ European Journal of Operational Research, 261(2), 626-639.
Verhoef, P.C., Kooge, E., and Walk, N. (2016), Creating value with big data analytics: Making smarter marketing decisions, Routledge, London.
Verma, V., Aggarwal, R.K. (2020), Neighborhood-Based collaborative recommendations: An Introduction, Applications of Machine Learning, 91-110.
Vinodhini, G. and Ravichandran S. (2020), ‘A State Of The Art Survey On Cold Start Problem In A Collaborative Filtering System,’ International Journal of Scientific & Technology Research, 9 (4), 2606-2612
Zhong, G., Gao, W., Liu, Y., Yang, Y. (2020), ‘Generative Adversarial Networks with Decoder-Encoder Output Noise,’ Neural Networks, 127, 19-28.