Michal VARMUS1, Włodzimierz SROKA2, Oliver BUBELÍNY3 and Milan KUBINA4
1,3,4Faculty of Management Science and Informatics, Zilina, Slovakia
2WSB University, Dąbrowa Górnicza, Poland
Volume 2023,
Article ID 385619,
Communications of the IBIMA,
8 pages,
DOI: 10.5171/2023.385619
Received date: 21 November 2022; Accepted date: 19 January 2023; Published date: 1 March 2023
Academic Editor: Beata Gontar
Cite this Article as:
Michal VARMUS, Włodzimierz SROKA, Oliver BUBELÍNY and Milan KUBINA (2023)," Enterprise Reporting as A Tool For Decision Support ", Communications of the IBIMA, Vol. 2023 (2023), Article ID 385619,
DOI: 10.5171/2023.385619
The volume of unstructured data at enterprises is growing and there is a great demand for solutions that can process data and for people who know the relevant technologies. By structuring data and viewing them in the context of the corporate system, data support for decision making is created. Through technology, companies can currently dispose of a lot of data. The key task is their use in practice – correct interpretation. Today, there are many programs for their interpretation and visualization, which make it easier for managers to work in their daily activities – primarily when making decisions. The aim of the paper is to present the results of a content analysis of the justification for the use of data analysis in business practice and its subsequent interpretation through software support for the purposes of managerial decision-making, based on theoretical inputs. The article was processed on the basis of content analysis of documents from scientific articles and articles that provide information in the field of Big data. The article points out the validity of the correct use of data for decision-making by managers in the company.
Keywords: Big Data; Reporting; Power BI; Decision support;
Introduction
It is estimated that by 2025, the volume of data will reach a size of more than 150 zettabytes with the exponential growth in the world. If we wanted to watch movies of this size, we would have to watch more than 11 trillion HD movies. These movies would cover almost 2 billion years of entertainment – enough to take us to the nearest galaxy and back to Earth, with one such trip estimated to take 750 million years. Probably more than 80% of these data will be unstructured, which means they will have no value. Data only become valuable when we can process them and extract information. If we can make decisions based on that information, that information becomes knowledge. And only knowledge that provides us with answers to the questions how? and why? leads to effective and correct decision-making – this is where the added value shows and why we need to understand the data. For some large companies, the volume of unstructured data has already reached critical mass. Hundreds and thousands of sensors fill the information systems with lots of data. If enterprises struggle to process, analyze and use data today, it will only get worse over time. It’s not just some data processing or simple analysis. It is about reducing the ignorance of the enterprise, i.e., the managers who run the enterprise and make decisions. Correct and effective decision-making is so critical that it can mean a competitive advantage of the enterprise and even its survival. The thesis aims to use the example of the selected enterprise to show the importance of knowledge acquisition for decision making and management of the enterprise, as well as the early detection of errors or risks. With the rapid development of information and communication technologies, various analytical platforms are gaining importance and there is a wide range of methods for working with data.
Theoretical Review
The aim of reporting is to create a comprehensive system of information and indicators characterizing the activities of a company in an understandable and user-friendly form. It improves awareness among owners, managers, employees and other stakeholders. It synthesizes information for the management of the enterprise as a whole, as well as its basic organizational units. An important part of reporting is the establishment of performance management criteria (KPIs), which are used to compare actual progress against set goals and objectives. For relatively separate parts of the enterprise, the most commonly used financial indicators include profitability of capital (assets), profitability of revenues or costs. For the in-house centers, in relation to the scope of their competences and responsibilities, criteria related to cost management are used in an appropriate combination with natural criteria to reflect the quality and time intensity of the activities performed. The following procedure should be followed when designing and implementing a corporate reporting system:
to identify users and analyze their requirements, needs in terms of content, form and time of the information provided,
to differentiate content according to the needs of users (internal or external),
to choose the appropriate form,
to design and use a consistent design,
to choose an appropriate distribution method, separate confidential information from other information and ensure its protection,
to use feedback from the addressees, to find out how they use the reports, their comments and suggestions for improving the reporting system.
Reporting can also be seen as a “public relations” tool that modern companies are building up to strengthen their position. [17]
Internal reporting serves managers at different levels of the corporate hierarchy as a decision-making tool, but also as a tool for the top management which allows them to recognize whether or not the set objectives are being met. According to the regularity, reporting is divided into:
Standard reporting – these are reports produced at regular intervals and have a set structure (e.g. information on actual values, on variances, on analysis of variances, calculations of expected values at the end of the period). These are usually monthly, quarterly, or annual reports (shorter cycles if necessary, taking into account the cost and use of the information provided).
Extraordinary reporting – these are reports prepared on request, which may be extraordinary in terms of timing, structure or content (e.g. in relation to emergencies – pandemic of Covid-19, risk analysis, etc.).
As the annual interval is too long for operational management, most enterprises prepare monthly and quarterly reporting. A daily, weekly, or 2-week cycle is also used for analytical tracking of the most significant items of costs, revenues, current assets (receivables, inventories) and payables (to major business partners). However, it is important to consider the laboriousness and efficiency of the detailed reports and analysis provided. [17]
In order for reporting to provide a true and complete picture of the enterprise, to serve as a basis for management decision-making and the implementation of management processes, it is necessary to understand the enterprise as a whole, as a system. In general, the concept of management is defined as the direction of phenomena occurring in natural, technical, or social systems. [12] The systems approach represents a way of thinking, problem solving and acting in which phenomena are understood comprehensively in their internal and external contexts. Thus, [17] in applying the systems approach, objective reality is examined in all its complexity and intricacy to control its evolution. The complexity and synthetic nature of the study of objects is the defining feature of the systems approach.
Managerial Decision-Making
Managerial decision-making is often characterized by complexity, incomplete information and time consuming, and there is rarely a right answer. Sometimes there are multiple good options (or multiple bad options), and the manager must try to decide which of them will generate the most positive results (or the least negative results). [10] [16]
At its core, data analytics is about providing critical insights into whether a company is moving in the right direction; it is essentially the key to effective decision making. Skilled analysts, the right software and infrastructure will help identify trends in the market and explain the mechanisms behind the success of a product or service compared to others. [18] Data analytics is the key to increasing productivity, efficiency and revenue growth. The results of the data analysis will tell the organization where to optimize, which processes can be optimized or automated, which processes can be made more efficient, and which processes are unproductive. [18]
Managerial data skills are important for effective management, gathering information to support decision making. They are involved in validating decisions in the short and long term [5]. The fact is that data are becoming an increasingly important business asset and more and more decisions are based on data analysis. It is gradually increasing its importance at every department of every enterprise, which means that employees and managers who are skilled in handling data will be in a better position to help their company and move it forward. [7]
Systems, through sensors, record a number of signals that are stored as data. When we can process these data correctly, we can assign a meaning to them and interpret them as information that leads to knowledge, learning and the acquisition of wisdom. Data-driven decision making is objective and can greatly refine the expert perspective of business managers.
Data Analytics
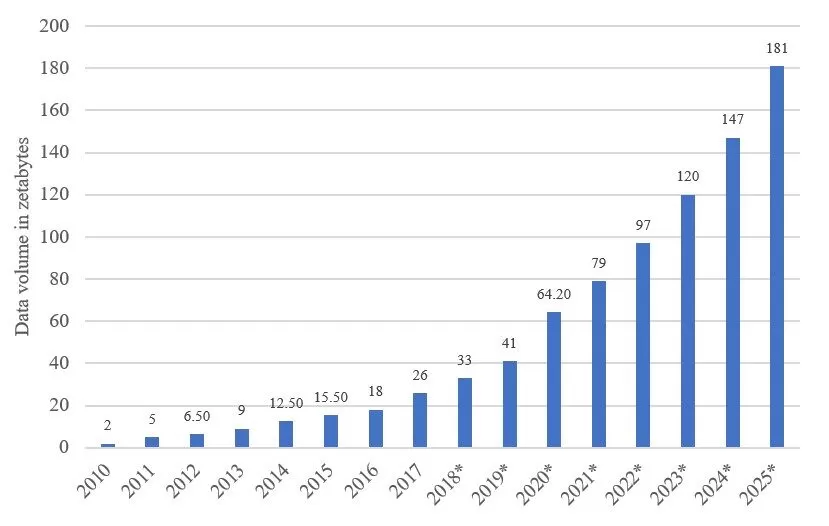
Data analytics is the science of analyzing raw data to extract information from them. In recent years, many data analytics techniques and processes have been developed and have been automated to mechanical processes and algorithms. Data analytics techniques can reveal trends and metrics that would otherwise be lost in the mass of information. This information can then be used to optimize processes to improve the overall efficiency of the enterprise or system. The chart below shows the volume of data/information created, captured, copied and consumed globally from 2010 to 2024 (in zettabytes). We can see an exponential increase in the volume of data.
Fig. 1. Exponential growth of data in the world Source: [19]
Justification of data usage:
Poor data quality costs the US economy up to $3.1 trillion annually.
In 2020, each person will generate 1.7 megabytes of data per second.
Internet users generate about 2.5 quintillion bytes of data every day.
95% of companies say the need to manage unstructured data is a challenge for the enterprise they work at. – By leveraging Big Data, Netflix saves $1 billion annually by retaining customers. [11]
Data usage
In healthcare, for example, diseases can be prevented by detecting them in their early stages. It is also extremely useful in the banking sector where it helps in detecting illegal activities. Or in meteorology, they help study global warming. Google logs more than 3.5 billion searches a day. It remains the top shareholder in the search engine market with 87.35% share in the global search engine market as of January 2020. Big data statistics for 2022 show that this will translate into 3.1 trillion searches per year and more than 99,000 search queries per second. 15% of all new Google searches have never been searched before, so it is not a case of repeating the same set of information. In 2022, there will be about 64.2 trillion gigabytes of data (64.2 zettabytes) available. 90% of all data have been created in the last two years. It would take approximately 181 million years to download all the data from the Internet by one person. [11]
In 2012, only 0.5% of all data were analyzed. Large amounts of data have no value unless they are structured or analyzed. According to the 2012 IDC Digital 19 Universe Study, only 0.5% of data are analyzed, while the percentage of structured data is slightly higher, at approximately 3%. Further examination of these data analysis statistics revealed that not all data have the potential to deliver value. [11]
In 2017, the Economist reported that data had replaced oil as the world’s most valuable resource. Unlike oil, data can be easily extracted and the resources are limitless. Unlike oil, we can use the data multiple times and gain new insights from them. The comparison between oil and data leads us to the conclusion that we should collect and store as much data as possible. However, if we do that, without structuring them or analyzing the information we have, their value will be much less significant than the value of oil. [11]
According to the IDC Big Data statistics, only 22% of all data had the potential for analysis in 2012. This includes data from different areas such as commerce, entertainment and social media, etc. The same source states that by 2020, the percentage of useful data, i.e., data that have the potential to be analyzed, has risen to 37%. [11]
97.2% of organizations are investing in Big Data and artificial intelligence (AI). In 2018, New Vantage published its sixth executive survey with a primary focus on Big Data and Artificial Intelligence. The study collected responses from executives from approximately 60 companies of Fortune 1000, including Motorola, American Express, NASDAQ, etc. [11]
62.5% of the participants reported that their organization has appointed a Chief Data Officer (CDO), indicating a five-fold increase from 2012 (12%). In addition, a record number of organizations participating in the study invested in Big Data and AI initiatives (97.2%). 60.3% of the organizations invested up to $50 million. Nearly one-third of the participants (27%) reported that the cumulative investments of their companies in Big Data and AI fall are in the range of $50 million to $550 million. 12.7% of the participants reported that their companies invested more than $500 million. [11]
Big Data have found a place in a variety of industries because, among other things, they help detect patterns, consumer trends and improve decision making.
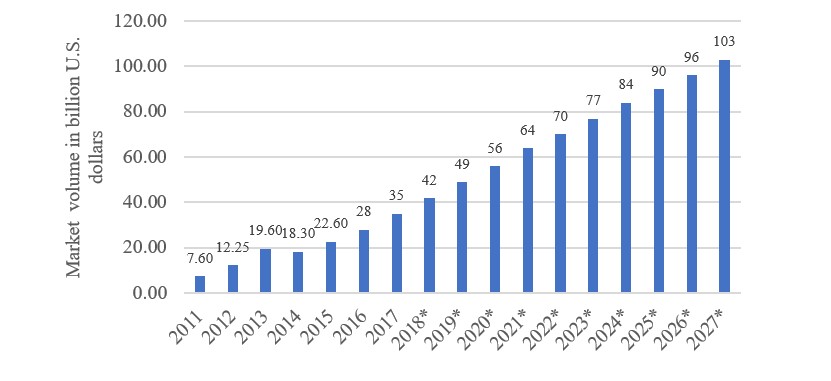
$49 billion was the value of the Big Data and analytics market in 2019, according to Wikibon. According to Wikibon, the Big Data Analytics (BDA) market is expected to reach $49 billion with a compound annual growth rate (CAGR) of 11%. The market will therefore gain $7 billion in value each year. As a result of this forecast, the BDA market is expected to reach $103 billion by 2025. [11]
The Big Data market is expected to grow at a CAGR of 12% in 2026. When examining the global market growth forecast with data from Statista, it was found that the Big Data volume had the highest growth rate in 2012 (61%) and 2013 (60%). Going through the Big Data growth statistics, the Big Data market grew by 20% in 2018, and, in 2019, the Big Data market is expected to grow by 17%. As reported by Statista, market growth will decrease over time, reaching 7% between 2025 and 2027. However, the forecasts in the chart below on market size suggest long-term growth. [11]
Fig. 2. Forecasts for the growth of the Big Data market Source: [3]
One of the biggest issues in the data industry is the lack of people with deep analytical skills. Looking at the data growth statistics, it is clear that there are not enough people trained to work with data. According to RJMetrics, there were 11,400 to 19,400 data scientists worldwide in 2015. McKinsey predicted that by 2018, approximately 2.8 million people with analytical skills were already needed. So, there is a big gap between the demand for data science and analytics talent. [11]
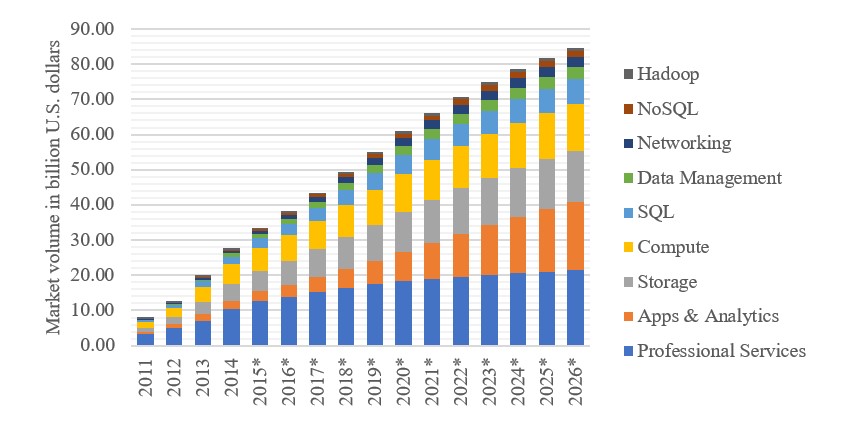
Data and analytics platforms have a huge potential. The chart below shows the growth of the Big Data market across segments. The Power BI (Business Intelligence) platform falls under “Apps & Analytics” and there is a clear growth and forecast in favor of this platform.
Fig. 3. Forecasts for the growth of the Big Data market in individual segments Source: [2]
Business Intelligence (BI) uses software and services to transform data into actionable insights that inform an organization’s strategic and tactical business decisions. BI tools access and analyze data and present analytical findings in reports, summaries, dashboards, charts, maps to provide users with detailed information about the state of the enterprise. [14]
The term business intelligence often refers to a range of tools too that provide quick and easy access to insights about the current state of the enterprise based on available data.
In the past, IT (information technology) professionals were the primary users of BI applications. However, BI tools have evolved to be more intuitive and user-friendly, allowing more people to work with these tools. [14]
According to Cindi Howson (vice president at Gartner), there are two types of BI tools. The first is traditional or classic BI where IT professionals use internal transactional data to generate reports. The second is modern BI where enterprise users work with agile and intuitive systems to achieve faster data analysis. [14]
The most important features of the BI software include:
creation of “dashboards”,
information panels,
visualization and graphical representation of data,
data mining – data acquisition,
ETL (extract-transfer-load) tools for working with data,
OLAP,
online analytical processing,
enabling reporting,
reporting and information gathering. [14]
Power BI
Power BI represents a complete self-service Business Intelligence platform from Microsoft. It can be used to combine data from a huge variety of sources and formats. It provides the necessary tools to quickly analyze these data, report and publish them. [6]
Power BI was originally created as a comprehensive and standalone application from the Excel add-ins – PowerPivot, Power View and Power Query. [6]
PowerPivot
It is an add-in for Excel, a data analysis tool. It can work quickly with up to billions of rows, it is built for fast analytical calculations, including advanced analytics. To be able to work with the data properly, it needs to have them prepared in a specific structure (Power Query or another ETL tool can help with this). It is not just about analyzing data from Excel
source files, it can be a combination of data sources (from Access, Oracle, text files, …). [6]
Power View
The Power View add-in has been available from Excel 2013 onwards; it enables interactive data analysis, e.g., as interactive animated charts or map reports – in real time and without waiting. [6]
Power Query
This is a data connectivity technology that allows data sources to be searched, connected, combined and enhanced to meet analytical needs. The features in Power Query are available in Excel and Power BI Desktop. [1]
It is one of the so-called ETL (Extract, Transform, Load) tools. It contains the processes and resources used to prepare data for analysis. The process of preparing data for analysis is known as Extract, Transform, Load (ETL). The data are extracted from internal and external sources, transformed into a common format and loaded into the data warehouse. This process also typically includes data integrity checks to ensure that the data used are accurate and consistent. It is clumsier to prepare for more advanced data transformations – they were designed to make analytics as fast as possible. [4] [6]
Power BI is also available as a standalone application (independent of Excel or Office), but as of Office 365 Enterprise E5, it is also available as part of Office 365. [8]
The advantages of such a solution include:
A single environment (application) that can cover the entire analytics and reporting lifecycle.
Since the limitations of Officom are eliminated (its 32-bit version limits the amount of data in PowerPivot), billions of rows can be analyzed. 24
Frequency of new application releases – the Power BI Desktop application is updated and released on a monthly basis, responding to customer comments and incorporating new features. Only the latest version of Power BI Desktop is supported. The latest version of Power BI Desktop is always available in the Windows Store or as a single executable file containing all supported languages that is downloaded and installed on your computer. [10] The Microsoft Store version of Power BI Desktop is updated automatically. As soon as a new update is available from the Power BI team, the application is automatically updated to the latest version and no further action is required to keep it up-to-date. [15]
The development of a new functionality is driven by user demand; on the Power BI website, you can either vote for current ideas or submit your own. Usually several thousand votes are needed, then these suggestions are incorporated by Microsoft. [13]
The application is available in both Slovak and Czech versions.
Windows 7 with all updates, or newer Windows, is sufficient for the installation, as Microsoft has announced with the October 2020 update that after 31 January 2021, the application will no longer be supported for Windows 7. In Windows 8 and later versions, support always applies to the most up-to-date version of the application. [6] [9]
Discussion and conclusion
The Management functions include planning, organizing, leading people and controlling. Managers in all functions and at all levels make decisions. They may make these decisions based on their expert judgement, past experience or information. Controlling is an effective management tool and has an un-substitutable role. It is used by managers to monitor and support the achievement of set corporate objectives. It captures early signals at the enterprise of non-compliance with set objectives and assists with corrective actions. This management subsystem is functionally cross-cutting in nature. It supports business decision making and management processes. It not only analyzes and explains, but also provides early warning of possible scenarios that may occur. The aim of reporting is to create a comprehensive system of information and indicators characterizing the activities of a company in an understandable and user-friendly form. It improves awareness among owners, managers, employees and other stakeholders. It synthesizes information for managers, reducing uncertainty/ignorance which enables managers to make better decisions. There is no denying that we are seeing a significant increase in the world of working with data. The growing demand for employees who know how to work with data, the huge investments of companies in information and communication technologies, business intelligence technologies and analytical platforms testify to the appetite for information – the new “oil” of our time. In structuring, analyzing and visualizing data, we gain information, further knowledge and wisdom = learning and improving. Working with data can be inefficient, time-consuming, which is why it is important to use the right technologies and automated solutions to get information quickly. In recent years, a large number of software and applications have been developed to serve also ordinary users, not just IT professionals or specialists. These tools help managers to extract information forming the basis for their more effective decision making.
The article highlights trends in data and their corporate use. Management at all levels makes decisions – based on expert judgement, past experience (knowledge) or information. The volume of unstructured data at enterprises is growing and there is a great demand for solutions that can process data and for people who know the relevant technologies. By structuring data and viewing them in the context of the corporate system, data support for decision making is created. Controlling is an effective management tool; it is used by managers to monitor and support the achievement of set corporate objectives. As a management subsystem, it is functionally cross-cutting in nature – it supports business decision making and management processes. Through reporting, it creates a system of information and indicators characterizing the activities of a company in an understandable and user-friendly form.
Acknowledgement
This publication was created with the support of Operational Program Integrated Infrastructure 2014 – 2020 of the project: Intelligent operating and processing systems for UAVs, code ITMS 313011V422, co-financed by the European Regional Development Fund.
References
About Power Query in Excel. [online]. [2022-11-18]. Available on internet: https://support.microsoft.com/en-us/office/about-power-query-in-excel-7104fbee-9e62-4cb9-a02e-5bfb1a6c536a
Big data market forecast worldwide from 2011 to 2026, by segment (in billion U.S. dollars) [Graph], Wikibon, March 31, 2015. [Online]. Available:
Big data market size revenue forecast worldwide from 2011 to 2027 (in billion U.S. dollars) [Graph], SiliconANGLE, March 9, 2018. [Online]. Available: https://www.statista.com/statistics/254266/global-big-data-market-forecast/
Compare Top Business Intelligence Tools. [online]. [2022-11-18]. Available on internet: https://www.betterbuys.com/bi/
Data Management Skills: Definition and Examples. [online]. [2022-11-18]. Available on internet: https://www.indeed.com/career-advice/resumes-cover-letters/data-management-skills
CHMELÁR, M., Reporting v Power BI, PowerPivot a jazyk DAX. 1. vyd. Pezinok: Smart People, s.r.o., 2018. 557 s. ISBN 978-80-9773078-0-6
MARR, B., How Can Project Managers Use Data Science?. [online]. [2022-11-18]. Available on internet: https://www.datasciencecentral.com/how-can-project-managers-use-data-science/
Microsoft, Power BI service description. [online]. [2022-11-18]. Available on internet: https://learn.microsoft.com/en-us/office365/servicedescriptions/power-bi-service-description
Microsoft, Predchádzajúce mesačné aktualizácie Power BI Desktop a služba Power BI. [online]. [2022-11-18]. Available on internet: https://learn.microsoft.com/sk-sk/power-bi/fundamentals/desktop-latest-update?tabs=powerbi-desktop
Overview of Managerial Decision-Making. [online]. [2022-11-18]. Available on internet: https://openstax.org/books/principles-management/pages/2-1-overview-of-managerial-decision-making
PETROV, CH., 25+ Impressive Big Data Statistics for 2022. [online]. [2022-11-18]. Available on internet: https://techjury.net/blog/big-data-statistics/#gref
PONIŠČIAKOVÁ, O., GOGOLOVÁ, M. 2017. Podnikový controlling, 1. vyd. Žilinská univerzita v Žiline / EDIS – vydavateľstvo ŽU v Žiline 2017. 219 s. ISBN 978-80-554-1320- 4
Power BI Ideas. [online]. [2022-11-18]. Available on internet: https://ideas.powerbi.com/ideas/
PRATT, M., FRUHLINGER, J., What is business intelligence? Transforming data into business insights. [online]. [2022-11-18]. Available on internet: https://www.cio.com/article/2439504/business-intelligence-definition-and-solutions.html
RADACAD, Power BI Desktop Download or Microsoft Store App? Which One? [online]. [2022-11-18]. Available on internet: https://radacad.com/power-bi-desktop-download-or-microsoft-store-app-which-one
SEDLÁK, M. a kol.: Manažment. Bratislava, Elita: 2000, ISBN 80-8044-014-8
ŠOLJAKOVÁ, L., FIBÍROVÁ, J., Reporting. 3. rozš. a aktualiz. vyd. Praha: Grada, 2010. 221 s. ISBN 978-80-247-2759-2
The Importance of Data Analytics in an Organisation. [online]. [2022-11-18]. Available on internet: https://www.isaca.org/membership/membership-benefits/benefits-partner-content/career-guidance-articles/the-importance-of-data-analytics-in-an-organisation
Volume of data/information created, captured, copied, and consumed worldwide from 2010 to 2020, with forecasts from 2021 to 2025 (in zettabytes) [Graph], IDC, & Statista, June 7, 2021. [Online]. Available: https://www.statista.com/statistics/871513/worldwide-data-created/