Volume 2024,
Article ID 172169,
Communications of the IBIMA,
15 pages,
DOI: https://doi.org/10.5171/2024.172169
Published date: 13 February 2024
Cite this Article as:
Myriel Fichtner and Stefan Jablonski (2024)," Applying Association Rules to Enhance Process Models through the Extraction of Relevant Process Details from Image Data", Communications of the IBIMA, Vol. 2024 (2024), Article ID 172169, https://doi.org/10.5171/2024.172169
To ensure successful process executions, process models must contain all important information for reflecting reality appropriately. This includes relevant process details (RPDs) which describe specifications or configurations of tasks affecting process success. However, RPDs are not always known in advance since they are hard to detect, even by process experts. Furthermore, RPDs are often not directly process-related but more context-related. Image data that are handled in a process have great potential to contain such hidden but crucial process information. Approaches that aim at identifying and extracting RPDs, e.g. from image data, mostly come with demanding prerequisites like the availability of large amounts of execution data. Consequently, these techniques prove impractical for the implementation in small enterprises, as such entities typically lack access to a sufficiently extensive dataset. In this paper, we demonstrate how RPDs can be extracted from images recorded during process execution by using Association Rule Mining (ARM) without the demand for huge input data. In an experimental setup, different ARM algorithms are evaluated in two use cases addressing pick-and-place scenarios from a real manufacturing process. The results confirm the effectiveness of the developed approach, demonstrating its suitability for smaller companies.
Keywords: Process Mining, Process Optimization, Manufacturing Process, Root Cause Analysis
Introduction
Process modeling is a well-established approach for documenting, standardizing, and visualizing workflows in various domains. However, designers frequently encounter difficulties in creating appropriate process models. Despite existing modeling guidelines, like for example presented by Corradini et al. (2018) or Mendling et al. (2010), they lack explicit guidance on the appropriate granularity and level of detail. Consequently, modelers are confronted with making informed decisions about what process aspects should be included. This topic is also discussed in Kluza et al. (2013) and Rosemann et al. (2012). In addition, modelers must concurrently consider that overloaded models are not readable and slow down the execution of work steps (Polyvyanyy et al., 2008; Reichert et al., 2012). Therefore, they aim for a certain level of abstraction while accepting the loss of information by omitting process details. These may include relevant process information whose significance is unknown during the modeling stage (e.g., due to lack of process expertise (Fichtner et al., 2022; Niedermann et al., 2010)). Furthermore, the practical experience gained from industrial projects yielded valuable insights, revealing that certain process details elude even field experts. Excluding relevant process details (RPDs) from process models results in inaccurate executions, diminishing overall process success (e.g., the quality of outcomes (Fichtner et al., 2021; Laue and Mendling, 2008)). Thereby, RPDs are mandatory parts of task specifications. For instance, they carry the information that specific positions of objects on a plate are relevant for the successful execution of pick-and-place tasks. To consider such crucial pieces of process knowledge in future executions, they must be identified and appropriately integrated into a model.
To address this issue, Fichtner et al. (2021, 2022) propose a first concept for extracting RPDs from images recorded during process execution. The authors employ explainable AI (XAI) to identify root causes for process deviations and generate RPDs based on this analysis. Although effective, their approach relies on certain assumptions. A primary challenge arises from the need for sufficient, i.e., a large amount of data to achieve reliable results, which is often lacking in real-world applications.
In this paper, we present an alternative approach to overcome previous limitations in a novel way. We propose to reveal RPDs, hidden in images, by employing Association Rule Mining (ARM) techniques. Our approach contributes to existing research in this field by (i) reducing prerequisites regarding data quantity while enhancing its applicability, and (ii) extending the scope of data mining techniques to the problem statement of extracting RPDs based on structured input data. To achieve these goals, we transform images into structured data and use association rules to mine RPDs. We extensively evaluate ARM algorithms with manufacturing domain data, confirming their applicability in this context.
Practical Example
To illustrate our approach, we are referring to a practical example throughout the remainder of this paper. The Metal Injection Molding (MIM) procedure serves as a tangible real-world process that is directly affected by the described problem statement. MIM is used to produce metal components with complex geometry (e.g., implants, surgical tools, engine parts) and has become an important manufacturing technology (Dehghan-Manshadi et al., 2020). It consists of various process steps to generate the final product from metal powder. For example, the so-called green parts, resulting from the “Injection Molding” step and containing a high-volume percentage of binder fluid, are put into a debinding furnace to remove most of the binder. The remaining binder is then removed from the resulting brown parts, using a sintering furnace. The placement of the parts on trays that are subsequently inserted into the furnaces is mainly executed manually by workers. Thereby, execution details like the position of the parts on the tray are crucial for process success: An even gas flow all around the parts and a uniform heat distribution within the furnaces are needed to fully remove the binder fluid. Remaining binder within parts leads to incorrect products with poor density and wrong sizes, unacceptable blisters or even cracks (Joens, 2005). This is a critical issue in process executions as uniform gas or heat distribution in furnaces is uncertain. Longer cycle times are needed to ensure binder removal from thick parts, increasing costs and potentially impacting small component quality. To mitigate this issue, a thorough analysis of furnace characteristics is necessary, i.e., the identification of areas with higher temperatures, to place larger components in these regions. Incorporating this information in process models enhances execution, leading to more efficient enterprise goal attainment. Nevertheless, such information, i.e., RPDs, is typically unknown initially (even to process experts) and needs to be determined. Process models usually just contain coarse instructions like “Place all parts on a tray”, while details on how to perform this task are not provided. Workers decide for themselves how to execute tasks, resulting in divergent executions and process outcomes. We harness these divergences to systematically investigate the association between execution characteristics and process success, enabling the effective identification of RPDs (Sec. 4).
The MIM process is just one example of problem scenarios where RPD analysis is crucial for process success. Its applicability extends to analogous pick-and-place or assembly tasks in diverse domains, including but not limited to packaging, electronics, robotics, and pharmaceutical enterprises. They underline the significance of this issue in enterprise processes, where manual executions, unknown alterations in the process environment, or modifications in preceding or subsequent process steps can lead to process variations. In this context, we have identified two key requirements:
Approaches for analyzing the causes of unsuccessful process outcomes are required, which – unlike existing methods, for example presented by our previous work in Fichtner et al. (2021) – can work effectively with limited execution data.
Analyses must not interfere with regular workflows, e., the employed technologies must not conflict with specific work steps to be effective. For instance, the use of electromagnetic sensors such as RFID tags (Stiefmeier et al., 2008) attached to objects is not feasible within the context of a sintering furnace.
In this paper, we present an approach that effectively addresses these issues by (i) employing ARM to overcome the challenge of limited data volumes, and (ii) utilizing non-intrusive cameras for collecting images of the workplace as a basis for the analysis, avoiding disruption to regular workflows and providing adaptability for deployment in diverse work environments.
Background and Related Work
Repositories often contain more information than anticipated, and data mining is employed to extract valuable knowledge (Zhao and Bhowmick, 2003). ARM is one well-known data mining technique, applied to discover correlations, associations, or frequent patterns among item sets in data repositories (Kotsiantis and Kanellopoulos, 2006). It finds applications in various domains, such as telecommunication networks, prediction, and risk management (Zhao and Bhowmick, 2003). An overview of different ARM algorithms can be found in Hipp et al. (2000). The Apriori algorithm is the most common algorithm in this context (Agrawal et al., 1994). In general, it determines the most frequently occurring sets of items in a repository and derives association rules from them. An association rule is an implication of the form X ⇒Y, where X, Y are sets of individual items called antecedent and consequent of a rule. To mine only interesting rules that reveal strong relations between items, certain constraints, i.e., support and confidence constraints, are usually determined. The support of a rule describes the relative frequency of the common occurrence of all items that appear in the rule and therefore corresponds to a statistical significance. Confidence measures the strength of a rule by determining the percentage of data sets which contain Y within the set of all data sets containing X. Such constraints define minimum thresholds that have to be exceeded by the generated rules. Besides, Han et al. (2011) present a set of measure indicators of association rules which can be used to evaluate generated rules, e.g., lift, conviction, cosine, imbalance ratio.
ARM solves problems like basket data analysis, classification, or clustering for different types of data in entirely different domains (Kumbhare and Chobe, 2014). For example, they can be employed to classify medical images by discovering frequent image patterns (Deshmukh and Bhosle, 2016). In Business Process Management, ARM is traditionally applied as a Process Mining technique to improve models by examining the execution order of process steps from event logs (Aalst, 2011). While they do not consider possible coherency with process perspectives, approaches as presented in Schönig et al. (2012) use ARM to discover cross-perspective collaborative patterns in process logs. Their work demonstrates the applicability of ARM for identifying additional process information in execution data that has not been captured within a model before. However, it focuses on dependencies between perspectives in process steps, whereas real-world settings require analyzing the correlation between process success and detailed process information (e.g., input/output parameters of process steps). Therefore, the inclusion of further data sources is crucial. According to Fichtner et al. (2022), we employ images for this purpose, as they are one of the most information-rich sources, providing great potentials for revealing new process knowledge (Kratsch et al., 2022; Schmidt et al., 2016). In this domain, other approaches such as Knoch et al. (2020) or Kratsch et al. (2022) extract activities from videos recorded during process execution to create process models. While their results prove the use of image data for this purpose, they mainly focus on deriving the control flow of a model. Further, they do not investigate the relationship of the discovered information with process success or failure, which we define as a crucial aspect to keep the readability of models and include only relevant information.
Mining Relevant Process Details with Association Rules
To better contextualize our contribution, we briefly present the main steps from our previous concept upon which our new approach is based (Fichtner et al., 2021). First, a set of tasks defined in a process model is determined that is suspected of missing RPDs. Then, each of these tasks is examined incrementally according to the following procedure:
The process model is executed, and execution data are collected, e.g., image data of how tasks are performed are recorded.
After a complete execution, these data are labeled regarding process success, i.e., the quality of the process outcome is assessed, and everything is stored in a database DB.
After sufficient data are collected, they are analyzed using classification techniques to extract RPDs r (will later be renamed to rruleas will be explained below) regarding the considered task.
Finally, r is transformed into human-readable information (i.e., task annotation), and the considered task is extended by it.
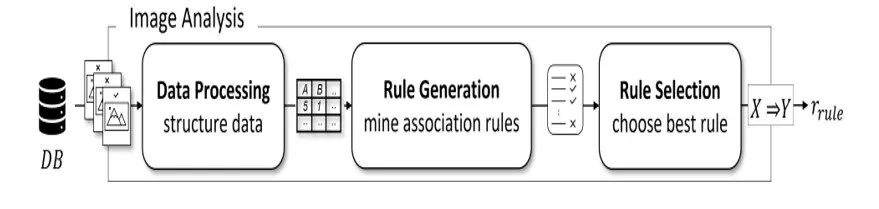
In previous work (Fichtner et al., 2022), we propose an approach based upon XAI to extract RPDs from images for the analysis (Step 3). Considering the analysis step from a data mining perspective, its key purpose is to find rules that reflect previously unknown but relevant information. This purpose is also common for ARM approaches. Besides, the suitability of such techniques on images and for classification problems has also been extensively demonstrated (Sec. 3). This inspired us to implement the analysis using an ARM-based approach while maintaining its integration into the procedure (Fig. 1). The overall input and output of the sub-process Image Analysis remain in our ARM-based approach semantically unchanged compared to our previous concept. Database DB is the input comprising a set of labeled images. The output is a set of RPDs r which, however, is in this approach represented as an association rule, denoted as rrule. In line with the definition of r in the former concept, rruleincludes both the causes of process deviations and the conditions necessary to avoid failures. In our new approach, this sub-process consists of three steps:
Figure 1: The implementation of the step Image Analysis using our ARM approach
Data Processing
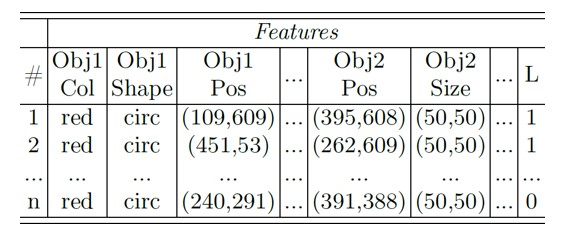
Structured data are a prerequisite for the application of ARM techniques. However, in our previous work (Fichtner et. al, 2022), the input data consist of unstructured images. To address this, we convert them into structured data through feature extraction. Lei et al. (1999) explain that features represent measurable characteristics of aspects, with distinctions in levels and perspectives. Low-level features can be extracted directly from images, while our work focuses on common ones, e.g., shape, size, color. We employ computer vision techniques to analyze each image with respect to parts, utilizing a chosen feature set. Thus, we retrieve values per feature which are stored accordingly. Using features such as size and color, a positive-labeled image can be described as a triple, e.g., (small, blue, 1), indicating the presence of a small blue part and resulting in successful process outcomes (1). The output of this step is a table (cf. Tab. 1) containing structured descriptions of input images.
Rule Generation
ARM algorithms require one-hot-encoded input data. For each occurring value of a categorical feature in the table resulting from the previous step, a binary column must be created. The value 1 in a column indicates that an image shows this feature value and 0 otherwise (Tab. 2). One- hot-encoding increases the number of columns of a table by a maximum of column with being the number of occurring values for all non-binary features FNB. This might lead to large tables negatively affecting performance and rule quality. Therefore, different discretization variants exist to aggregate values and reduce the number of columns (Sec. 5.2). The result of applying ARM algorithms to a one-hot-encoded table comprises a set of rules. To filter out less significant rules, a minimum confidence constraint is applied. Since we use association rules for classification purposes, only rules are useful where the feature linked to the label appears in their consequent; e.g., rules like (size = small) ⇒ (color = blue) are eliminated. From the remaining rules, we derive the impact of features on positive or negative process execution.
Table 1: Structured data after feature extraction data
Table 2: One-hot-encoded example
RuleSelection
The preceding step typically yields more than one rule. This is inadequate since we aim to generate concrete guidelines later being attached to process steps. Workers will have difficulties to resolve situations when confronted with situations involving two or more concurrent rules. For example, the following two rules might be identified:
(color = red) ⇒ (label = 1)
(shape = rectangular) ⇒ (label = 1)
Assuming that all available red parts are circular, a contradiction seems to arise. However, there is no contradiction since the two rules must not be logically connected by a conjunction (AND). Instead, both rules hold simultaneously but are independent from each other. Consequently, process participants face the challenge of selecting the most suitable rule, which can be a difficult and uncertain task. Thus, our approach selects the best rule that constitutes the output. The quality of a rule is determined by applying evaluation indicators, e.g., support, lift. A single rule is the relevant rule rrule: X ⇒Y with X being the RPD, if it is evaluated as best compared to others according to such a metric. For example:
(color = yellow) ⇒ (label = 1)
(color = blue) ⇒ (label = 1)
Consider applying the metric lift and that the first rule shows a higher value, then the analyzed RPD is yellow. Following our previous procedure in Fichtner et al. (2021), this information is then attached to a process model as task annotation in an intuitive and comprehensible way (see example in Section 6.). We extensively evaluated different representation formats regarding intuitiveness in Fichtner et al. (2022a).
Experiments
Based on the problem statement of the MIM process, two use cases are designed in (Fichtner et. al, 2022) describing pick-and-place tasks. To compare our new ARM-based approach to the former implementation of an XAI approach, we have adopted these use cases. We synthetically generated data based on a known predefined RPD, with the RPD varying per use case. The data are labeled accordingly, i.e., records containing the RPD are labeled positively (1), others are labeled negatively (0). All data used within our experiments are uploaded in our repository (https://anonymous.4open.science/r/arm_process_details_results-D8F1/). To benchmark the effectiveness of our approach, we use synthetic data, which allows us to control and examine factors such as noise and data volume effects on experiment results. We employ several ARM algorithms and assess their effectiveness in computing the relevant rule rrulecontaining the RPD by applying a set of evaluation criteria. The impact of noise and varying data quantity, as would be expected in a real data set, is evaluated in use case variants.
Use Cases
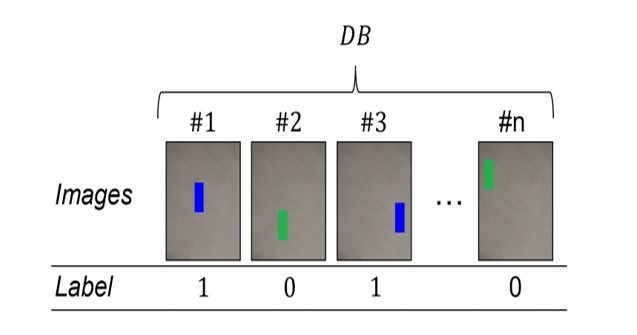
In a first use case (UC1), workers have to place one of two available parts on a tray. In our experiments, the parts differ only in their color. Since the process model does not provide further specifications, workers independently decide which part to place and where to place it on a tray. In the MIM process, the color of the parts can give an indication into the moisture content and the level of binder fluid absorption. Inspired by this physical condition, we define that the color of the part corresponds to an RPD. Scenes with blue parts result in positive outcomes, while those with green parts are labeled negatively (Fig. 2). Parts can be placed anywhere but must be fully visible. The images and the corresponding label are converted into a structured representation (Tab. 3). This is done by analyzing the images using object recognition techniques concerning a set of object-related features, i.e., color, shape, size, and position (centroid). The feature space is not restricted, so any domain-specific features can be considered. The here selected elementary features establish the groundwork upon which (i) more intricate analyses can be constructed, and (ii) they can be seamlessly transposed into domain-specific features. While the decision for these features is motivated by a scenario from the manufacturing domain, they are commonly employed in various other domains, including but not limited to robotics and healthcare (Deshmukh and Bhosle, 2016; Di Stefano and Mattoccia, 2002; Fichtner et al., 2023; Riedelbauch and Sucker, 2022). Importantly, incorporating more complex features does not hinder our approach, as adjustments are primarily needed in the feature extraction methods, while other steps remain unchanged.
In UC1, our objective is to investigate whether rrule: (′Color = blue′) ⇒ (′Label = 1′) can be found. We implement different settings to reflect the impact of certain factors. For variant v1.1, we generate 500 images and assume noiseless results of the computer vision-based feature extraction. The number of positive and negative labeled images is the same (250 per class). Variant v1.2 includes changing lighting conditions and considers noise on the feature size of up to 5 pixels. Variant v1.3 corresponds to v1.1 but with a reduced sample size to 100 images. Variant v1.4 considers an unequal distribution of the images for v1.1, i.e., only 1/3 of all data is labeled positively.
Figure 2: Image data of UC1
Table 3: Structured data of UC1
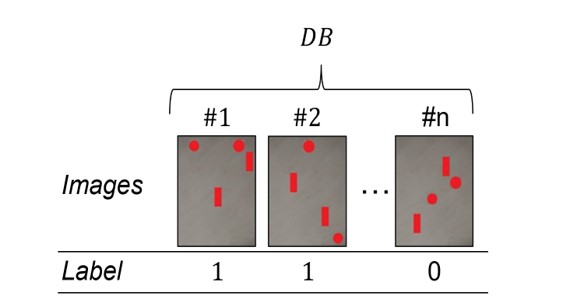
In the second use case (UC2), the task is again to place parts on a tray. Unlike UC1, this case specifies the number of parts but again not their exact placement on the tray (Fig. 3). The RPD refers to constellations that at least one circular part has to be placed in the upper seventh of the tray. Therefore, two features, i.e., the shape and position, are crucial for process success. This is a typical issue arising in the MIM process due to uneven heat distribution within the sintering furnace. Certain parts with specific characteristics must be placed in hotter areas of the furnace to ensure complete removal of the binder fluid. Its augmented complexity (compared to UC1) involves adjustments solely within the feature extraction step. The scene has a size of 507x672 pixels while further information about all four parts is given in Tab. 4. Each feature appears four times but refers to a different part each time. The crucial task is to accurately identify and assign the parts in the images to their respective columns. This becomes challenging when the parts lack visible and unique identifiers, such as a coded tape or distinct features. So, we decide that the features shape and size (bounding box) together identify a part (Part 1: circular, 60x60; Part 2: circular, 50x50; Part 3 and 4: rectangular, 50x150). The specific assignment of Parts 3 and 4 is interchangeable as they share similar shape and size, but once assigned, it remains consistent for a given scene. Other features are then analyzed based on this assignment and recorded in the table for the respective part.
The desired rule is (′Positiony= [576, 642]′) ⇒ (′Label = 1′) if Positionyrefers to Part 1. If it refers to Part 2, the antecedent becomes (′Positiony= [576, 647]′). We consider two variants of UC2, with an equal distribution of positive to negative labeled images for both. Variant v2.1 comprises 500 images, and again noiseless results of the computer vision-based feature extraction are assumed. Variant v2.2 is identical but with a reduced sample size to 100 images.
Figure 3: Image data of UC2
Table 4: Structured data of UC2
Selected Algorithms
We implement a set of ARM algorithms for the experiments, chosen in accordance with the problem statement. Only algorithms that can cope with classification problems are considered. Further, due to the presence of quantitative attributes, they must cope with large databases containing numerical data.
FP-G. We implement the FP-Growth algorithm as described in Han et al. (2000). It is a standard algorithm that is faster than Apriori and is used in many applications, providing a good basis for comparison. FP-G is faster than Apriori and is more suitable for finding hidden patterns in large databases. It generates frequent item sets according to the user-defined minimum support minsupthreshold.
Quant. This algorithm is specifically developed for mining quantitative association rules and was introduced by Srikant and Agrawal (1996). It is promising for our use cases, as interval boundaries of the quantitative values are selected dynamically. Intervals are merged until a user- specified threshold (maxsup) is exceeded. This procedure reduces the size of the input table while computing important intervals automatically. The generation of interesting rules can be configured by an interest score R.
HyCli. The work of Xiong et al. (2003) provides an algorithm to mine hyperclique patterns. It relies on an objective measure (h-confidence) to identify strong affinity patterns. Patterns in databases can be found even at very low support thresholds.
GAR+. We deploy the evolutionary algorithm GAR-plus presented in Alvarez and Vazquez (2012). It discovers quantitative rules from large databases. A prior discretization of the domain of numeric attributes is not needed since the intervals are determined within the algorithm. Important parameters are, e.g., the number of generated rules nrand the selection probability of attributes for the initial population aprob. A starting point for generating the initial population is set by the parameter seed.
The implementation of a few more application components is required:
Discretization is a necessary step to convert data into a one-hot-encoded representation. It is already contained in some algorithms (Quant and GAR+); whereas for others, we implement a discretization that cuts the range of occurring values for a feature in equal-sized bins depending on a parameter intervals.
The set of rules generated by each algorithm is constrained by a minimum confidence minconf. We further reduce this set using the pruning approach of Bayardo et al. (2000). Unnecessarily complex rules are eliminated by specifying a minimum improvement constraint with a threshold minimp. We evaluate both variants for each algorithm and use case, i.e., with and without pruning (“pure”).
We consider the most common evaluation indicators described in Han et. al (2011) for the step Rule Selection: support, confidence, cosine, independent cosine, lift, conviction, imbalance ratio, and Kulczynksi.
Results
To compare the results and to reveal the applicability of the different ARM algorithms, we focus on four validation criteria:
Relevant Rule Discovery. We evaluate whether rruleis found at all or not. Typically, an algorithm identifies several rules as interesting, while we check whether rruleis found among all of them. This is a knockout criterion, i.e., if rruleis not found, the remaining criteria are no longer considered.
PercentageofNon-Discoveries. We find out what percentage of hyperparameter sets does not discover rrule. This reveals how the selection of an adequate hyperparameter set for an algorithm impacts mining success. Practically, if the percentage of “unsuccessful” hyperparameter sets is very high, it is difficult to apply the algorithm to find rrulein a new experiment. Reversely, a low percentage simplifies its application since most hyperparameter sets lead to success.
Number of Rules with positive Label. For a successful hyperparameter set, i.e., rruleis found, we count how many other rules are mined with positive class labels (′Label = 1′) in their consequent. When a single rule is found, the case is defined as optimal. Then, rruleis automatically identified.
Best Rule Selection. This criterion is crucial for the future deployment of our approach in scenarios where rruleis unknown. In such cases, we rely on common evaluation indicators (lift, etc.). If they consistently identify the same rule as the “best”, we can generally use them to identify rrule. If conflicting results arise, we cannot offer a universally applicable method to identify rrule.
We use Optuna developed by Akiba et al. (2019) to explore the hyperparameter space using a grid search. Each set of hyperparameter p is rated with 0, if rruleis not present, i.e., not part of the mined rule set, and otherwise. The value is the number of generated rules having the positive class (′Label = 1′) in their consequent for a hyperparameter set p. We find an optimal hyperparameter set for each use case and algorithm by formulating this procedure as maximization problem. If several hyperparameter sets return the maximum value, a random set is selected from them for closer examination (validation criteria “Number of Rules with positive Label” and “Best Rule Selection”). We explore the hyperparameter space in several trials per algorithm. We upload all results and detailed information about the search space in our repository.
Table 5: Results of all variants of UC1
Table 5 shows the results of the experiments concerning UC1. Regarding GAR+, we conduct additional evaluations to account for its non-deterministic nature, where results depend on a defined seed. For each variant, we evaluate the hyperparameter set that is assessed to be optimal in our initial configuration (seed = 17) with nine other randomly chosen seeds. The hyperparameter set is optimal in 27.5% of all cases. However, we accept this hyperparameter set to derive our results. Our goal is to provide an initial indication of the suitability of GAR+ for our purpose, but it is important to note that further studies are necessary to ensure fully reliable results.
For UC2 (Tab. 6), we slightly adapt the optimization function. We evaluate rules having a range of the y-position of Parts 1 or 2 in their antecedent that is within the ideal interval = [576, 642] (and [576, 647] resp.) as successful. For this purpose, we introduce a distance measure that indicates how far the found interval deviates from the ideal interval. We define . Then, d has a value between 0 and 1, while 1 refers to the result that the ideal interval is found. We adapt the rating to and select the highest value for d in a successful run.
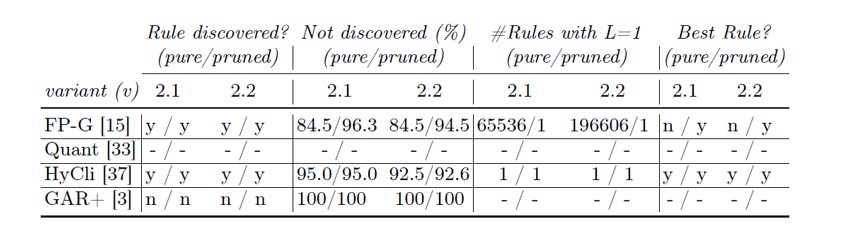
Table 6: Results of all variants of UC2
EvaluationandDiscussion
First, we consider the results of UC1. Both FP-G and Quant find rrulewithout pruning across all variants. They are particularly robust against hyperparameter changes but always generate competing rules, even in the optimal case. Pruning negatively affects the robustness of these algorithms, especially for FP-G, but improves the results for optimal cases (except for FP-G in v1.3). In contrast, HyCli and GAR+ always mine rruleas the only rule for an optimal hyperparameter set, but their robustness against parameter changes is subordinate. In all cases where the final rule set comprises multiple rules, the evaluation indicators do not support the selection of a rule. The indicators yield identical values for all extracted rules, which makes it impossible to determine rrule. We found that noise regarding one feature (v1.2) leads to marginally worse values. This indicates that the selected algorithms can be applied to images without sophisticated computer vision preprocessing. For a smaller data set (v1.3), FP-G and GAR+ cannot find rules when pruning is enabled. However, the results of variants v1.1 and v1.3 are similar in the case of all other algorithms, confirming our assumption that ARM techniques perform effectively on small data sets. Compared to the XAI approach in Fichtner et al. (2022), our approach requires only 10% of the data to uncover the RPD. For v1.4, we observe that the robustness of the algorithms against hyperparameter changes is strongly influenced by the distribution of labels, what should be considered when collecting data. In conclusion, all algorithms are suitable for UC1. However, HyCli (pure and pruned) performs best since, across all variants, its overall hyperparameter robustness is above average, and it finds rruleas the only rule.
For UC2, we observe that FP-G mines rrule but is not robust against hyperparameter changes. In pure cases, it generates a vast number of rules that strongly dilute the result. Evaluation indicators are again not supporting the identification of rrule. While hyperparameter robustness deteriorates even further when pruning is considered, rruleis found as the only rule for an optimal hyperparameter set. This highlights the significance of the pruning step for FP-G. Quant is excluded in UC2 since we could not find a hyperparameter set that generates results in adequate run time (< 24h). HyCli finds rrulein both variants but has a low hyperparameter robustness. However, for an optimal hyperparameter set, it mines rruleas the only rule with and without pruning. GAR+ is not able to find rrulein both variants. According to UC1, a smaller data set (v2.2) does not lead to significantly different results compared to v2.1. Concluding, HyCli also performs best for UC2, confirming the applicability of our approach even for more complex scenes. We want to emphasize that the mined rule explicitly refers to a specific part (Part 1 or 2). It provides information for improving a process model but does not cover the entire process detail. As defined, the latter contains the information that a circular part has to be placed. Thus, it is irrelevant whether Part 1 or 2 is placed. This information cannot be inferred from the mined rule anymore as it consistently pertains to a specific part. Since ARM approaches do not allow for the use of “or” statements, future work is required to explore ways to address this issue.
To complement the presentation of our overall approach, we shortly demonstrate how the identified rule rruleis further processed. We propose its use to enhance a coarse task description as “Place all parts on a tray” in UC2. As described above, we detect the rule for Part 1. However, directly adding it to the task description would not be suitable as it may be challenging for workers to interpret interval specifications of allowable position ranges. An additional step is required for translating a rule into a human readable form. For instance, the task description could be extended to “Place all parts on a tray & place one circular object in the upper seventh”. This transformation is not within the scope of this paper but guidance on how to further investigate this aspect can be found in Fichtner et al. (2022a), Reiter and Dale (2000), Strossa and Rauch (2003).
Conclusion and Future Work
We have shown that Association Rule Mining is a promising technique for discovering relevant process details from image data recorded in process environments. In two use cases based on a real manufacturing process, we successfully identified and extracted significant rules that contain relevant process information. The proposed approach augments existing enterprise modeling capabilities by extracting previously unknown process information from process data. It contributes significantly to small enterprises with limited data resources, leading to more efficient and cost-effective process executions compared to previous methods. Moreover, previous approaches are extended by introducing a specifically tailored concept for structured input data, along with a recommendation for its application in real-world settings. Our results provide valuable insights for practitioners in various industries and domains. Further research should explore which information should be covered by the input data to optimize the results and address further process perspectives. We plan to conduct experiments utilizing more intricate data sets derived from additional industrial configurations. Additionally, other techniques to support the rule selection should be considered to increase the accuracy of our approach.
Acknowledgements
We thank Josef Wuerf from the University of Bayreuth for helping us set up the implementation and supporting the evaluation of our work.
References
Agrawal, R., Srikant, R., et al. (1994): ‘Fast algorithms for mining association rules’, Proceedings of the 20th International Conference VLDB. vol. 1215, pp. 487–499. Santiago, Chile.
Akiba, T., Sano, S., Yanase, T., Ohta, T., Koyama, M. (2019): ‘Optuna: A next-generation hyperparameter optimization framework’, Proceedings of 25th ACM SIGKDD.
Alvarez, V.P., Vazquez, J.M. (2012): ‘An evolutionary algorithm to discover quantitative association rules from huge databases without the need for an a priori discretization’, Expert Systems w. Appl. 39(1), 585–593.
Bayardo, R.J., Agrawal, R., Gunopulos, D. (2000): ‘Constraint-based rule mining in large, dense databases’, Data mining and knowledge discovery 4, 217–240.
Corradini, F., et al. (2018): ‘A guidelines framework for understandable bpmn models’, Data & Knowledge Engineering 113, 129–154.
Dehghan-Manshadi, A., et al. (2020): ‘Metal injection moulding of surgical tools, biomaterials and medical devices: A review’, Powder Technology 364, 189–204.
Deshmukh, J., Bhosle, U. (2016): ‘Image mining using association rule for medical image dataset’, Procedia Computer Science 85, 117–124.
Di Stefano, L., Mattoccia, S. (2002): ‘Real-time stereo within the videt project’, Real-Time Imaging 8(5), 439–453.
Fichtner, M., Fichtner, U.A., Jablonski, S. (2022a): ‘An experimental study of intuitive representations of process task annotations’, International Conference on Cooperative Information Systems. pp. 311–321. Springer.
Fichtner, M., Schönig, S., Jablonski, S. (2021): ‘Using image mining techniques from a business process perspective’, In: EIS: 22nd Int. Conf. pp. 62–83. Springer.
, M., Schönig., S., Jablonski., S. (2022): ‘How lime explanation models can be used to extend business process models by relevant process details’, Proceedings of the 24th ICEIS. pp. 527–534. SciTePress.
Fichtner, M., Sucker, S., Riedelbauch, D., Jablonski, S., Henrich, D. (2023): ‘Enriching process models with relevant process details for flexible human-robot teaming’, 19th IEEE International Conference on Collaborative Computing. IEEE.
Han, J., Kamber, M., Pei, J. (2011): ‘Data mining: concepts and techniques’, Techniques (3rd ed), Morgan Kauffman.
Han, J., Pei, J., Yin, Y. (2000): ‘Mining frequent patterns without candidate generation’, ACM sigmod record 29(2), 1–12.
Hipp, , Güntzer, U., Nakhaeizadeh, G. (2000): ‘Algorithms for association rule mining—a general survey and comparison’, ACM sigkdd expl. newsletter 2(1), 58–64.
Joens, C. (2005): ‘Laminar gas flows ensure ’clean sweep’ in sintering’, Metal Powder Report 60(3), 52–55.
Kluza, K., Baran, M., Bobek, S., Nalepa, G.J. (2013): ‘Overview of recommendation techniques in business process modeling’, Proceedings of KESE9. pp. 46–57.
Knoch, S., Shreeraman P., Schwartz, T. (2020): ‘Video-to-model: Unsupervised trace extraction from videos for process discovery and conformance checking in manual assembly’, Business Process Management: 18th International Conference BPM 2020. Springer.
Kotsiantis, S., Kanellopoulos, D. (2006): ‘Association rules mining: A recent overview’, GESTS Int. Transactions on Computer Science and Eng. 32(1), 71–82.
Kratsch, W., König, F., and Röglinger, M. (2022): ‘Shedding light on blind spots–developing a reference architecture to leverage video data for process mining’, Decision Support Systems, 158, 113794.
Laue, R., Mendling, J. (2008): ‘The impact of structuredness on error probability of process models’, Information Systems and e-Business Technologies: 2nd International United Information Systems Conference UNISCON 2008. pp. 585–590. Springer.
Lei, B., Hendriks, E.A., Reinders, M. (1999): ‘On feature extraction from images. MCCWS project, Information and Communication’, Theory Group TUDelft.
Mendling, , Reijers, H.A., van der Aalst, W.M. (2010): ‘Seven process modeling guidelines (7pmg)’, Information and software technology 52(2), 127–136.
Niedermann, F., Radeschütz, S., Mitschang, B. (2010): ‘Deep business optimization: A platform for automated process optimization’, Proceedings of ISSS and BPSC.
Polyvyanyy, A., Smirnov, S., Weske, M. (2008): ‘Process model abstraction: A slider approach’, 12th International IEEE Enterprise Distributed Object Computing Conference, pp. 325–331.
Reichert, , et al. (2012): ‘Enabling personalized visualization of large business processes through parameterizable views’, Proceedings of the 27th ACM Symposium on Applied Computing.
Reiter, E., Dale, R. (2000): ‘Building Natural Language Generation Systems. Building Natural Language Generation Systems’, Cambridge University Press.
Riedelbauch, D., Sucker, S. (2022): ‘Visual programming of robot tasks with product and process variety’, MHI Colloquium. pp. 241–252.
Rosemann, M., Schwegmann, A., Delfmann, P. (2012): ‘Vorbereitung der Prozessmodellierung’, pp. 47–111. Springer Berlin Heidelberg, Berlin, Heidelberg.
Schmidt, R., et al. (2016): ‘Potentials of image mining for business process management’, Proceedings of the 8th KES-IDT. pp. 429–440. Springer.
Schönig, , Zeising, M., Jablonski, S. (2012): ‘Adapting association rule mining to discover patterns of collaboration in process logs’, 8th Collaborate Com. pp. 531–534.
Srikant, R., Agrawal, R. (1996): ‘Mining quantitative association rules in large relational tables’, Proceedings of the 1996 ACM SIGMOD. pp. 1–12.
Stiefmeier, T., Roggen, D., Ogris, G., Lukowicz, P., Tröster, G. (2008): ‘Wearable activity tracking in car manufacturing’, IEEE Pervasive Computing 7(2), 42–50.
Strossa, P. and Rauch, J. (2003): ‘Converting association rules into natural language — an attempt’, Kłopotek, M.A., Wierzchoń, S.T., Trojanowski, K. (eds.) Intelligent Information Processing and Web Mining. Springer Berlin Heidelberg.
Van Der Aalst, W. (2011): ‘Process mining: discovery, conformance and enhancement of business processes’, vol. 2. Springer.
Xiong, H., Tan, P.N., Kumar, V. (2003): ‘Mining strong affinity association patterns in data sets with skewed support distribution’, 3rd ICDM. pp. 387–394.