Faculty of Cybernetics, Military University of Technology, Warsaw, Poland
Volume 2024,
Article ID 179634,
Communications of the IBIMA,
14 pages,
DOI: https://doi.org/10.5171/2024.179634
Received date: 26 March 2024; Accepted date: 10 June 2024; Published date: 12 July 2024
Academic Editor: Monika Hadaś-Dyduch
Cite this Article as:
Michal BRYLA and Rafal KASPRZYK (2024)," The Impact of Information Authenticity on the Dissemination of News in Social Media", Communications of the IBIMA, Vol. 2024 (2024), Article ID 179634, https://doi.org/10.5171/2024.179634
The rise of social platforms enabling widespread information dissemination has led to an increase in threats related to disinformation attacks. Addressing these threats is crucial for ensuring access to credible information and maintaining social stability. To this end, enhancing current methods and developing new solutions aimed at ensuring safety in the digital environment is essential. In the pursuit of identifying features determining the truthfulness of disseminated information, research has primarily focused on analyzing content, stylistic means, and other linguistic aspects. To a lesser extent, the propagation process itself and the associated graphs illustrating its scope and dynamics have been examined, which can also significantly influence the truthfulness of information. To explain and counteract complex phenomena dependent on numerous factors, a multifaceted approach is crucial. This approach should encompass as many relevant areas as possible, allowing for a broader understanding of the problem and the development of countermeasures that pose a more challenging obstacle to subsequent disinformation efforts. By integrating content analysis with the study of propagation dynamics, researchers can develop more robust tools to detect and counter disinformation campaigns effectively. The conducted study focused on the statistical analysis of datasets derived from information propagation graphs. Various statistics, such as node centrality measures and network parameters, were utilized to provide insights into the network structure. The results support the hypothesis that the truthfulness of news influences the dissemination process in virtual social networks. These emerging differences can be utilized to develop solutions to detect and counter disinformation campaigns.
Keywords: social media, information dissemination, fake news
Introduction
The increasing significance of social media, which for some users becomes the primary source of information without verification from other sources, is highlighted in the Digital 2023: Global Overview Report prepared by Simon Kemp. The report indicates that over 4.76 billion users (59.4% of the population) are actively using social media. Another source confirming the importance of social media today is the statistics included in the Reuters Institute Digital News Report 2023, where the following results were obtained:
In 2023, 22% of respondents cited news websites as their main source of information, while 30% pointed to social media.
In the week preceding the survey, 52% of people aged 35 and over sought information directly from news portals, while only 24% in the 18-24 age group did so.
56% of respondents are troubled by determining which information is true and which is false.
Despite the many benefits, the availability of social media also has a downside. An environment has been created where individuals or groups can influence social opinions, the economy, and politics – actions in virtual social networks have a significant impact on the real world. In response to this threat, social media providers are compelled to control disinformation activities and prevent their development before serious harm is done. In response to these needs, solutions proposed by many researchers are seeking methods to identify fake news quickly and accurately.
Fake News Detection Methods
Currently, research is being conducted that can be divided into four groups of solutions. Each of them has its own advantages and disadvantages. An important aspect of solutions that may be applied in the future is the ability to quickly analyze a vast number of messages due to the informational noise present in social media. The division is specified as:
Manual credibility verification – a method based on the knowledge of a narrow group of experts or statistical research on many individuals to determine whether the information being examined is credible, true. Relying on experts, the main advantage of this method is the high certainty of results due to the expert knowledge of the specialist group. However, with the enormous amount of data currently being generated on social media, it is not possible for such teams to analyze, and, additionally, the costs of this method are high. On the other hand, relying on statistical data requires the rejection of unreliable individuals, selection of equal numbers of individuals with different views, etc.,
Automatic credibility verification – limitations associated with the amount of processed data have forced automation – in this case, it has been based on artificial intelligence algorithms such as natural language processing, machine learning, or neural networks. They focus on classifying information based on details, distinguishing features of false content.
Style and linguistic means analysis – like the above method, it also uses machine learning techniques, but it omits focusing on the content of the information being conveyed and instead utilizes differences in linguistic means, which often differ in false information.
Information propagation path analysis – another proposed approach is to completely ignore the content of the information being analyzed and only obtain information on how it spread in the information environment. This way, a tree-like structure is obtained, with the root being the author, and subsequent nodes being successive shares of information. Studies have shown that graphs generated in this way differ depending on the truthfulness of the news.
Virtual Social Communities
Understanding how information spreads between users necessitates a deep comprehension of the intricate structures that social groups form. These structures often lie somewhere on a spectrum between regular graphs and random graphs, each offering unique insights into the dynamics of information dissemination.
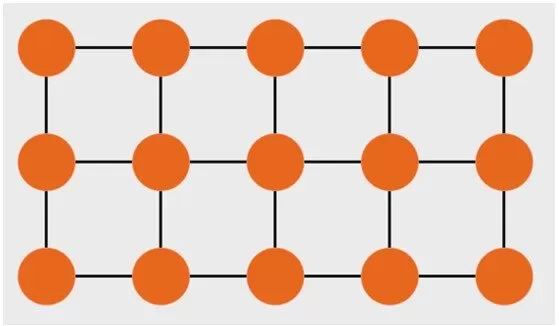
In a regular graph, such as a grid or a ring network, each vertex maintains an identical degree of connectivity. Regular graphs showcase a certain level of orderliness, where individuals are interconnected in a structured manner, akin to the familial or professional networks prevalent in society.
On the other hand, random graphs are created by connecting vertices randomly with a certain probability. This randomness mirrors the unpredictability often observed in the diffusion of information across larger, diverse, social networks, where interactions may occur sporadically and without a discernible pattern.
Figure 1. Grid graph
Caveman graph
The first groups of people to organize created structures closed to external contacts, which ensured safety from the unknown. They are most often described as a caveman model where interactions with external groups were limited, if not entirely absent, with only select individuals serving as intermediaries or ambassadors to other communities. Such isolation served both protective and strategic purposes, shielding the group from potential threats while also allowing for the cultivation of unique cultural practices and traditions within the closed community.
Figure 2. Caveman graph
Random Graph
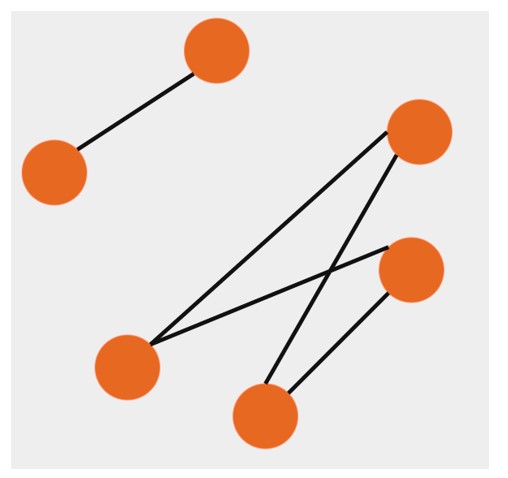
A random graph is a network model that incorporates random parameters. One of the most common examples is the E-R model, proposed by Paul Erdős and Alfred Rényi (1959). This model is characterized by the assumption that each pair of vertices can be connected with a probability p.
Figure 3. Random graph
Small World
Further considerations have shown that real-world networks cannot be entirely described by regular and random graphs. Due to this fact, Duncan Watts and Steven Strogatz (1998) introduced the Small World model. This model incorporates short average path lengths and high clustering, which are noticeable features in social networks.
Scale Free
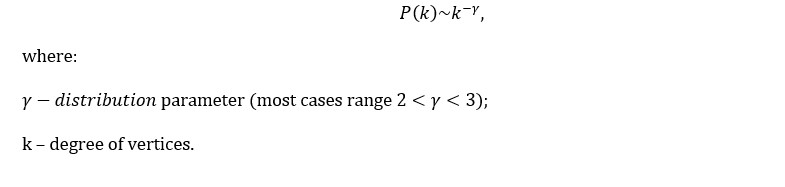
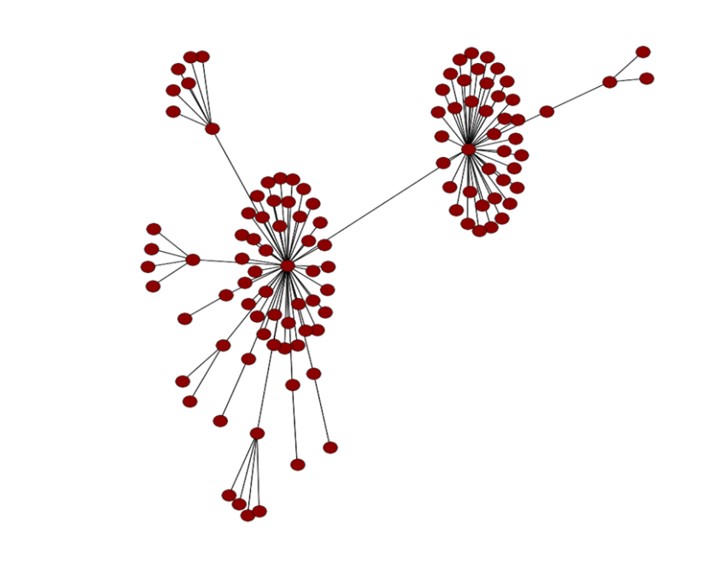
A Scale-Free model represents a network with a power-law distribution of vertices’ degrees. Albert-László Barabási and Albert Réka (1999) introduced the Scale-Free network generation algorithm based on the preferential attachment mechanism. Their model provides an explanation for the existence of nodes with unusually high degrees (hubs). According to preferential attachment, the degree distribution is as follows:
Figure 4. Scale Free network
News Propagation Models
Researchers examining social networks have presented various possibilities for describing the process of information dissemination and communication among people. In this way, two groups of propagation models have emerged: epidemiological models (named after models describing the process of disease development) and opinion dynamics. The complexity of the information exchange phenomenon and the necessity of considering multiple factors closely related to human behavior significantly hinder the development of a model.
Model SI
The base and the first of the proposed models for information propagation was an adaptation of the SI models. Originally developed by W. O. Kermack (1927), it is based on dividing the population into two subsets. The first subset consists of healthy individuals susceptible to infection, denoted as S (susceptible) in English. The second subset contains the infected part of the population (infectious). During each iteration, there is a possibility that a node marked as S, after contact with an individual I, will become infected with a probability of β. Once infected, it cannot change its state. The only possible transition between subsets is S -> I.
Figure 5. SI model diagram
Model Threshold
The model presented in by M. Granovetter (1978) in the publication “Threshold Models of Collective Behavior” is based on two possible states adopted by each vertex (individual in the group). The determinant coefficient for which state a particular node should be in is determined by the number or proportion of decisions made by the rest of the population. Everyone may have a different threshold, which is determined considering a set of parameters. This model is most used to model behaviors of various collectives, such as animal or human populations. In general, the algorithm is based on two steps:
Establishing a threshold for everyone in the population.
In successive iterations, vertices change their state if the number/coefficient of infected neighbors is higher than the threshold of the given node.
Model Voter
The Voter model was originally introduced to analyze competition between species. It is one of the simplest models belonging to opinion dynamics and was presented in 1975 by Richard A. Holley and Thomas M. Liggett. The name comes from its application in estimating election results. It is based on two fundamental assumptions:
At the initial stage, everyone in the population holds one of the possible discrete values, s = ±1.
At each time step iteration, a random node is selected, along with one of its neighbors j, whose opinion is adopted.
Model Sznajd
The Sznajd model, also known as “United We Stand, Divided We Fall” (USDF), was proposed in 2000. It is based on the principle of social validation, which assumes that, if a group of individuals shares a certain opinion, it has a greater influence on its neighbors than individual dissenting opinions. The model is based on the following conditions:
Initially, the entire population adopts random opinions s=±1.
In each subsequent iteration, two neighboring vertices, i and j, are randomly selected. If they share the same opinion, the neighbors of this pair receive the same opinion.
Datasets
To conduct the research, it was necessary to acquire data representing graphs generated from the information propagation process. Despite the abundance of resources used in the fight against fake news, few of them focus on the propagation process or the structures emerging within it. Nevertheless, over 9000 graphs were collected from publicly available sources.
Twitter 15 and Twitter 16
Dataset comes from publications:
Title: Real-time Rumor Debunking on Twitter
Authors: Liu, Xiaomo and Nourbakhsh, Armineh and Li, Quanzhi and Fang, Rui and Shah, Sameena
Title: Detecting Rumors from Microblogs with Recurrent Neural Networks
Authors: Ma, Jing and Gao, Wei and Mitra, Prasenjit and Kwon, Sejeong and Jansen, Bernard J. and Wong, Kam-Fai and Meeyoung, Cha
Politifact and Gossipcop
Dataset comes from publications:
Title: FakeNewsNet: A Data Repository with News Content, Social Context and Dynamic Information for Studying Fake News on Social Media
Authors: Shu, Kai and Mahudeswaran, Deepak and Wang, Suhang and Lee, Dongwon and Liu, Huan
Title: Fake News Detection on Social Media: A Data Mining Perspective
Authors: Shu, Kai and Sliva, Amy and Wang, Suhang and Tang, Jiliang and Liu, Huan
Title: Exploiting Tri-Relationship for Fake News Detection
Authors: Shu, Kai and Wang, Suhang and Liu, Huan
Pheme rumor dataset:
Dataset comes from publications:
Title: PHEME rumor scheme dataset: journalism use case
Authors: Zubiaga, Arkaitz; Liakata, Maria; Procter, Rob; Wong Sak Hoi, Geraldine; Tolmie, Peter
To provide the analysis of data from various datasets, it was necessary to prepare and transform the data into the appropriate format. As part of dataset preparation, the following steps were undertaken:
Removed values described on the vertices, transforming networks into graphs (they were not necessary for further considerations).
Balanced the number of graphs based on true and false information.
Converted files of different formats (CSV, JSON) into one, utilizing the interpretation of graphs from the NetworkX library.
Removed incomplete graphs.
Thanks to these actions, further work and the conduct of objective data analysis became possible. Prepared dataset consisted of 9220 (4610 fake news and 4610 real news) graphs. There were graphs with varying numbers of nodes, ranging from widely propagated information to less propagated ones. The following chart illustrates examples of graphs.
The process of comparing graphs and their vertices to analyze the propagation of fake news involves a multi-faceted approach. Initially, some metrics are calculated to capture different aspects of the graph structure and vertex properties. These metrics include:
general graph prosperities such as nodes count, graph density,
community based metrics like clustering coefficient or communities count,
centrality metrics – degree centrality, betweenness centrality etc.
Once the metrics are computed for each graph, average values are derived to summarize the characteristics of the graphs and compare them effectively between fake news and real ones. The comparison of individual properties is presented in the charts below:
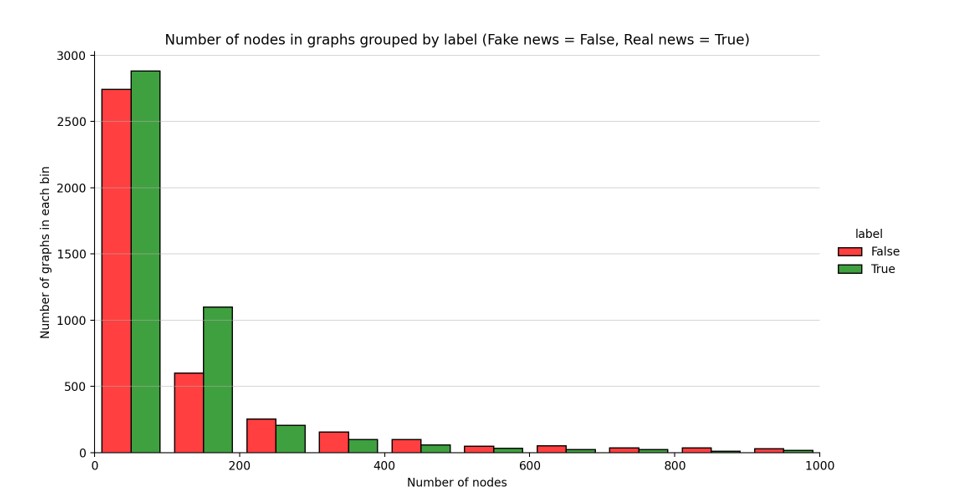
Nodes count
The nodes count is a fundamental metric of a graph and usually influences other graph algorithms and analyses. Within the context under examination, the nodes represent individual users engaged in the reposting of news.
Figure 8. Number of nodes in graphs grouped by label
The observation indicates a trend in the generation of graphs concerning the source of information. In graphs with a smaller number of nodes (up to 200), more were created using authentic information. This suggests that real news tends to reach fewer users. Conversely, as the number of nodes in the graphs increased beyond 300, there was a noticeable shift towards graphs built upon fake news. This shift could be attributed to the ease of propagation of misinformation.
Maximum depth
Tree depth, in the context of a tree data structure, refers to the length of the longest path from the root node to a leaf node. In simpler terms, it measures the maximum number of edges that must be traversed from the root of the tree to reach any of its leaves.
Figure 9. Depth in graphs grouped by label
The observation implies a correlation between the depth of the graphs, representing the extent of information propagation, and the source of the information being propagated. Specifically, graphs with greater depth, indicating a longer chain of information dissemination, were found to be more prevalent in scenarios where false information was being spread. The implication is that once false information enters a network, it tends to circulate and be shared multiple times along various paths, amplifying its reach and impact.
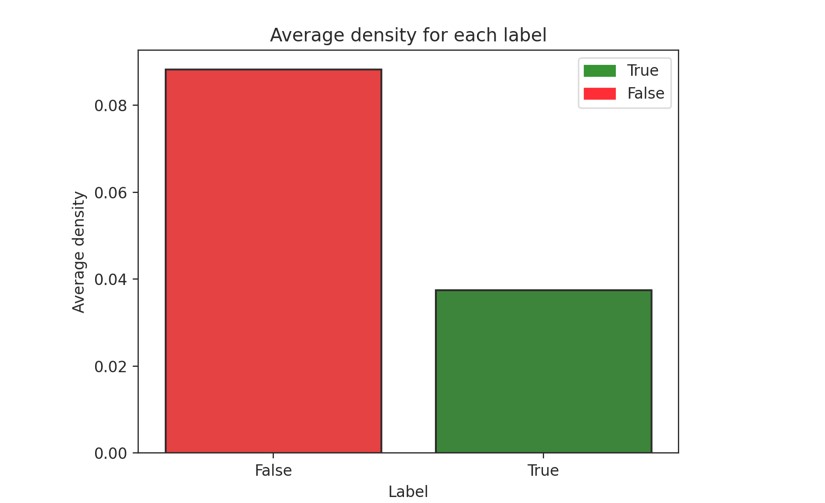
Graph Density
Graph density represents the ratio between the edges present in a graph and the maximum number of edges that the graph can contain. It is calculated by dividing the actual number of edges in the graph by the maximum number of edges possible in the graph. Graph density provides insight into the connectivity and sparsity of relationships among the elements represented by the vertices in the graph.
Figure 10. Average density for each label
The observation indicates a difference in the density values between graphs that propagate fake information and those that convey true information. Specifically, the average density of graphs associated with the propagation of false information was more than twice as high compared to graphs representing true information.
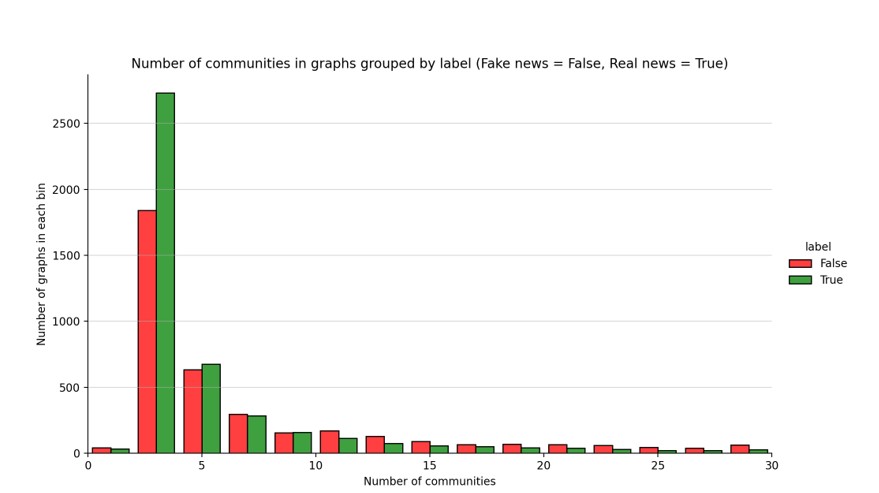
Communities Number
In graph theory, a “community” refers to a subgroup or cluster of nodes within a larger graph that are more densely connected to each other than to nodes outside of the subgroup. Communities in graphs often represent cohesive groups or modules where nodes share similar properties, interests, or functions.
Figure 11. Number of communities in graphs grouped by label
Graphs representing the spread of true information tend to exhibit fewer communities compared to graphs propagating false information. This phenomenon suggests that true information may result in a more homogeneous spread with fewer distinct clusters or communities. On the other hand, false information led to the formation of more fragmented communities within the network. The division into more communities may contribute to its wider dissemination as it can appeal to various subgroups within the network.
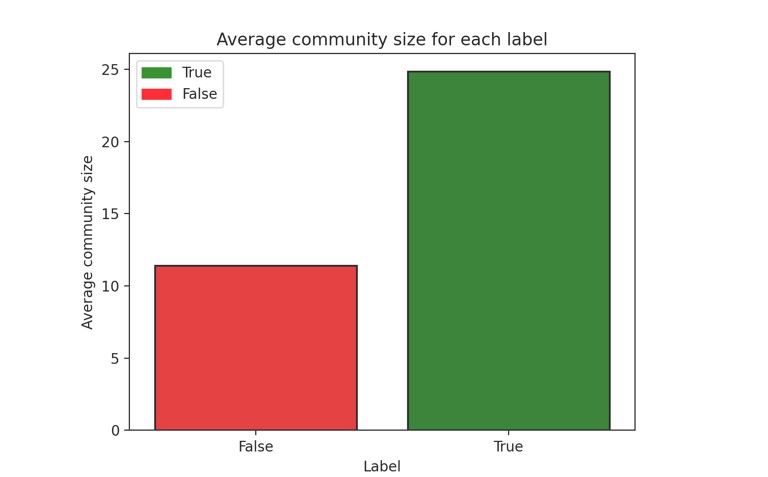
Size of community
The size of a community in the context of graphs refers to the number of nodes contained within a specific community or group of nodes within the graph. It is a quantitative measure that informs us about the magnitude of a subgroup in the graph, which is more densely connected to each other than to nodes outside that group.
Figure 12. Average community size of each label
The observation suggests a notable contrast in the average size of communities between graphs associated with true and false information propagation. Specifically, graphs representing the spread of true information tend to exhibit communities characterized by a significantly higher average number of nodes compared to those representing false information.
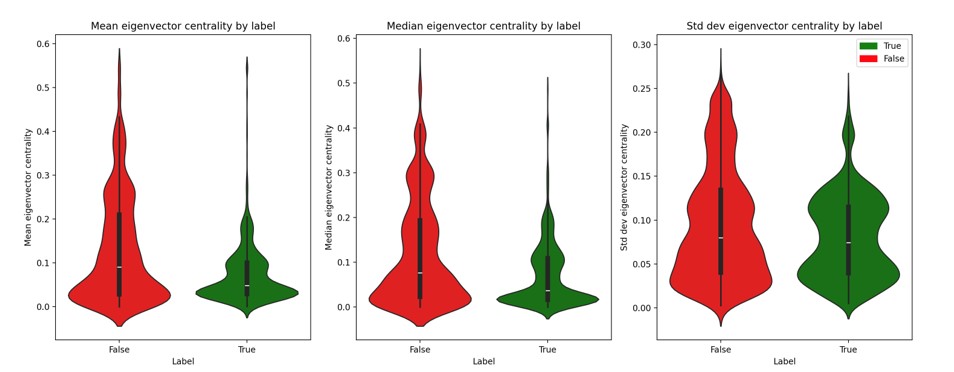
Eigenvector centrality
Another method for assessing the significance of a vertex in a network is through its prestige. In this approach, a node’s ranking rises as it establishes connections with other highly significant vertices. Unlike merely counting connections, this measure prioritizes the importance of connected nodes. This concept mirrors aspects of everyday life. Prestige measurement expands upon the basic degree measure by assigning a score that reflects the cumulative importance of neighboring nodes, based on their own degree measures. The value of eigenvector centrality for the i-th node can be presented by:
Figure 13. Eigenvector centrality by label
The difference observed on the graph suggests that in graphs constructed based on fake information, a greater number of nodes have elevated prestige values. This is because such graphs contain more important nodes, and, consequently, more nodes are connected to them. On the other hand, in graphs based on true information, there is a lower average prestige value, indicating fewer important nodes in the graph.
Pagerank
Pagerank is a ranking of the nodes in graph G based on the structure of the edges. Originally designed as a way to rank web pages. It is an algorithm used to evaluate the importance of nodes within a graph, particularly in the context of web pages and hyperlink structures. Calculated as a measure of the relative importance of nodes based on the structure of the graph and the relationships between nodes. The algorithm assigns each node a score, representing the probability that a random walker traversing the graph will encounter that node. Nodes with higher PageRank scores are considered more influential or central within the network.
Figure 14. Pagerank by label
Similarly, to eigenvector centrality, in graphs constructed based on false information, there are more highly rated nodes having significant influence within the network, disseminating information to a greater number of individuals.
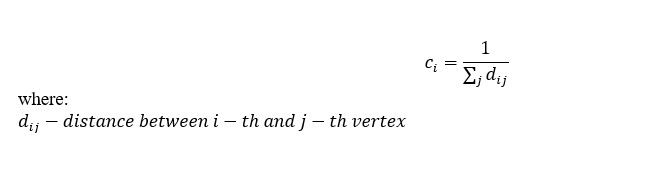
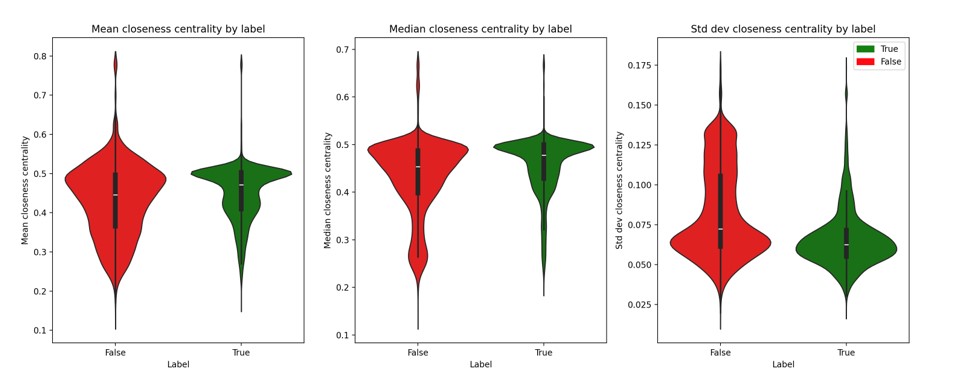
Closeness Centrality
The vertex with the highest closeness centrality is the one with the shortest average distance to all other nodes in the network. In terms of information dissemination, this metric identifies the vertex from which information can reach all other nodes in the shortest time. However, calculating this measure becomes challenging when the network contains disconnected components, as some nodes lack connections. The value of closeness centrality for the i-th node can be presented by:
Figure 15. Closeness centrality by label
Graphs created by fake information have more hub’s nodes (nodes with a high degree, i.e., many connections). This is why there are more nodes with elevated closeness centrality.
Conclusion
The analysis of graph properties in networks representing the propagation of both true and false information reveals significant insights into information dissemination. The prevalence of hub nodes and those with elevated centrality metrics, such as closeness or eigenvector centrality, in graphs associated with false information underscores the potent attraction of misinformation in capturing audience attention and swiftly spreading through networks. These influential nodes serve as pivotal conduits for the dissemination of false information, thereby amplifying its reach and impact within the network. The observation of higher prestige values, increased density, and community sizes in graphs depicting the propagation of fake news suggests a clustering effect, wherein false narratives tend to foster the formation of fragmented communities within the network. This phenomenon highlights how disinformation can create tightly knit clusters, thereby facilitating its rapid dissemination, while true information often cultivates larger, more cohesive, communities with lower densities. In this way, it has been demonstrated that there are certain distinct patterns that can be subjected to further analysis.
The classification of propagation networks generated during the dissemination process is less explored compared to solutions focused on the content of the information itself. Research provided by Zhao et al (2018), published in the article “Fake news propagates differently from real news even at early stages of spreading”, highlights features that differ between fake and real news, particularly in the initial stages of dissemination. However, these studies utilize smaller datasets and examine other network features based on propagation time, target distance, network layers, and heterogeneity. Expanding the scope of the parameters considered will contribute significantly to our understanding of how fake news spreads and how it can be effectively identified and countered. Both pieces of research align in their conclusions, highlighting differences in networks generated by true and fake information, which provides an opportunity to analyze this option in research focused on information classification and preventing disinformation.
Analyzing propagation graphs stemming from both authentic information and fake news entails a further exploration to pinpoint distinguishing features of each category. By scrutinizing dissemination patterns, researchers can discern subtle yet crucial distinctions essential for differentiating truth from falsehoods. Furthermore, pursuing solutions that lack additional attributes at the vertices enables the utilization of datasets devoid of node features. Consequently, more data can be accessed and supplied for research purposes. Such endeavors are crucial for refining classification techniques that rely on propagation structures, necessitating a focused approach to explore and prioritize new characteristics for accurate categorization. However, it’s important to acknowledge that the outlined results represent only a fraction of the comprehensive characteristics, with ongoing investigations continually integrating additional facets. These findings serve as foundational pillars guiding further research aimed at developing robust classification methods based on propagation structures.
References
Barabasi, A L. and Albert, R. (1999), ‘Emergence of Scaling in Random Networks’. Science, 286, 509-512.
Bartosiak, C., Kasprzyk, R., and Tarapata, Z. (2011), ‘Application of Graphs and Networks Similarity Measures for Analyzing Complex Networks’. Biuletyn Instytutu Systemów Informatycznych Selected full texts, 7, 1-7.
Borgatti, S P., Everett, M G., and Johnson, J C., (2018) Analyzing Social Networks, Sage.
Bryła, M., Huk, R., and Kasprzyk, R. (2021), ‘Modeling information dissemination in virtual social networks’ Proceedings of the 38th Inernational Business Information Management Association (IBIMA), ISBN: 978-0-9998551-7-1, November 2021, Seville, Spain.
Freeman, C L. (1977), ‘A Set of Measures of Centrality Based on Betweenness’. Sociometry, 40. 35-41.
Hagberg, A., Swart, P., and Chult D., (2008), ‘Exploring Network Structure, Dynamics, and Function Using NetworkX’ Proceedings of the 7th Python in Science Conference, 19-24 August 2008, Pasadena, California.
Kasprzyk, R., (2009), ‘The vaccination against epidemic spreading in Complex Networks’, Biuletyn Instytutu Systemów Informatycznych Selected full texts, 3, 39-43.
Kasprzyk, R., (2012), ‘Diffusion in Networks’. Journal of Telecommunications and Information Technology, 99-106.
Kasprzyk, R., (2020), ‘Mathematical Models of Information Operations’, Procedia Manufacturing, 44, 663-670.
Kemp S., (2023), ‘Digital 2023: Global overview report’. Datareportal. [Online], [Retrieved March 22, 2024], https://datareportal.com/reports/digital-2023-global-overview-report
Kumar, S., West, R., and Leskovec, J., (2016), ‘Disinformation on the Web: Impact, Characteristics, and Detection of Wikipedia Hoaxes’ Proceedings of the 25th International Conference on World Wide Web, 11-15 April 2016, Montreal, Canada.
Mehedi, T., Rahman, A., Kabir, A., and Islam, M., (2023), ‘A Review of Methodologies for Fake News Analysis’ IEEE Access, 99, 1.
Newman N., Fletcher R., and Eddy K., (2023), ‘Reuters Institute Digital News Report 2023’, University of Oxford. [Online], [Retrieved March 22, 2024], https://www.slideshare.net/vittorio.pasteris/digital-news-report-2023-259298995
Newman, M., (2010) Networks: An Introduction, Oxford University Press, New York, United States.
Sîrbu, A., Loreto, V., Servedio, V., and Tria, F., (2017), ‘Opinion Dynamics: Models, Extensions and External Effects’, Understanding Complex Systems.
Tarapata, Z., (2012), ‘Czy sieci rządzą światem? Od Eulera do Barabasiego (Do Networks Control the World? From Euler to Barabasi) ‘, Biuletyn Instytutu Systemów Informatycznych, 10, 31-51.
Zhao, Z., Zhao, J., Sano, Y., Levy, R., Takayasu, H., Takayasu, M., Daqing, L., and Havlin, S., (2018), ‘Fake news propagate differently from real news even at early stages of spreading’, EPJ Data Science, 9, 1.