Sara DANIALI1, Dmitrii RODIONOV2 and Farzin MOHAMMADBEIGI KHORTABI3
1,2Peter the Great St. Petersburg Polytechnic University, St. Petersburg, Russia
3State University of Management, Moscow, Russia
Volume 2020,
Article ID 799658,
IBIMA Business Review,
16 pages,
DOI: 10.5171/2020.799658
Received date: 28 February 2020; Accepted date: 11 August 2020; Published date: 24 November 2020
Academic Editor: Mitrovic Stanislav.
Cite this Article as:
Sara DANIALI, Dmitrii RODIONOV and Farzin MOHAMMADBEIGI KHORTABI (2020)," Periodizing Management’s Risks of Construction Projects with Gray Relational Analysis and FMEA Approach", IBIMA Business Review, Vol. 2020 (2020), Article ID 799658, DOI: 10.5171/2020.799658
Scientific research on risks of project management has little precedent and it lasted less than half a century from the first serious researches, but in the meantime, significant improvements have been made in the knowledge of risk management and project management. Although risk is unavoidable, if the risk is properly understood and managed, it can become a competitive advantage. The purpose of this research is to present a synthetic approach based on gray theory to evaluate the risks of construction project management. In this regard, this study deals with identifying and evaluating project management risks by using the gray entropy technique and analyzing the gray relationship with the FMEA approach. Therefore, the selected risks of construction projects have been periodized based on the mentioned methods.
Project management is an important tool in modern management, especially in large projects that require many skills, which are a set of processes that are used to carry out a successful project throughout its lifecycle (Ianenko, M. B., Badalov, L. A., Rovensky, Y. A., Bunich, G. A., & Gerasimova, E. B., 2018). According to the Project Management Body of Knowledge (PMBOK) standard, project management utilizes the knowledge, skills, tools and necessary techniques to carry out activities to meet the needs of the project through the use of initialing, planning, executing, controlling and closing processes. In other words, Project management is the art of directing and coordinating human and material resources throughout the life of a project by using modern management techniques to achieve predetermined objectives of scope, cost, time, quality and participation satisfaction (Wideman, l986). Risk management is also one of the ten knowledge areas that aim to maximize the results of positive events and minimize the occurrence probability or effect of adverse consequences on project objectives.
In project environments, project managers must have a thorough understanding of the concept and nature of risk. Although the objective of risk management is to optimize the projects, in practice, the approach of risk management executors is to increase safety and reliability in the system and to reduce the risks of the project (Borovkova, V., Borovkova, V., Boikova, U., & Testina, Y., 2019). The objective of the project risk management is to identify and manage risk for completing the project successfully (Kasap & Murat, 2007).
New trends in organization’s strategies, increased complexity of projects, and globalization have created new challenges for project-oriented organizations, including municipalities (Adamenko, A.A., Zolotukhina, E.B., Ulanov, V.A., Samoylova, E.S., Chizhankova, I.V., Mamatelashvilli, O.V., 2017). One of the most important characteristics of these challenges is uncertainty. In other words, if uncertainty does not exist, there will be no change. Projects as one of the most important business processes are subject to severe uncertainty caused by various sources (Rodionova E. A., Shvetsova O. A., EPSTEIN M. Z., 2018). Developed uncertainty management is considered to be a risk management whose major benefits include a balanced look at opportunities and threats, attention to uncertainty as the root of opportunities and threats, a broader view of the project by increasing time and environmental dimensions, its process-oriented approach, creating a suitable framework for a strategic look at the project, and creating an appropriate structure for entering concepts such as learning, knowledge management, and value management in project management processes. In other words, risk management sees a far-off horizon in the future and searches for the uncertain future to identify potential hazards and opportunities (Dvas G. V., Dubolazova Y. A., 2018). At present, municipalities are the most important institutions of urban affairs. Considering the role of Municipalities in Iran which are market-oriented and project-oriented institutions providing commercial and service spaces for the prosperity of economic activities such as business, administrative and production, the need for the application of project risk management and the identification of factors affecting the prosperity and stagnation of construction activities is more required than ever before. The case study which is put forward in this research is Yazd municipality. The Historic City of Yazd, with a unique Persian architecture, was listed in the UNESCO World Heritage on July 9, 2017 during the World Heritage Committee’s 41st session in Krakow, Poland.
The awareness of Decision-Making Units (DMU) performance, which is under the supervision of managers, is the most important task of management in relation to making appropriate decisions. Data Envelopment Analysis (DEA) is one of the most widely used models for assessing DMUs, which divides them into two efficient and inefficient categories. However, in most cases, due to the lack of complete information, managers and researchers cannot evaluate and rank the units accurately. One of the tools used in dealing with incomplete information is gray system theory (Markabi & Sarbijan, 2015). Gray Principal Component Analysis (GPCA) is a method that uses the benefits of gray theory (namely no need for data to be known and the use of inadequate data), the method of Principal Component Analysis (PCA) (namely reducing the dimensions of the variables and giving them the appropriate weight), and the multi-dimensional assessment.
Research background
Although many studies have been carried out on this subject, the root causes and the methods that solve the problem are still not well presented. The focus of past researches has been on the factors that are directly or indirectly related to the project environment, as well as the impact that these factors have on increasing the cost of the project. Scientific research on project management has little precedent and it lasted less than half a century from the first serious researches, but in the meantime, significant improvements have been made in the knowledge of project management. In the following section, the researches that have been conducted on project management and risks of project management are detailed, using gray entropy method and gray Relational Analysis (GRA).
Xing et al. (2009) tried to establish a method of risk assessment based on gray decision making. The result of their research shows that this method can provide valuable information to identify which is the most important factor in project build. Lauras et al. (2010) have developed an approach that can control and monitor the project performance by taking into account the factors and the indicators related to time, cost, scope, quality and risk. Doloi (2011) Studied “Understanding stakeholders’ perspective of cost estimation in project management”. Contrary to the old methods, which focused on the factors that are directly or indirectly related to the project environment and the impact of these factors on increasing the cost of the project, the purpose of this study was to create a conceptual model which expresses the important and prominent issues, that play the most important role in the life cycle of a project. A structured interview was conducted with a number of selected organizations and the collected data on the basis of interviews is presented in this study. Also, a software-based method were used to transform images into conceptual models and extract a scientific framework from them. The findings showed that political and legal factors at the beginning of the project play an important role in the development of the commercial sector of the project.
Hwang and Ng (2013) address the challenges of green construction projects which project managers have been able to handle well. Moreover, their work addresses the important areas of knowledge and skills that are needed to overcome such challenges. They provide a scientific basis in which project managers can execute sustainable projects efficiently and competitively. Aliverdi et al. (2013) conducted a research on monitoring project’s duration and cost in a construction project using statistical quality control charts. They stated that by using this method, it is possible to accurately measure the progress of the project and reveal all deviations from the cost and the estimated time of the project. The results were quite promising and not only competed with old methods but also improved the team knowledge about project performance. Finally, they concluded that the used methodology could significantly modify the project control program and improve the earned value technique. Mohammadi et al. (2012) used the GRA and DEA models to evaluate the suppliers in an Iranian industrial company. The main purpose of this article was to find the representative indicators to apply in the DEA model and investigate the role of these representative indicators (from inputs and outputs) to use in the DEA model. They calculated the efficiency of suppliers within the DEA model. Then, the relation between indicators (inputs and outputs) was identified to analyze the effects of the representative indicators using gray relational model. They concluded that the use of gray classification leads to a more accurate measurement of suppliers’ performance by using DEA, and thus, the resolution of DMUs increases. In Mohebian and Roghanian’s (2011) research, they presented a model that not only meets the criteria of time alone, but considers cost, risk and quality in determining the critical path. To find the critical path of the project, there should be an uncertainty about some of the project parameters (time, cost, etc.). Therefore, they used fuzzy theory to consider this uncertainty. Using the TCRQ coefficient (which consists of four factors of time, cost, risk and quality) determined by fuzzy entropy, the critical path was selected. In the end, they mentioned that for a timely completion of the project according to the specified budget, the focus should be on this path.
Sadeghi et al. (2009) presented an integrated model of value engineering and risk management for large construction projects. In this paper, while reviewing the evolution of integrated models of risk-value and finding out the reason for their existence, by reviewing, criticizing and categorizing the models that have been proposed so far, a new and innovative model of integration of value engineering and risk management in large construction projects has been presented. Kuo et al. (2008) used a gray-based Taguchi method to solve the multi-response simulation problem. The gray-based Taguchi method is based on the optimizing procedure of the Taguchi method, and adopts Gray Relational Analysis (GRA) to transfer multi-response problems into single-response problems. Their research illustrated that differences in performance of the proposed gray-based Taguchi method and other methods found in the literature were not significant. Razi (2014) studied project selection and the formation of an optimal portfolio of the selected projects. In his study, first, the projects were ranked using GRA to form an optimal portfolio of projects and to create an expert system for the final project selection. He also claimed that, using their proposed model, the criteria governing the decision problem could be a combination of qualitative and quantitative criteria. Nikomaram et al. (2014) used the entropy-fuzzy approach to investigate the effect of the professional ethics of management accountants on the qualitative features of management accounting information. The calculated weights of the entropy matrix were used in one of the fuzzy steps. Maniya (2016) studied the comparative assessment of GRA method and the Multi Objective Optimization on the basis of Ratio Analysis (MOORA) method, considering two distinct weight determination methods, namely Analytical Hierarchy Process (AHP) method and entropy method for ranking and selecting a “Two For One” (TFO) machine in textile industry. They tried to select the best TFO machine based on these methods.
Risk and Risk Management
A decision-making process that is based on assumptions, estimations and predictions of future events, will always be associated with risk, which is a function that determines the probability and extent of the damage. Risk is the concept of unknown important events that determine the level of performance expected by the project (Chapman & Ward, 2003). Raftery (1988) presented a functional definition of risk: “Risk and uncertainty characterize situations where the actual outcome for a particular event or activity is likely to deviate from the estimate or forecast value”. The term risk is used when evaluating the probability of a phenomenon occurrence is possible or, in other words, risks can be estimated. The following logical relation is used to calculate risk:
Risk Rate = severity × probability of occurrence
Today, the risks and types of trends associated with them such as risk studies, risk assessment, and risk analysis, find their place in a wide range of issues such as finance, credit, investment, trade, insurance, safety, health, industrial and development projects, and even political, social, and military issues (Demidenko D. S., Gorovoy A. A., Malevskaia-Malevich E. D., 2017). Project risk is defined by the Project Management Institute (PMI) as “an uncertain event or condition that, if it occurs, has a positive or negative effect on one or more project objectives such as scope, schedule, cost, or quality”. The project risk is an integral part of any project, so it should be managed. Proper risk management is a prerequisite for overcoming the crisis of the projects. Besides, the need for an access to the related sciences and the spread of these sciences is quite obvious. The PMBOK guide defines risk management as “The systematic process of identifying, analyzing and responding to project risks. It includes maximizing positive events and minimizing adverse events”. Experiences show that the project contains strategic, technical, economic and national elements that face the threats and opportunities associated with the key elements of the project, namely time, cost and quality, in the pursuit of predetermined goals. The roots of these threats and opportunities can be sought in a series of uncertain conditions that have different origins, such as technical, managerial, commercial, internal and external issues of the project (Shvetsova O. A., Rodionova E. A., Epstein M. Z., 2018). Project risk management is, in fact, a systematic process that involves identifying, analyzing, responding to and monitoring the risks of the project. This management includes processes, tools and techniques that will help the project manager maximize the probability of positive event results and minimize the probability of the negative event results.
Qualitative Risk Analysis
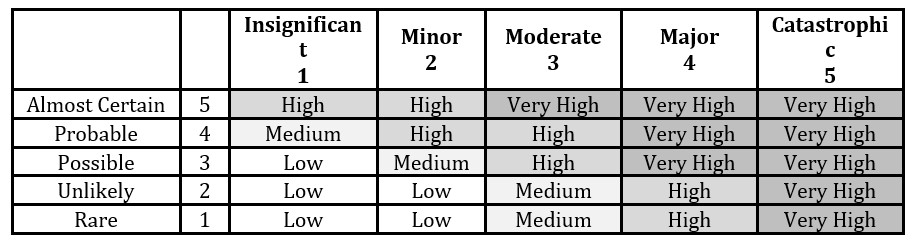
Qualitative risk analysis is an assessment of the impact and occurrence probability of the identified risks. In this process, the risks are ranked according to their consequences and their potential impact on project goals. For the qualitative analysis, it is necessary to determine the likelihood and the consequences of the risk using qualitative tools and techniques. The qualitative analysis of risk cases and their conditions will be carried out to prioritize the impacts of each risk on project objectives. For example, the existence of risk in the critical path is a key factor in determining the importance of the risk. Also, the indication of risk existence (absence) or the reiteration of it from the project members specifies the importance (unimportance) of the risk in the qualitative analysis stage, especially when this stage is repeated during the execution of the project, and consequently reflects the need of more (less) preparedness in responding to the risk. The qualitative analysis can be used directly for risk response planning, or as an input for a quantitative analysis of high priority risks. The likelihood-severity matrix with qualitative values which is used in the qualitative risk analysis is shown in Table 1
Table 1: Risk Severity Matrix
Risk exposure in each mentioned interval in Table 1 will indicate how to deal with it in the future. In this stage, after determining the occurrence likelihood and the consequences severity of the hazards, the level of the risk is being confirmed. The acceptable risk level in the systems of different countries is determined based on the laws of those countries, and are developed according to the social, cultural and economic conditions, which means that the level of risks in different countries is not necessarily similar to each other. In general, risk level can be defined in three categories:
Acceptable risk:the risks with low probability of occurrence with minor consequences are in this category. In fact, accepting these risks in the routine of the system is unavoidable; therefore, these risks do not require further action, and their reduction is no longer possible.
Unacceptable risk:the risks in this category have relatively severe human and financial losses. Therefore, in order to ensure safety in the organization, the activities generating such risks should be stopped. These risks are not acceptable under normal circumstances and are only accepted under certain conditions where there is no other alternative than accepting these high risks.
Considerable risk:the risks in this category are between the two above-mentioned levels and will only be accepted if the benefits of accepting these kinds of risks are greater than their losses and all the hazards of the system are identified and controlled. However, it is always essential to reduce the risk of this category.
The aforementioned categories are determined based on “multiplying the likelihood of occurrence and the severity of the consequences”. If this factor is high, the risk is unacceptable. Obviously, the high probability of occurrence or the severity of consequences can lead to an unacceptable risk.
Quantitative Risk Analysis
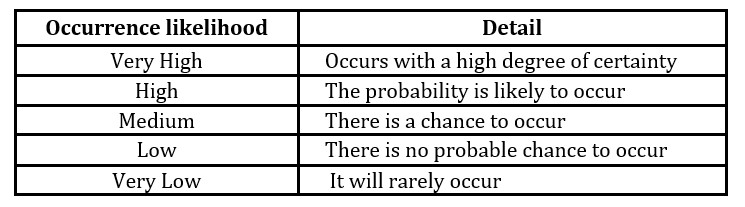
The purpose of the quantitative risk analysis is the numerical analysis of occurrence probability of one or several risks and their impact on project objectives. Table 2 presents a guide to quantify the probability of risk. Using the quantitative analysis methods of risk such as Monte Carlo simulation and decision analysis (DA), it is possible to:
Identify important and major risks.
Determine the likelihood of achieving a specific project objective.
Determine the amount of project risk, cost and storage time required.
Determine the realistic cost, time and achievable scope of a project.
Table 2: Guide to quantify the probability of risk
Risks in construction projects
Construction industry has always been considered as a high-risk industry by project management experts. Construction projects are potentially exposed to various types of risks due to the nature of the activities and processes involved, their organizational structure and the environment in which they are carried out. The most important risks of logistics management that are involved in construction projects are mentioned below:
Event Risk: This type of risk includes two categories, the first category of events is caused by natural disasters, such as earthquakes, flooding etc. and the second category of events is caused by manpower, such as strikes, accidents etc.
On-time logistic operations: The most important risks in this area are failure in on-time delivery of materials, drawings, plots, equipment, etc. to the suppliers or the contractors. The delay in essential activities is a consequence of this significant risk.
The risk of changing economic conditions: changes in exchange rates, inflation, etc., is one of the determinant factors in shaping and estimating the project’s costs. Any change in these variables can create a distortion in cost forecasts.
Risks in the political situation: political conditions have a significant impact on the procurement of projects, such as financing, opening L/C, sending equipment, using external contractors, etc.
Risk for expert manpower: The manpower specializing in designing, transporting, constructing, installing and commissioning is one of the key factors in implementing projects in a timely and predictable budget. The presence of these highly skilled human resources brings many redundancies rework and, by their creativity, they offer better ways to do the right thing.
The existence of such a diverse portfolio of risks in the construction industry has led to a lot of research into the management of these kinds of risks. Although the result of this scientific effort is represented in the design and development of various models and tools for identifying and managing risks in the construction industry, construction projects are still far from the expected and satisfactory level of performance. Such functional situation in Iran’s construction industry is also clearly visible. The importance of the construction industry in Iran’s economic system is obvious. In 2015, the housing construction share of the GDP was 6.3% (Central Bank of Iran, 2016). The annual increase in the budget of national development projects is another reason for the key role of the country’s construction industry. However, despite its importance, if the performance of construction projects in Iran is measured by the usual performance measures in project management such as time, cost and quality, the results are not desirable. In terms of quality, according to the Ministry of Roads and Urban Development, the useful life of structures in Iran is between 20 and 30 years maximum (Ministry of Roads and Urban Development, 2016). Also, a glance at the damages resulting from various earthquakes in Iran over more than half a century has highlighted the low quality of design, materials and construction in Iran. In terms of the duration of a project, one of three development projects is delayed in recent years, with estimated losses of 460 million USD (Ministry of Roads and Urban Development, 2016). According to studies conducted by Iran’s Management and Planning Organization (2015), these delays are due to several reasons, among which “credit problems” and “lack of familiarity with scientific management” are the major factors.
Methodology
Entropy
Entropy is a measure of the randomness of information. Shannon formulated entropy, which is the measure of uncertainty and information, based on probability theory (Shannon, 1948). Therefore, entropy is an analytical method that has many applications in many areas and has achieved many successes. In a mathematical language, entropy can be expressed as, “The probability of an event greater than or equal to zero and less than or equal to one”. Accordingly, the occurrence probability of event is equal to:
If we get a message that has happened, it is clear that the smaller the probability of occurrence is, the more surprised we will be. Therefore, the value of the information content, say entropy, has an inverse relationship with the occurrence probability of an event, and is represented as . For an easy operation, if the log function is used instead of , the value of the information varies between zero and infinity, as follows:
If the occurrence probability of the event changes from by changing the situation, the value of the new information content also changes between zero and infinity, as follows:
The difference in the value between the first and second messages is defined as follows:
If contains several events as occurs in random events ( ), then the total entropy is defined as follows:
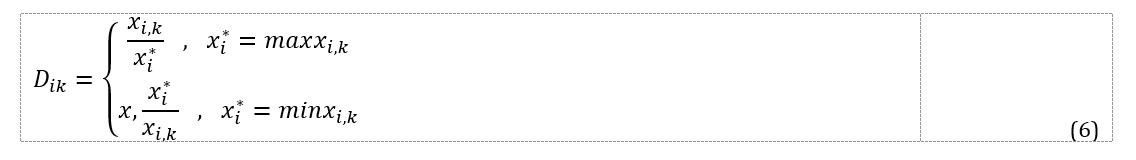
If ( ) is defined as the value of -th ratio for -th attribute ( ), and also is defined as the best or optimal value of -th ratio, then, the largest and smallest defined for each ratio can be defined by Eq. 6, so that is the closest to .
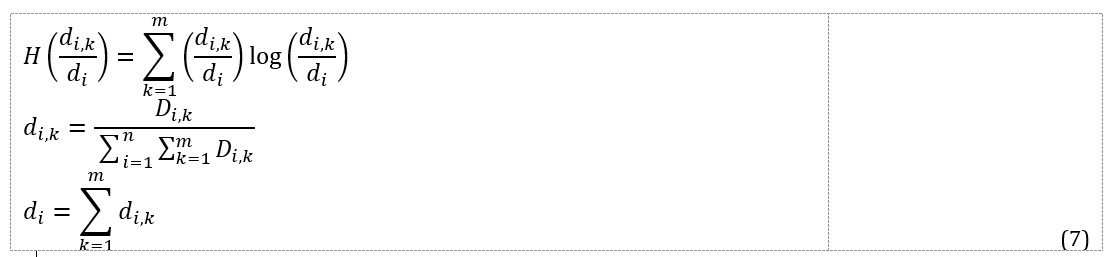
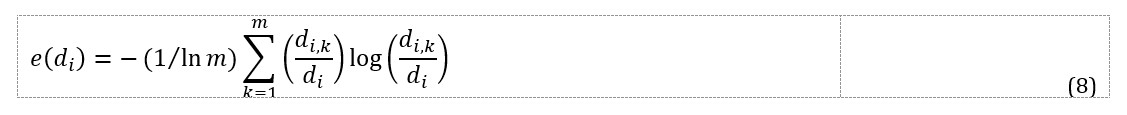
Three types of entropy calculations are possible. One of them is conditional entropy. According to the purpose of this research, the conditional entropy that evaluates the importance ratio is considered. The conditional entropy of ratio for ranking attributes can be calculated as follows:
Converting to allows all to change at [0, 1] interval. The maximum entropy occurs when all are equal and the maximum entropy leads to . By normalizing the entropy calculations ( ), the value of is obtained as follows:
This causes the entropy sizes to be in the interval [0, 1] and they are also used to determine the relative weights for attributes.
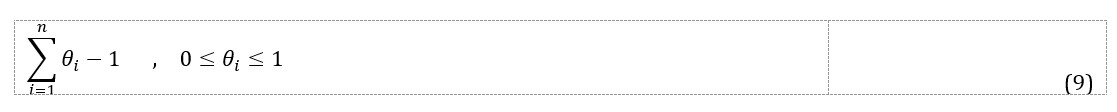
If is the relative weight of the i-th ratio, then needs the following relation for completion:
If, arbitrarily, is calculated so that the larger the value means the greater importance of the desired ratio, then the is normalized as follows:
then, the total entropy for all the ratios is defined as follows:
So, each represents the weighted value of each ratio. The higher the value of the more valuable information in the -th ratio.
Identification of the risks of construction projects management
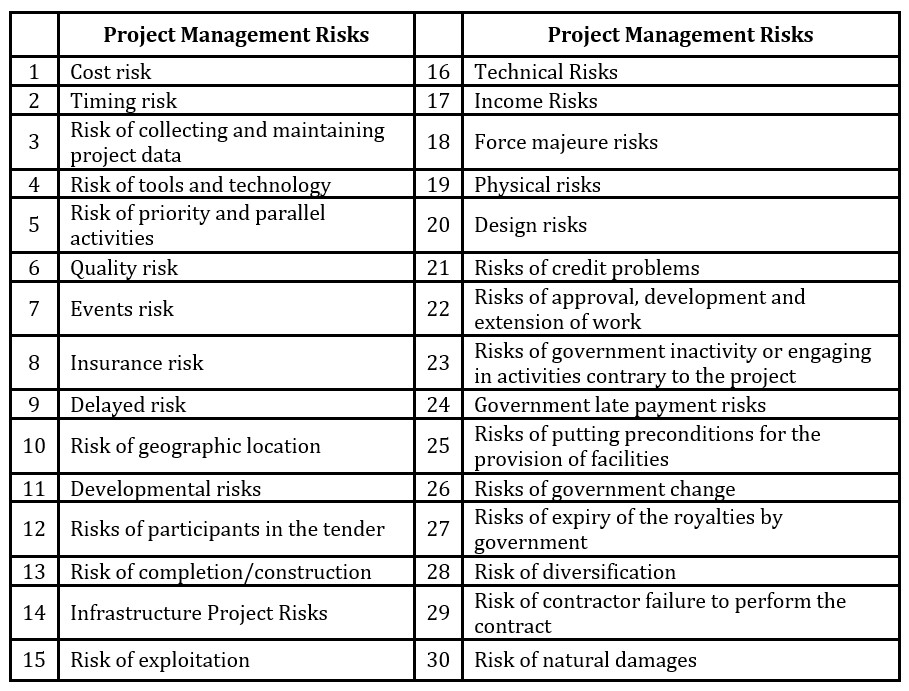
In order to identify risks of construction projects management in Yazd municipality, by reviewing the research literature and theoretical foundations, a series of project management risks were identified. Subsequently, with the holding of coordination groups with Yazd municipality construction project experts, a number of risks were eliminated and some were adjusted and added. Eventually, 30 effective risks for construction projects management of Yazd municipality were approved based on experts’ opinions that are listed in Table 3.
Table 3: Risks of construction projects management in Yazd municipality
Evaluation of risks using gray FMEA approach
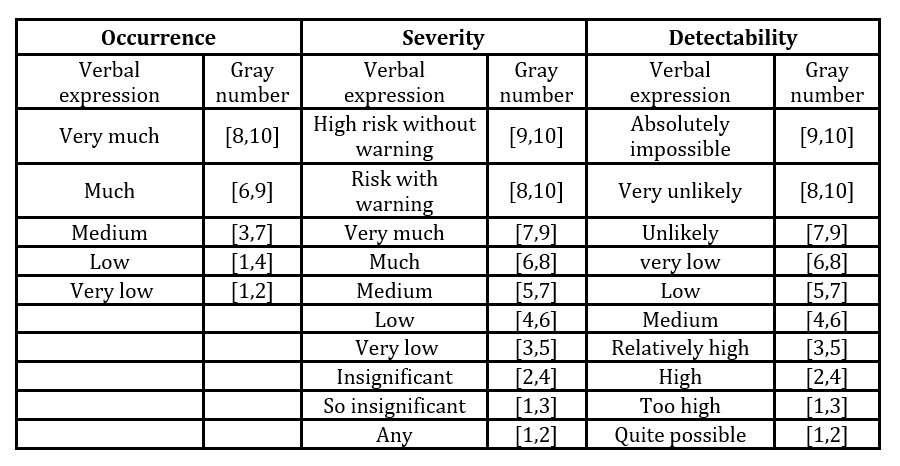
There is a lot of discussion about the fact that these risk factors, namely; failure occurrence (O), failure severity (S), and failure detectability (D) are not readily measurable. Since the verbal evaluation is done by individuals in an approximate manner, it can be said that gray theory is suitable for the confrontation with the ambiguity of these types of evaluations, whereas the attempts to achieve more precise quantities are impossible and unnecessary (Delgado, et al., 1998). Table 4 shows the verbal expressions and their corresponding gray numbers which are used in this study to evaluate risk factors. These expressions are well matched with the definitions in traditional Failure Modes and Effects Analysis (FMEA).
Table 4: Verbal expressions and gray numbers of risk factors assessment
Suppose that we have n risk items which are evaluated and ranked by an FMEA team that includes m members . Considering , and as a gray degree of i-th risk item in O, S and D risk factors, respectively, which is provided by j-th member of FMEA team ( ) and also considering as the relative importance of each member of the FMEA team, so that the conditions and are satisfied. Based on the above assumptions, risk items can be ranked using the integrated entropy and GRA approaches. Steps to achieve this goal are:
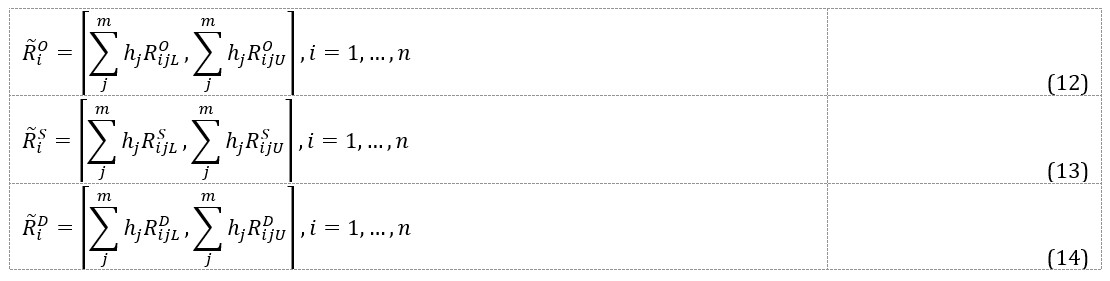
Step 1: aggregating the FMEA team’s answers using the Eq. 12-14.
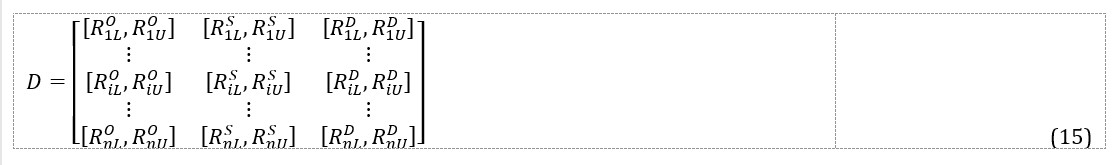
where , , and are aggregates of the occurrence degree, severity and detectability, respectively, for risk . Accordingly, the decision matrix will be as follows:
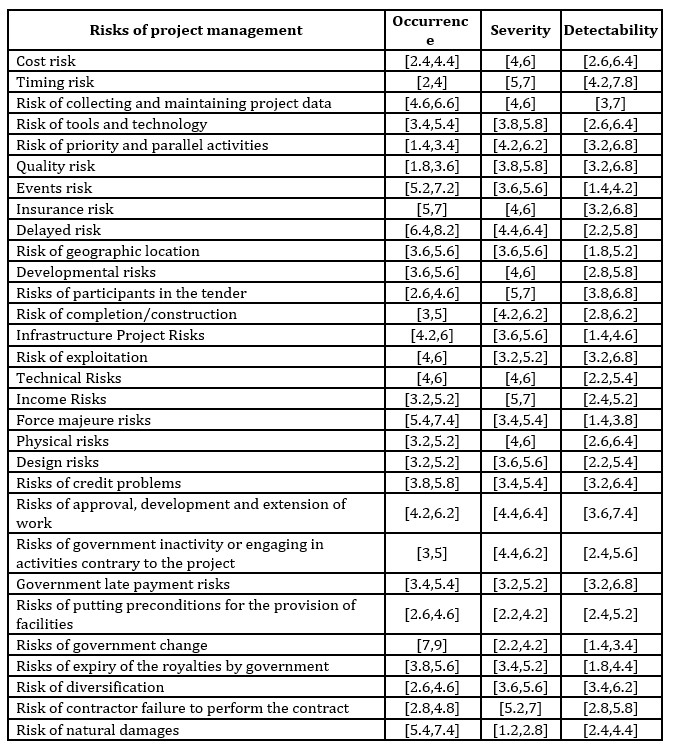
Based on Eq. 15, Table 5 shows the average assessment of 5 experts in Yazd Municipality.
Table 5: Decision matrix
Step 2: Determining the weight of risk factors with gray entropy technique: Considering the decision matrix of step 1, the following steps were taken to determine the weight of risk factors using gray entropy techniques:
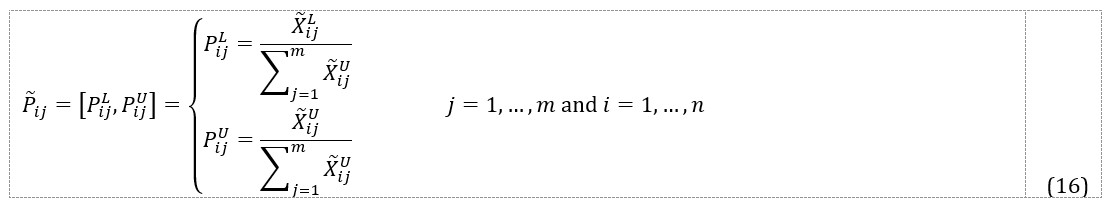
Normalizing the decision matrix: The normal matrix is N, and each of its elements is represented by . In the entropy technique, normalization is done linearly. The total gray value of each column must be calculated. For this purpose, the generalized relation of gray summation has been used, Eq. 16.
Where is upper bound and is lower bound of the interval.
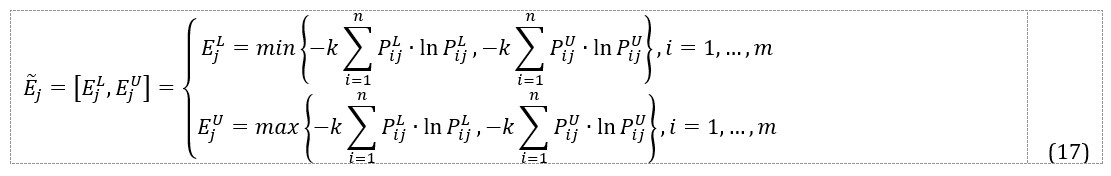
Determining the values of of the set using Eq. 17
Where is a positive constant applied to satisfy .
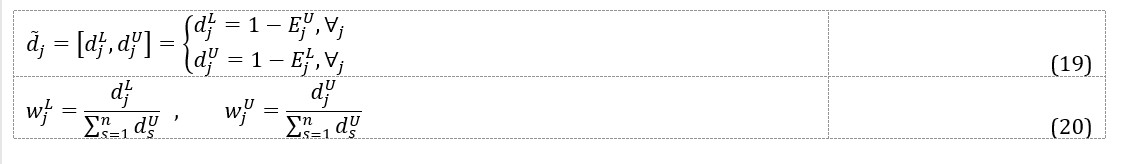
Calculating the uncertainty or the degree of deviation ( ) from the created information and weight ( ) of each indicator j using Eq. 19 and Eq. 20, respectively.
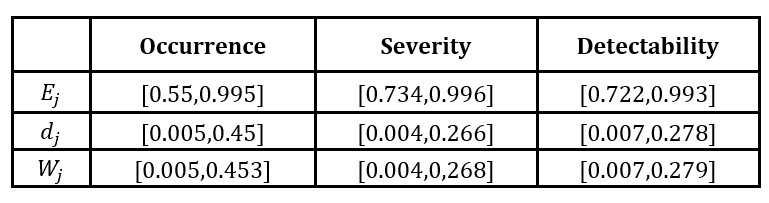
The final weight of each risk factor using gray Shannon entropy is shown in Table 6.
Table 6: Normalized weight of risk Factors using gray Shannon entropy
Step 3: Ranking project management risks by GRA technique: To rank the risks, GRA technique, which is a multiple-criteria decision-making (MCDM) technique, is used to evaluate a number of items based on a number of criteria. To approach this goal, the following steps should be taken:
Forming the decision matrix is also the first step in this technique: After the formation of this matrix, the GRA algorithm is used to select the optimal item. The decision matrix of this technique is the same decision matrix used in the gray entropy technique (step 1).
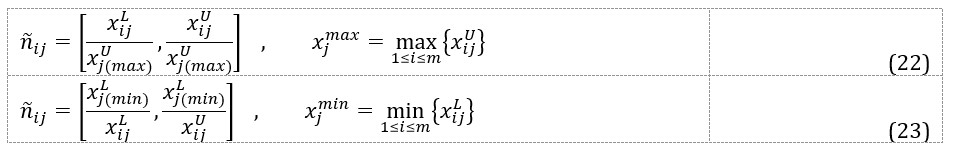
Normalizing matrix D according to the Eq. 21.
When the measurement units of different performance indicators are not the same, the impact of some of the indicators may be ignored. This can also happen when some performance indicators have a wide range. Moreover, if the objective or direction of these indices is different, it may lead to incorrect results in the analyses. Therefore, normalization seems to be necessary. In case of the profit criterion (more is better) and the loss criterion (less is better), Eq. 22 and Eq. 23 are used, respectively.
This normalization method makes the normalized gray numbers appear in the range of [0, 1].
Obtaining the weighted normalized matrix ( ): To do this, the weight of each factor is multiplied in the column corresponding to that factor. This will avoid sorting the gray numbers during sorting the gray relation degree for different items.
Then, the difference between the optimal item (ideal sequence) and other comparative items is calculated. The ideal sequence (positive ideal answer) and the difference relations are defined as Eq. 24 and Eq. 25, respectively.
Thus, the matrix of items difference (H) is obtained as follows:
Obtaining the gray relational coefficient: The closer the comparability sequence of item is to the ideal sequence, the more desirable it will be. Using the gray relational coefficient (Eq. 27), the proximity of each to the corresponding is measured. The higher the coefficient is, the closer it is.
where and are the smallest and the largest value of , respectively. And is a distinguishing coefficient as and usually takes = 0.5.
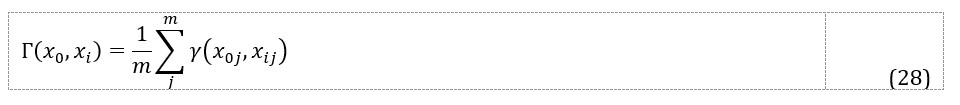
Calculating the gray relational degree: After calculating all the gray relational coefficients s , the gray relational degree can be computed by Eq. 28 as follows:
So, is the final value for -th risk. This parameter expresses the correlation between the target reference sequence and the comparability sequence. On each indicator, the target reference sequence represents the best performance that can be achieved through the comparability sequence.
Conclusion and Discussion
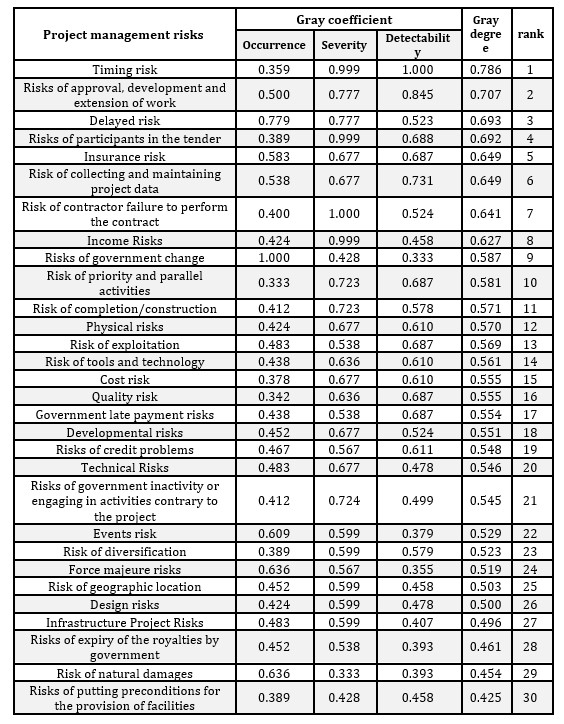
Based on the steps taken in section 4 and the final weights of risk factors, the risks of Yazd Municipality’s construction projects have been ranked so that if a comparability sequence for an item has the highest gray relational degree with the target reference sequence, then this comparability sequence is most similar to the target reference sequence, hence this item is the best choice. In other words, for the risks , if , then it is concluded that the RPN (Risk Priority Number) of risk is greater than the RPN of risk . The results of periodization, gray coefficient of risk factors and gray degree of each risk are illustrated in Table 7. As can be seen, the risks of “Timing”, “Approval, development and extension of work”, “Delayed”, “Participants in the tender”, “Insurance”, “Collecting and maintaining project data”, “Contractor failure to perform the contract”, and “Income” are the first 8 risks which have the most impact on the project.
Table 7: The prioritized risks of construction project management in Yazd municipality
In this research, the FMEA technique is used to evaluate the risks of construction projects management in the Yazd municipality. Therefore, to determine the weight of FMEA factors (occurrence, severity and detectability), gray Shannon entropy technique was used. In most MCDM problems, and especially the multifactorial decision-making problems, having and knowing the relative weights of existing indicators is an effective step in the problem-solving process. In this study, the gray Shannon entropy method has been used as one of the most well-known methods for calculating the weights of indicators. The results of determining the weight of the criteria showed that the factor “Occurrence” has the highest weight, whereas the factor “Severity” has the least weight. Based on the 30 identified risks of project management and the three FMEA risk factors, the decision matrix of project management risks, according to the gray numbers, is shown in Table 5 which is the result of the average assessment of 5 experts in Yazd Municipality .By using the corresponding verbal expressions of the gray numbers in Table 4, the verbal evaluation of each expert is converted into gray numbers, and then, based on the Eq. 12-14, the aggregation matrix of experts’ opinions was obtained as illustrated in Table 5. To rank the risks based on FMEA’s risk factors, GRA technique has been used which is also a MCDM technique used to evaluate a number of items based on a number of criteria.
The analytic model made by the researcher and the method of analysis are the main determinant of the analysis method. An analytical model determines what information should be analyzed and how. Research methods are selected according to the goals, hypotheses and analytical patterns. Meanwhile, the use of various tools in the analysis can also be effective in the accuracy of the analysis method. That is, while using the best method, it should be used with the most proper tool as the results of the analysis depend entirely on methods and tools.
Acknowledgment
This research work was supported by the Academic Excellence Project 5-100 proposed by Peter the Great St. Petersburg Polytechnic University.
Bibliography
Adamenko, A.A., Zolotukhina, E.B., Ulanov, V.A., Samoylova, E.S., Chizhankova, I.V., Mamatelashvilli, O.V., 2017. Investment management activities of commercial enterprises. International Journal of Applied Business and Economic Research, 15(12), pp. 11-21.
Aliverdi, R., Naeni, L. M. & Salehipour, A., 2013. Monitoring project duration and cost in a construction project by applying statistical quality control charts. International Journal of Project Management, 31(3), pp. 411-423.
Baker, S., Ponniah, D. & Smith, S., 1998. Techniques for the analysis of risks in major projects. JORS, pp. 567-572.
Borovkova, V., Borovkova, V., Boikova, U., & Testina, Y., 2019. Improving efficiency of company risk management system monitoring. s.l., IOP Conference Series: Materials Science and Engineering. – IOP Publishing. – Т. 497. – №. 1. – С. 012055.
Central Bank of Iran, 2016. Report on Economic Developments in Iran; Last 9 Months of 2015, Tehran: Department of Economic Accounts, Central Bank of Iran.
Chapman, C. & Ward, S., 2003. Project Risk Management: Processes, Techniques and Insights. Chichester, UK: John Wiley and Sons.
Delgado, M., Vilaa, M. A. & Voxman, W., 1998. On a canonical representation of fuzzy numbers. Fuzzy Sets and Systems, 93(1), pp. 125-135.
Demidenko D. S., Gorovoy A. A., Malevskaia-Malevich E. D., 2017. The new elements of risk classification. s.l., Proceedings of the 29th International Business Information Management Association Conference-Sustainable Economic Growth, Education Excellence, and Innovation Management through Vision 2020, IBIMA 2017. – С. 2217-2221.
Doloi, H. K., 2011. Understanding stakeholders’ perspective of cost estimation in project management. International Journal of Project Management, 29(5), pp. 622-636.
Dvas G. V., Dubolazova Y. A., 2018. Risk assessment and risk management of innovative activity of the enterprise. s.l., Innovation Management and Education Excellence through Vision 2020. – С. 5650-5653.
Hwang, B.-G. & Ng, W. J., 2013. Project management knowledge and skills for green construction: Overcoming challenges. International Journal of Project Management, 31(2), pp. 272-284.
Hwang, B.-G. & Tan, J. S., 2012. Green building project management: obstacles and solutions for sustainable development. Sustainable Development, 20(5), p. 335–349.
Ianenko, M. B., Badalov, L. A., Rovensky, Y. A., Bunich, G. A., & Gerasimova, E. B., 2018. Essence, risks and control of uncertainties in the process of making investment decisions. 39(31), p. 10.
Iran’s Management and Planning Organization, 2015. Strategic Supervision Department, Monitoring Report of National Development Projects 2013: Performance Monitoring, Tehran: Center of Scientific Documents and Publications.
Kasap, D. & Murat, K., 2007. Risk Identification Step of the Project Risk Management. Portland, OR, USA, s.n.
Kuo, Y., Yang, T. & Huang, G.-W., 2008. The use of a grey-based Taguchi method for optimizing multi-response simulation problems. Engineering Optimization, 40(6), p. 517–528.
Lauras, M., Marques, G. & Gourca, D., 2010. Towards a multi-dimensional project Performance Measurement System. Decision Support Systems, 48(2), pp. 342-353.
Maniya, K. D., 2016. Comparative Study of GRA and MOORA Methods: A Case of Selecting TFO Machine. In: Problem Solving and Uncertainty Modeling through Optimization and Soft Computing Applications. s.l.:IGI Global, p. 15.
Markabi, M. S. & Sarbijan, M. S., 2015. A Hybrid Model of Grey Relational Analysis and DEA Cross-Efficiency for the Evaluation of Decision Making Units. International Journal of Economy, Management and Social Sciences, 4(3), pp. 317-322.
Ministry of Roads and Urban Development, 2016. Quarterly of Housing Economy, Tehran: Office of Planning and Housing Economics.
Mohammadi, A., Mohammadi, K. & Jahanbani, M., 2012. Improvement of Efficiency Measurement in DEA Model by Applying GRA Technique. Public Management Researches, 5(17), pp. 152-135.
Mohebian, F. & Roghanian, E., 2011. integrating fuzzy entropy and PERT techniques in ranking the critical path of projects. Tehran – Iran Project Management Association, s.n.
Nikomaram, H., Roudposhti, F. & Tolouei, A., 2014. Evaluating Impact Of Management Accountants Professional Ethics On Management Accounting Information Quality Characteristics (By Using Entropy-Fuzzy). Management Accounting, 7(20), pp. 49-66.
Raftery, J., 1988. Risk Analysis in Project Management. London: E & FN SPON.
Razi, F. F., 2014. A Hybrid Grey Relational Analysis and Nondominated Sorting Genetic Algorithm-II for Project Portfolio Selection. Advances in Operations Research, Volume 2014, p. 8.
Rodionova E. A., Shvetsova O. A., EPSTEIN M. Z., 2018. Multicriterial Approach to Investment Projects’ Estimation under Risk Conditions. Revista Espacios, Volume 39, pp. 28-44.
Sadeghi, A. M., Ameli, M. & Darani, M. T., 2009. Presentation a Value Engineering and Risk Management Integrated Model in Large Construction Projects. Tehran, s.n.
Shannon, C. E., 1948. Mathematical Theory of Communication. The Bell System Technical, Volume 27, pp. 379–423, 623–656.
Shvetsova O. A., Rodionova E. A., Epstein M. Z., n.d. Evaluation of investment projects under uncertainty: Multi-criteria approach using interval data. Entrepreneurship and Sustainability Issues, 5(4), pp. 914-928.
Wideman, R. M., l986. The PMBOK Report — PMI Body of Knowledge Standard. Project Management Journal, 17(3), pp. l5-24.
Xing, L., Tu, K. & Ma, L., 2009. IT Project Risk Assessment Based on Improved Grey Relational. Changsha, Hunan, China, s.n.