1Poznań University of Economics and Business,Management Institute, Quality Management Department al. Niepodległości ,Poznań, Poland
2Cracow University of Economics, College of Management and Quality, Department of Food Product Quality, Krakow, Poland
Volume 2021,
Article ID 957411,
IBIMA Business Review,
12 pages,
DOI: 10.5171/2021.957411
Received date: 2 November 2020; Accepted date: 4 March 2021; Published date: 3 September 2021
Academic Editor: Anna Korombel
Cite this Article as:
Jacek ŁUCZAK and Małgorzata MIŚNIAKIEWICZ (2021)," How to Analyze Risk Factors in Marathons Events? The lesson for Large-scale Running Events' Organizers", IBIMA Business Review, Vol. 2021 (2021), Article ID 957411, DOI: 10.5171/2021.957411
The complexity of the project and the uncertainty related to its unique character are important factors affecting the risk associated with the implementation of a given project. The subjects of the analysis were the risk factors related to the organization of marathons classified as mass sports events. None of such events can be flawlessly planned and none can be carried out strictly according to a previously developed plan. Risk management, as a sequence of separate activities during the organization and course of a sports event, especially the identification and prioritization of threats, helps the event organizers cope with the uncertainty related to individual aspects of the event. This gives more space for manoeuvre, allowing the organizers to pay special attention to those risk factors, the minimization or elimination of which, at an early stage, allows minimising the probability of negative effects and creates the greatest probability of achieving positive results. Risk, if left unattended, tends to degrade the running event’s value, while the effective risk management adds extra value to it. The research aimed at analysing identified risk factors for marathons in the context of defining the character of managerial decisions related to marathons organisation. The results of the research verification of risk factors and their logical grouping were conducted. The authors carried out the validity assessment of the research instrument (the Cronbach’s alpha statistics was used) as well as the cluster and factor analyses to illustrate the research results and provide results of higher quality in the context of taking risk mitigation actions for marathon organization.
Keywords: Risk Factors Analysis, Running Events, Priorities in Risk Management.
Introduction
Recreational running is typical for the modern lifestyle model of a significant group of the society, being a relatively cheap one that does not require any special sports arenas (Czkór, 2014; Shipway, Holloway & Jones, 2013). Everyone can run regardless of the time of a year, age, gender, physical fitness, social status and education level. One can run on his/her own or participate in professional running events, choosing from shorter or longer city runs to ultra marathons. Today, significant dynamics of the growing interest in participating in long-distance runs are observed. This phenomenon makes the organization of running events important social projects for participants, their families, organizers and a given local community.
Long-distance running events have surged in number and participation in Poland in the last few years. In 2010, nearly 800 different races were registered in Poland, while in 2015, an increase of nearly 132% in comparison with 2010 (1,856 runs) was recorded. In the following years, the number of races grew, although the dynamics were not that significant. In 2018, a total of over 2,500 runs were registered in Poland (www.maratonypolskie.pl). In the top 10 marathons in Poland in 2018, a total of 33,445 runners took part (the statistics include only participants who completed the races).
Surprisingly, 51% of sports events’ organizers in Poland do not conduct formal management of the project, which is the organization of a sporting event in accordance with a recognized methodology. 78% of them do not formally estimate the risk of organizing sports events (Miśniakiewicz & Łuczak, 2014). In practice, risk management, as a part of operational management, is often limited to intuitively avoiding threats and meeting existing legal requirements. Therefore, it is probable that decisions related to the organization of the run are not made optimally with no significant risks identified and, as a consequence, they are not adequately mitigated (Hanstad, 2012). As a result, a sports event may not bring the expected benefits, and its course may be disturbed or even interrupted (Reid & Ritchie, 2011; Helms, 2011). It results in further risks related to the loss of the organizer’s reputation and dissatisfaction of the participants, who put a lot of effort into the preparation and often incur specific costs associated with their participation in the running event (Moyle, Kennelly & Lamont, 2014; Nohr, 2009). What is more, dramatic incidents and deaths in several high-profile running events have understandably contributed to misgivings regarding the safety of such events, which encouraged organizers to think of professional risk management (Bjarnason & Cannell, 1999; Berlonghi, 1990).
The majority of marathons in Poland do not meet the criteria of mass events. It means that they are not a subject to expansive legal regulations related to providing their security. This significantly facilitates their organization and at the same time leaves the responsibility for their management to the experience of the organizers (Żuryński, 2013). The organizers should identify potential risks within the running event and implement adequate measures to control them (Fuller & Drawer, 2004).
The decreasing number of marathon finishers, on one hand, as well as the growing number of events available on the running market, and, thus, growing competition, on the other hand, motivate their organizers to improve the quality and efficiency of such events. Consequently, they aim at professionalizing the planning and implementation of these events (Shipway, Holloway & Jones, 2013; Peters & Pikkemaat, 2005; Spengler, Connaughton & Pittman, 2006).
There are no obligatory legal requirements to carry out risk management in large-scale running events today; however, it is a helpful tool to identify risks, assess and mitigate them to the acceptable levels. It assists sporting event managers in providing a reasonably safe environment and can constitute a fundamental reference for solving the occurring and potential problems (Berlonghi, 1990; Ammon & Brown, 2007).
Risk, if left unattended, tends to degrade the running event’s value (Rescher, 1983), while the effective risk management adds extra value to it (Toohey & Taylor, 2008). Yet, event organizers should remember that it is impossible to eliminate risk totally without degrading value, so the decision process must follow an optimizing rule, balancing the costs and benefits against the overall risk management (Rescher, 1983; Miller, Wendt & Young, 2010). An early understanding of the level of risk, different risk issues, complexity and uncertainty when talking about risk management would help in the determination of the project scope and the ultimate success of a running event (Shone & Parry, 2004; Nohr, 2009). The list of critical risk factors and more conscious risk management of large-scale running events are supposed to be the results of these actions.
That is why risk factors were identified by 15 experts and analyzed by 31 representatives of organizers responsible for 14 marathons in Poland. All the events belong to the group of the 20 largest marathons in Poland (research carried out by Łuczak, Miśniakiewicz and Saavedra, entitled: “Identification and Assessment of Risk Factors for Large-Scale Running Events from The Organizers’ Perspective. Marathon Case Study”, 36th IBIMA Conference).
Methodological Assumptions for the Analysis of Risk Estimation
A research carried out by Łuczak, Miśniakiewicz and Saavedra, entitled: “Identification and Assessment of Risk Factors for Large-Scale Running Events from The Organizers` Perspective. Marathon Case Study”, 36th IBIMA Conference, aimed to identify risk factors (the Delphi method, a discussed questionnaire, 15 experts, 2017) and to estimate risk (qualitative research, a questionnaire, the e-risk app, 31 representatives of 14 marathons, 2017-2018). The Cronbach’s alpha statistics was used to assess the used questionnaire reliability. The cluster and factor analyses of the most important risks completed the analysis.
The research aimed at analysing data (identified risk factors for marathons) in the context of defining the character of managerial decisions related to organizing marathons. The realization of the research led to the verification of risk factors and their logical grouping (arrangement).
The authors carried out the validity assessment of the research instrument as well as risk assessment- the cluster and factor analyses to better illustrate the research results and provide results of higher quality in the context of taking risk mitigation actions for marathon organization. A reliability analysis (Cronbach, 1951; Peterson, 1994) was applied with the use of the Cronbach’s alpha statistics to confirm the adequacy of the applied research instrument (a questionnaire prepared as the result of the preparatory research) (Peterson, 1994; Brzeziński, 1996; Cronbach, 2005; Hornowska, 2001; Peterson, 1994).
The factor analysis was used to distinguish risk factor groups. This method is considered insufficiently objective; however, it is highly important while exploring the structure of multidimensional data (Balicki, 2013). It helped to categorize observations in a proper way so as the distinguished groups were simultaneously coherent due to variables (internally cohesive) and different to others (i.e. characterized by external isolation – Walesiak & Gatnar, 2016). Consequently, the cluster analysis was conducted to distinguish groups of organizers on the basis of attitudes to risk (Hanstad, 2012) as the results showed that risk factors are assessed at various levels. Due to the cluster analysis, contrary to the analysis of average risks values, certain attitudes (approaches) towards the risk of organizing events may be revealed.
On the basis of relevant professional literature (Milligan, 1996), several stages of a typical cluster analysis were distinguished, including the choice of items and variables, data standardization, the selection of a distance calculation method and a classification method, establishing the number of classes and result evaluation (Walesiak, 2004). At the stage of selecting variables, the authors of this paper decided to analyze the impact of factors of the highest generated risk (variables were grouped on the basis of the arithmetic average of risk assessment) and then they simultaneously applied scree plot and the minimal risk value criterion at level 4 (so as the analyzed risks could be characterized by larger than minimal probability and consequences).
The authors also decided that the selection of insignificant variables is an incorrect approach (Milligan, 1996; Walesiak, 2004), as it may hinder the discovery of a cohesive or relevant class difference within the set. Next, the variables were subjected to normalization with the use of standardization (the application of the average and standard deviation) (Grabiński, Wydymus & Zeliaś, 1989; Wilk et al., 2015).
Having discussed the choice of the most adequate classification method, the authors finally decided to use the hierarchical method (so as to define the number of classes on the basis of the dendrogram). Next, the application of the method including the initial classification of items, in which the number of distinguishable classes is known (Gatnar & Walesiak, 2012), was considered valid. Moreover, the method of the increased squared distances sum (also called Ward’s method), which optimizes the division obtained by the combination of two elements at all stages, was used by the application of the minimum growth of the total sum of the squared variance of all variables for each item from group average values (Balicki, 2012). Consequently, on the basis of the dendrogram, the authors decided to distinguish 3 clusters.
After that, the k-means clustering was conducted, within which each class was represented by its centroid (Gatnar & Walesiak, 2012). Moreover, the clusters were checked for single-element sets – it might have suggested the occurrence of extreme deviations, which are capable of distorting the cognitive function of the cluster analysis.
The factor analysis aimed at revealing a new set of variables – a set, which is less numerous than the original one, but can reflect its variability. These factors should retain a significant portion of information included in the original variables (Walesiak & Gatnar, 2016; Balicki, 2013). Within the factor analysis, as well as within the cluster analysis, not all accessible variables were used – it was limited to the variables of the cluster analysis. It allowed for the comparability of analyses and their internal cohesion.
Analysis of Priorities in Risk Management
The Cronbach’s alpha statistics result reached the level of 0.933 (21 positions). According to the classical interpretation, the coefficient should have the minimum value of 0.6, whereas the preferable value of the coefficient is approx. 0.9. Thus, the internal cohesion of the research instrument was confirmed.
The presentation of the proper research results begins with the classical approach to risk assessment – the statistical analysis of the average values of risk factors focusing on the ones of the highest risk and the largest frequency. The following part presents four groups of event organizers (according to their attitude to risk) distinguished on the basis of the cluster analysis, as well as risk factor groups distinguished on the basis of the factor analysis.
The grouping of the data was arbitrary and was discussed with experts; within this scope, the result of the factor analysis stemmed from a discussion. The selected factors with the average value of risk at 4.1 or higher (36 most important factors) were standardized. The cut-off was applied with reference to factual evaluation. Not all variables were taken into account on the basis of the analysis of averages. The declining graph of averages of specific variables may be treated as a scree plot. Thus, the variables whose significance was marked as marginal and which might influence the results of grouping after standardization may not be taken into account (Guyon & Elisseeff, 2003; Breiman et al., 1984).
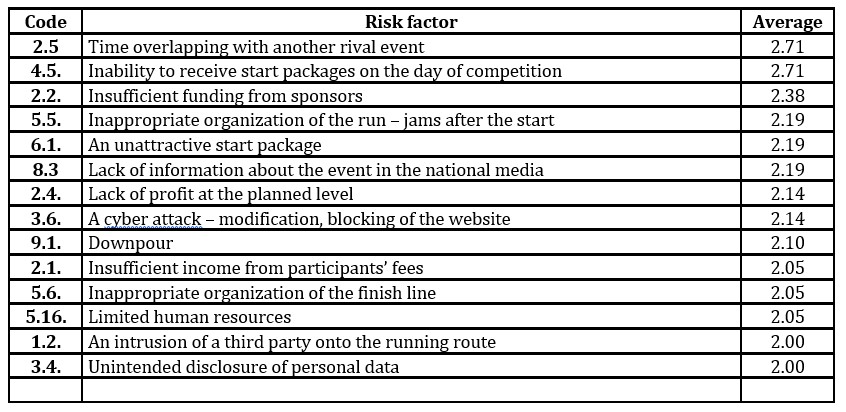
It is also adequate to define the probability of occurrence (the average) in reference to the identified risk factors. Three groups of risk factors were distinguished – with the value of probability: at 2.00 or higher – 14 most probable factors (see Table 1) at 1.20 to 1.99 – 50 factors, and at 1.19 or lower – 12 least probable factors, which may occur only theoretically.
Table 1. The most probable risk factors
Respondents considered the factors related to the marathon budget and achieving objectives as the most probable along with the ones linked with physical safety (an intrusion of a third party onto the running route), data protection (a cyber attack, disclosure of personal data) and organization (start and finish, issuing start packages).
Risk assessment aims at indicating priorities within the scope of additional security measures, which reduce risk to an acceptable level. These priorities were defined due to the statistical analysis of factors, focusing on the ones that generate the largest risk. Making proper decisions within the process of organizing a marathon needs taking account of the most probable factors as well as the ones of large impact (consequences).
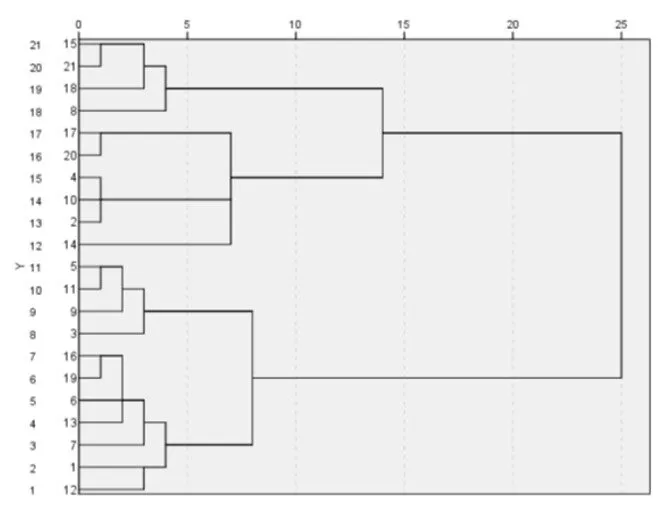
The analysis of the proper research results included the cluster analysis (Ketchen & Shook, 1996). The choice of the optimal number of clusters is usually unclear – the most popular methods vary from 2 to 4 clusters. However, the biggest cognitive value and distance between clusters may be observed for 3 clusters. Therefore, the authors made the decision to establish the number of clusters at 3. This choice was also confirmed by creating a dendrogram (the use of a hierarchical cluster analysis, Ward’s method) (figure 1).
Figure 1: Dendogram with the use of Ward’s method, joined clusters (scaled distances)
The centers of the three clusters may be characterized through analyzing them. Taking account of the clusters of variables, the following three groups of organizers were distinguished: group A (cluster 1) – “no problem”; group B (cluster 2) – “business”; group C (cluster 3) – “organizers”.
Cluster 1 (group A – “no problem”) consists of entities that assess all risks as low, particularly in reference to start packages, the local community, wrong identification and form of the route, difficulty in arriving at the start line, etc. For them, problems related to financial resources, e.g. funding from sponsors, are of the highest importance. However, even these risk areas reach lower than average values within this group.
Cluster 2 (group B – “business”) is a group that emphasizes financial aspects and associates the highest risk with insufficient profit, insufficient income, limited solvency as well as human resources and promotion problems (an insufficient number of volunteers, lack of their engagement, a rival competition).
Cluster 3 (group C – “organizers”) emphasizes organizational risks (problems with the route, start packages, volunteers, communication, PR, personal data). Moreover, this group does not consider financial risk to be significant (Table 2).
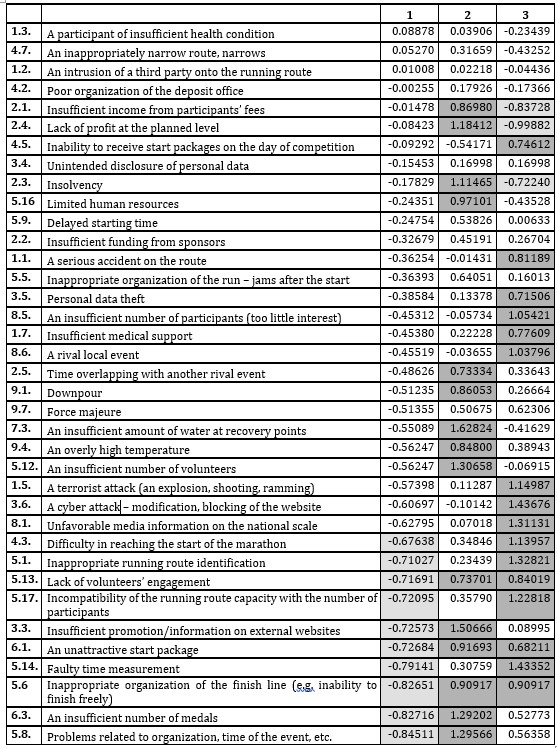
Table 2. Description of the cluster groups of marathon organizers
While analyzing the results, one should note that the data approximating to zero indicate that the average risk assessment in a specific group is typical (identical) of the whole set. In cluster 1 (“no problem”), it specifically refers to: An intrusion of a third party onto the running route, Poor organization of the deposit office, and Insufficient income from participants’ fees; in cluster 2 (“business”): A participant of insufficient health condition, An intrusion of a third party onto the running route, A serious accident on the route, and A rival local event; and in cluster 3 (group C – “organizers”), it mainly refers to: Delayed starting time, and An insufficient number of volunteers.
The values higher than zero indicate a higher risk assessment in comparison with the average, and, by analogy, values below zero define risk assessment lower than the average. The interpretation of the results (dark/light gray highlighting) is arbitrary. The dark gray fields indicate a considerable difference between the achieved risk assessment value and the average (above 1 or below 1), while light gray fields depict a lesser difference (but still significant).
The further the value is from zero, the larger the deviation. Hence, in the group called “no problem”, there are no significant deviations, but there are some smaller ones (10 factors), i.e. “Inappropriate organization of the finish line (e.g. inability to finish freely)”, “An insufficient number of medals”, and “Problems related to organization, time of the event, etc. with the local community and the administration”. In the group called “business”, large deviations relate, inter alia, to “An insufficient amount of water at recovery points”, “An insufficient number of volunteers”, and “Insufficient promotion/information on external websites”. The group called “organizers” is the most “visible”, which stresses on the risk group related to organization, and at the same time pays little attention to the financial aspect. The large deviations include “A cyber attack – modification, blocking of the website”, “Faulty time measurement”, and “Unfavorable media information on the national scale”. On the other hand, lesser deviations within this group embrace 3 factors, e.g., “Insufficient income from participant fees”, and “Lack of profit at the planned level”.
The use of the cluster analysis has allowed for distinguishing a number of groups of run organizers’ attitudes. It should be noted that these attitudes are radically dissimilar – there is a group within which no problem is considered significant, whereas other groups emphasize organizational and financial risks. Hence, it seems clear that developing universal risk management tools is very difficult. Moreover, the analysis may give rise to a question whether the individual characteristics of specific events have been taken into account – depending on the organizers’ goals, some risks should be controlled (managed), whereas others seem to be irrelevant for the persons responsible for organizing a specific event.
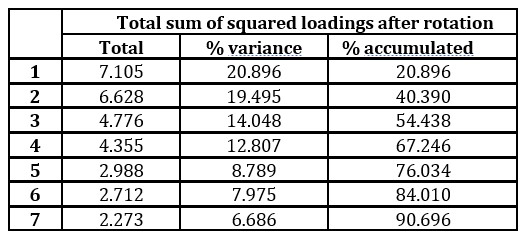
Negative values mean lower than average risk assessment of a given variable within the cluster, whereas positive values denote higher than average risk assessment. This explanation is subordinate to the key characteristics of the three types of organizers. The cluster analysis confirmed the frequently formulated financial and organizational aspects, as well as the approach, which takes account of risk assessment as an essential element of managing and organizing running events. It is reflected in a specific organizer’s status. If a city or a municipality organizes the event, they consider the financial risk less relevant, as the assurance of financial aspects is a part of the institution’s budget. Organizational aspects generate more risk for them. The present study uses the factor analysis in order to structure data and identify specific interrelations. Within the factor analysis, 7 components were identified, which allowed for explaining 91% of data variability (table 3).
Table 3. Identification of components within the factor analysis
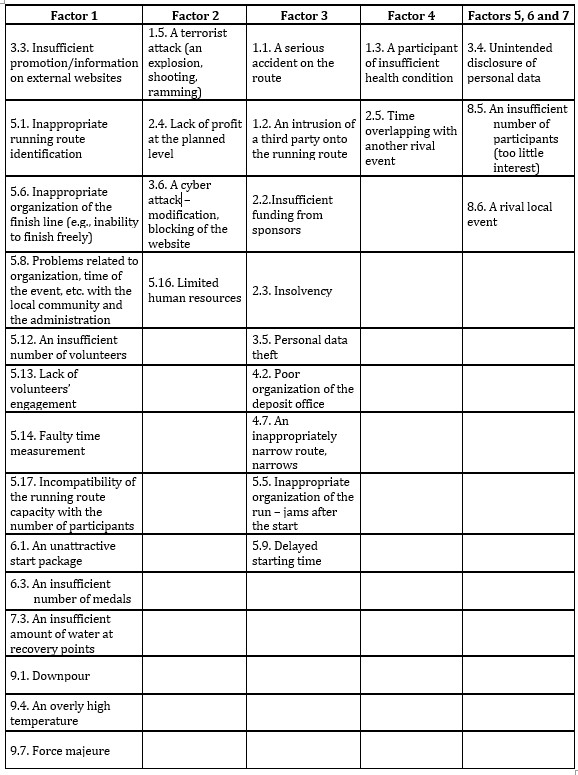
The risk factors explained by specific components were determined. It should be stated that the first factor refers mainly to issues directly related to the route – its identification, time measurement, capacity, start packages, access to water (recovery) and weather. The second and third factors are linked with budget issues and sports-unrelated questions, which may occur during the event – a terrorist attack, personal data theft, an intrusion of a third party onto the route, or problems with the deposit office (during competition). The fourth factor is associated with occurrences such as health problems of participants and competition in reference to an alternative running event (organized at the same time). The remaining factors include variables such as unintended personal data disclosure, or issues of too little interest from potential participants (table 4).
Table 4. Risk factor groups
During the factor analysis, one should take into account the fact that it aims at describing and arranging data. Hence, the factor analysis supports the alternative grouping of risk factors completed as a result of the preparatory research.
Conclusions
A factor analysis was performed to determine the source of factors, and also to determine in what area it is necessary to dedicate mitigation measures. Carrying out the factor analysis allowed to check if risks from one group are related to each other, or whether there are risk factors assigned in the questionnaire to different groups. As part of the factor analysis, 7 components were identified, explaining 91% of the variability of the data.
In addition, clusters were analyzed which allowed distinguishing three groups of marathon organizers. The first group (“no problem”) refers to low-risk objects. The second group (“business”) emphasizes financial aspects and combines the highest risk with insufficient profit, too little influence, limited liquidity as well as personnel and promotional problems. The third group (“organizers”) emphasizes the organizational risks (problems with the route, starter sets, volunteers, communication, image, related to personal data). At the same time, risks associated with finances are low in this group. This information is great input data in reliable risk management processes.
Disclosure Statement
The authors reported no potential conflict of interest.
References
Ammon R., Brown M. (2007). Risk management process, In: Law for recreation and sport managers (4 ed.), D.J. Cotten, J.T. Wolohan, J.T. (Eds.), Dubuque, IA: Kendall/ Hunt Publishing Company, 288-300.
Balicki A. (2013). Statystyczna analiza wielowymiarowa i jej zastosowania społeczno – ekonomiczne. Wydawnictwo Uniwersytetu Gdańskiego.
Berlonghi, A. (1990). The special event risk management manual, Dana Point, CA: Author.
Bjarnason, H.K., &Cannell, L.J. (1999). Organizing Events: Avoiding Risk and Promoting Safety. Vancouver, BC: Western Legal Publications.
Breiman L., Friedman J. H., Olshen R. A., Stone C. J., (1984). Classification and Regression Trees. Wadsworth and Brooks, 1984.
Brzeziński J., (1996). Metodologia badań psychologicznych, [Methodology of psychologicalResearch], Wydawnictwo Naukowe PWN, Warszawa.
Cronbach J. L., (2005). Współczynnik Alfa, a struktura wewnętrzna testów [Alphacoefficient and internalstructure of tests] (w Brzeziński J. (red), Trafność i rzetelność testów psychologicznych. Wybórtekstów, [Accuracy and reliability of psychological tests. Choice of texts]. Gdańskie Wydawnictwo Psychologiczne.
Czkór, D. (2014). ZapewnieniebezpieczeństwauczestnikomimprezbiegowychnaprzykładzieCracoviaMaraton [Ensuring the safety of participants of running events on the example of the Cracovia Marathon]. In K. Nessel, & E. Wszendybył-Skulska (Eds.), Młodzi o sporcie 2014. Bezpieczeństwo i organizatorzy imprez sportowych, (pp. 39-62). Kraków, Uniwersytet Jagielloński, Katedra Zarządzania w Turystyce. Retrieved from http://www.turystyka.uj.edu.pl /mos-2014-bezpieczenstwo-i-organizatorzy-imprez-sportowych (accessed on 25 May 2019).
Fuller, C., & Drawer, S. (2004). The Application of Risk Management in Sport.Sports Medicina, 34(6), 349-356.
Gatnar E, WalesiakM., (2012). Statystyczna analiza danych z wykorzystaniem programu R, [Statistical analysis of data using the R program],Wydawnictwo Naukowe PWN, Warszawa.
Grabiński T, Wydymus S., ZeliaśA., (1989). Metody taksonomii numerycznej w modelowaniu zjawisk społeczno-gospodarczych, [Numericaltaxonomymethods in modeling socio-economicphenomena], Wydawnictwo PWN, Warszawa.
Guyon I, Elisseeff A., (2003). An introduction to variable and feature selection. Journal of Machine Learning Research, 3(1),1157-1182.
Hanstad, D. V. (2012). Risk Management in Major Sporting Events: A Participating National Olympic Team’s Perspective. Event Management,16(3), 189-201.
Hornowska E., (2001). Testy psychologiczne. Teoria i praktyka [Psychologicaltests. Theory and practice], Wydawnictwo Naukowe Scholar.
Ketchen Jr D.J., Shook C. L., (1996). The application of cluster analysis in Strategic Management Research: An analysis and critique, Strategic Management Journal, 17(6), 441-458.
Łuczak J., Miśniakiewicz M., Saavedra J., Identification and Assessment of Risk Factors for Large-Scale Running Events from The Organizers’ Perspective. Marathon Case Study, 36th IBIMA Conference Proceedings.
Miller J. J., Wendt J. T. & Young P.C. (2010), Fourth Amendment consideration and application of risk management principles for pat-down searches at professional football games, Journal of Legal Aspects of Sport, 20(2), 108-134.
Milligan G. (1994).Issues in Aplied Classification: Selection of Variables to Cluser. Classification Society of North America, Newsletter, November, 37.
Miśniakiewicz M., Łuczak, J. (2014). Selected success factors of running events’ organizers and participants. In M. Lotko, J. Żuchowski& R. Zieliński (Eds.), Selected Aspects of Quality and Environmental Management (pp. 89-99). Radom, Wydawnictwo Naukowe Instytutu Technologii Eksploatacji – PIB.
Moyle B., Kennelly M., Lamont M. (2014). Risk Management and Contingency Planning in Events: Participants’’ Reaction to the cancellation of Ironman New Zealand 2012. International Journal of Event Management Research, 8(1), 94-106.
Nohr K. M. (2009).Managing Risk in Sport and Recreation: The Essential Guide for Loss Prevention. Champaign, IL: Human Kinetics.
Peters M., Pikkemaat B., (2005). The management of city events. The case of Bergsilvenrster in Inssbruck, Austria, Event Management, 9, 137-153.
Peterson R. A., (1994), A Meta-analysis of Cronbach’s Coefficient Alpha, Journal of Consumer Research, 21(2), 381–391.
Reid, S., & Ritchie, B. (2011). Risk management: Event managers’ attitudes, beliefs, and perceived constraints. Event Management, 15(4), 329-341.
Rescher N., (1983), Risk: A Philosophical Introduction to the Theory of Risk Evaluation and Management, University Press of America.
Shipway, R., Holloway, I., Jones, I., (2013). Organizations, practices, actors, and events: Exploring inside the distance running social world. International review for the Sociology of sport, 48 (3), 259–276. doi: 1177/1012690212442135.
Shone, A., Parry, B. (2004). Successful event management: A practical handbook, 2nd ed, UK: Thomson Learning.
Spengler J.O., Connaughton D., Pittman A.T., (2006), Risk Management in Sport and Recreation, Human Kinetics, Champaign.
Toohey K., Taylor K. & Choong-Ki L., (2003). The Fifa World cup 2002: the effects of terrorism on sport tourists.Journal of Sport & Tourism, 8(3), 167-185.
Walesiak M, Gatnar E. (2016). Metodystatystycznejanalizywielowymiarowej w badaniachmarketingowych, [Methods of statistical multivariate analysis in marketing research], Wydawnictwo AE, Wrocław.
Wilk J., Pietrzak M, Bivand R, Kossowski T. (2015). Wpływ wyboru metody klasyfikacji na identyfikację zależności przestrzennych – zastosowanie testu joint-count. [The impact of choosing a classification method on the identification of spatial relationships – the use of the joint-count test], PraceNaukoweUniwersytetuEkonomicznego we Wrocławiu, Taksonomia 24, Klasyfikacjaianalizadanych – teoria i zastosowania, DOI: 10.15611/pn.2015.384.32.
maratonypolskie.pl, Available on line, accessed on 15 June 2019.
Żuryński, R. (2013). Społeczno-ekonomiczneaspekty organizacji imprezsportowych [Socio-economic aspects of the organization of sporting events], Naukispołeczne,2(8), 254-269.