Naoual CHAOUNI BENABDELLAH, Karima MOUMANE, Ahmed ZELLOU and Kenza DOUIFIR
Software and Project Management Research Team, University Mohammed V of Rabat/ ENSIAS
Volume 2023,
Article ID 293513,
IBIMA Business Review,
17 pages,
DOI: https://doi.org/10.5171/2023.293513
Received date: 18 January 2023; Accepted date: 14 June 2023; Published date: 31 October 2023
Academic Editor: Sonda Ammar
Cite this Article as:
Naoual CHAOUNI BENABDELLAH, Karima MOUMANE, Ahmed ZELLOU and Kenza DOUIFIR (2023)," Moroccan Case Study: Comparison and Analysis of Two Prediction Techniques Applied to Grades", IBIMA Business Review, Vol. 2023 (2023), Article ID 293513, https://doi.org/10.5171/2023.293513
In case of special difficult conditions of teaching and learning, Schools can adopt online learning. Different platforms and modes can be adopted to study online as synchronous mode, and asynchronous mode. This paper is about to discuss the program case grades where they were urged to switch to learning management systems and asynchronous tools such as teams, meetings, and others during the pandemic. The objective is to analyze and predict grades to decide whether the online mode need to stands. Data description was conducted to compare before and after the Covid state of scored evolution. Data was gathered for five promotions starting from the third semester to the sixth. Only the grades of the third semester were considered in the prediction process. As a methodology of the study, a description process of data was conducted after the preprocessing stage where data was normalized and transformed. Then the new prediction was applied. It was compared to other studies. The results were discussed according to the case. Furthermore, two types of predictions were considered to analyze the grades obtained by attending in presence courses and grades obtained using online learning. These techniques are: exponential smoothing and time-series regression. The first one was applied to the overall modules that are at our disposal. And the second one was processed to modules of the third semester. This is to compare module 3.5 and the elements it compasses. The findings are that here is an overall increase in the average grades in the three upcoming years prediction. The focus is to analyze deeply the results of module 3.5. This module concerns software engineering. Results show in both applications of the serial smoothing and the time series regression that the prediction is going to be constant. This means that grades are not going to change. This result needs to be confronted with reality and to the grades of 2025.
Keywords: Prediction, online course, exponential smoothing, and time-series regression.
Introduction
As in many countries, educational institutes in Afghanistan were asked to conduct their classes online after the propagation of Covid-19. Being aware of the affected country, the technological facilities are limited. The population of the study was undergraduate students in Takhar University Afghanistan. (Noori, 2021)Power outages and the lack of a stable Internet connection meant that the online training was not consistent. This had a negative impact on the student’s performance. They testified about their feelings about not having studied for years. Based on statistical results, the study demonstrated a strong relationship between online education and the COVID-19 pandemic in Afghanistan. In addition, 35 heads of academic institutions in Nepal responded to a pre-prepared questionnaire (Pal et al., 2021). They attested that COVID-19 has negatively impacted the education system. The biggest challenges were the cancellation of board exams, irregularity of learning and skills development, assessments, restriction of study abroad, disruption of the enrollment cycle, inequality of access to education, and concern about the establishment of schools and universities. The lockdown has reduced student enrollment and increased the risk of dropouts. At the same time, the sector most affected by the COVID-19 pandemic is research activities in higher education. Research activities have been postponed and the laboratory remained suspended. During this pandemic, many children and adults compensate for the interruption of traditional educational services. They are obliged to adapt their learning process to new modalities. Pediatricians assume that it is critical to continue to check in with young patients about how they are coping and what assistance they need (“The Effect of Covid-19 on Education in Africa and its Implications for the Use of Technology,” 2020). Highlighting learning effectiveness of online and physical classrooms for dental education during the COVID-19 pandemic was another application in medicine domain. 37 Dental students from National Taiwan University were included in the study. In a course called “oral pathology and diagnosis”, students were given lectures, training in microscopic interpretation and dental chart writing, dental charting with classroom learning, followed by small group discussions with online learning. Their first exam was face-to-face and the second online. Most students felt that the online classroom learning had better learning efficiency (44.12%), while in the physical learning classrooms they had more ease to speak (38.24%). The study concluded that the combination of classroom and online courses is the future trend in dental education. Furthermore, in nursing, the study aimed to determine the factors affecting students’ success in distance education and to evaluate their experiences during their learning path. It was found that the main factors affecting the success of distance education were the organization of preliminary information, proficiency level of technological software use, economic status, proficiency level of the technological use of devices, and asynchronous learning (Karaaslan, et al., 2022). However, another study analyzes the involvement of caregivers in children’s education. They concluded that during COVID-19 the results are more unsatisfactory than they were before (Zhang, 2021). The research was based on several methodologies one of the following was Students’ responses from a survey. The analysis concerned the average assessment grades of those of the pre-lockdown and those of post lockdown at a South African university (Chisadza, 2021). They examined the impact of the academic performance of second-year economic students in the University of Pretoria when switching to online learning. Some students were negatively impacted by this change not because they were struggling academically but because of the inaccessibility to the Internet. They found that many approved learning online despite the technical barriers. They suggest enhancing the digital online platform and reducing the cost of the Internet for ensuring better results of learning of South African university students (Chisadza, 2021). Researchers in (Aucejo, 2020) surveyed approximately 1,500 students at one of the largest public institutions in the United States using an instrument designed to recover the causal impact of the pandemic on students’ current and expected outcomes. They found that 13% of students have delayed graduation due to COVID-19.
Performance Prediction of Students’ performance can be predicted by analyzing students’ interaction in a learning environment with other students and teachers (Sin Student & Muthu, 2015). Many works in investigating the impact of covid19 pandemic on academic results have applied predictions as in (TanMai, et al., 2022) they use the Random Matrix Theory for cleaning data. This was followed by the Minimum Spanning Trees (MST) to reflect the difference in learning behaviours of all students. Community Detection algorithm and statistical hypothesis tests were the methods for the analysis. The datasets contain students’ learning behaviors in two programming courses over two academic years with about 400 first-year students in a Medium-sized Metropolitan University in Dublin. Their contribution focused on the pre-processing stage to perform the prediction output. In addition, despite the analysis for the covid19 impact, in two articles (Akram, et al., 2018) (Hu & Rangwala, 2019) prediction of performance was applied using RNN architecture (i.e. LSTM) for grade prediction and reported that Lto could capture the temporal dynamics of students’ learning and to identify at-risk students.
This paper is divided into six sections, after the introduction which exposes most of the works related to the impact and the analysis of the grades obtained before and after the online learning, there is also a reporting of some other works regarding the applications of predictions and the techniques used. The methodology in the second section defines the description of data processed in the comparison. The third section stated the results obtained after applying the two techniques. The fourth section reported the results of both the techniques applied to each module separately besides the performance of prediction of the two techniques applied to all grades is performed. The fifth section is about the discussion and the analysis of the results. And finally, the sixth section is the conclusion that summarizes the work and gives tracks for further studies and other perspectives.
Related works
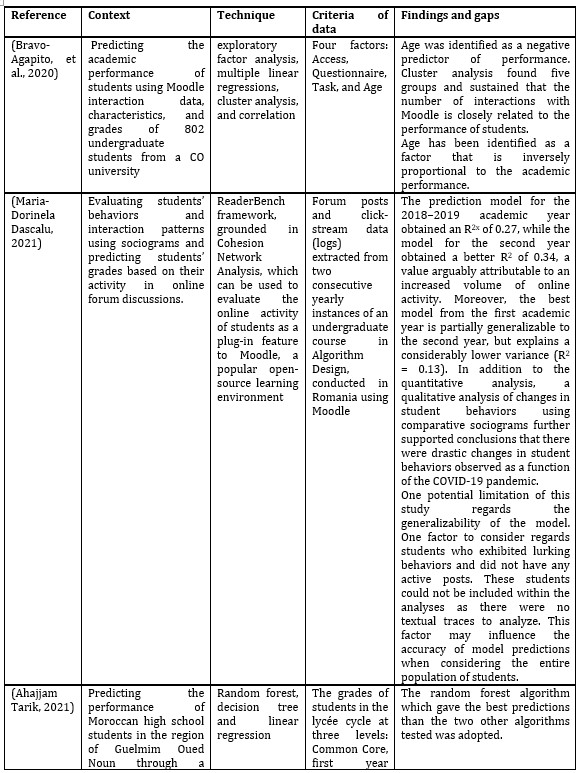
Several works have been carried out during the Covid 19 pandemic in the field of education to explore the performance of students whether during high school or university. The goal is to analyze the impact of the pandemic on the grades of students and find an efficient way to predict their productions and guarantee their success. The table below shows four of these works treated in different countries and using many different techniques of predictions.
Authors in (Bravo-Agapito, et al., 2020) worked on predicting the academic performance of students using Moodle interaction data, characteristics, and grades of 802 undergraduate students from a CO university. They used exploratory factor analysis, multiple linear regressions, cluster analysis, and correlation. Age was identified as a negative predictor of performance. Cluster analysis found five groups and sustained that the number of interactions with Moodle is closely related to the performance of students. Age has been identified as a factor that is inversely proportional to academic performance.
In addition, another paper (Maria-Dorinela Dascalu, 2021) evaluated students’ behaviors and interaction patterns using sociograms and predicted students’ grades based on their activity in online forum discussions. Many new techniques were used as ReaderBench framework, grounded in Cohesion Network Analysis, which can be used to evaluate the online activity of students as a plug-in feature to Moodle, a popular open-source learning environment. Data used in this research were forum posts and click-stream data (logs) extracted from two consecutive yearly instances of an undergraduate course in Algorithm Design, conducted in Romania using Moodle. The prediction model for the 2018–2019 academic year obtained an R2 of 0.27, while the model for the second year obtained a better R2 of 0.34, a value arguably attributable to an increased volume of online activity. Moreover, the best model from the first academic year is partially generalizable to the second year, but explains a considerably lower variance (R2 = 0.13). In addition to the quantitative analysis, a qualitative analysis of changes in student behaviors using comparative sociograms further supported conclusions that there were drastic changes in student behaviors observed as a function of the COVID-19 pandemic. One potential limitation of this study regards the generalizability of the model. One factor to consider regards students who exhibited lurking behaviors and did not have any active posts. These students could not be included in the analyses as there were no textual traces to analyze. This factor may influence the accuracy of model predictions when considering the entire population of students.
Same as our research in Morocco, other authors worked on predicting the performance of Moroccan high school students in the region of Guelmim Oued Noun through a recommendation system using AI during COVID 19. Using random forest, decision tree and linear regression, they collected data made on the grades of students in the lycée cycle at three levels: Common Core, first year baccalaureate, and second-year baccalaureate. The random forest algorithm gave the best predictions compared to the two other algorithms tested (Ahajjam Tarik, 2021).
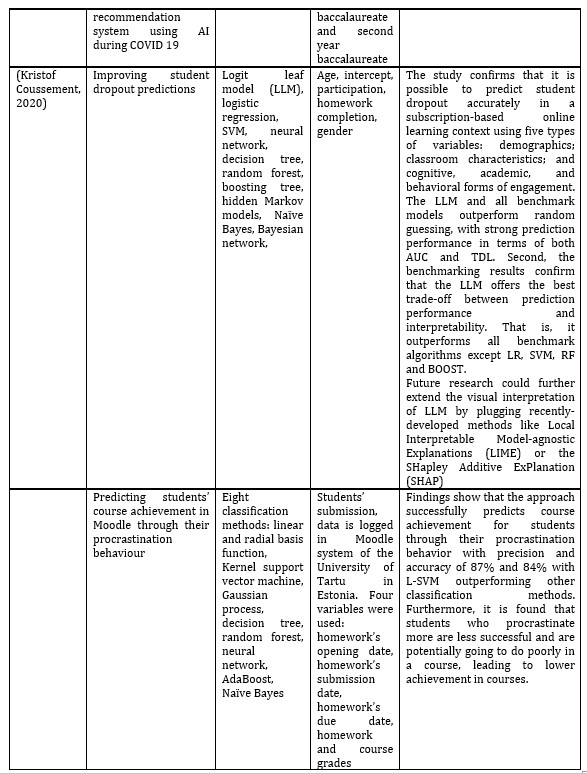
Furthermore, authors worked on improving student dropout predictions (Kristof Coussement, 2020). They used many techniques such as the Logit leaf model (LLM), logistic regression, SVM, neural network, decision tree, random forest, boosting tree, hidden Markov models, Naïve Bayes and Bayesian network. The study confirms that it is possible to predict student dropout accurately in a subscription-based online learning context using five types of variables: demographics; classroom characteristics; and cognitive, academic, and behavioral forms of engagement. The LLM and all benchmark models outperform random guessing, with strong prediction performance in terms of both AUC and TDL. Second, the benchmarking results confirm that the LLM offers the best trade-off between prediction performance and interpretability. That is, it outperforms all benchmark algorithms except LR, SVM, RF, and BOOST. Future research could further extend the visual interpretation of LLM by plugging recently-developed methods like Local Interpretable Model-agnostic Explanations (LIME) or the SHapley Additive ExPlanation (SHAP).
Authors in (Yeongwook Yang, 2020) focused on predicting students’ course achievement in Moodle through their procrastination behaviour. They used eight classification methods: linear and radial basis function, Kernel support vector machine, Gaussian process, decision tree, random forest, neural network, AdaBoost and Naïve Bayes. Data were made of students’ submission, data logged in Moodle system of the University of Tartu in Estonia. Four variables were used: homework’s opening date, homework’s submission date, homework’s due date, homework, and course grade. Findings show that the approach successfully predicts course achievement for students through their procrastination behavior with precision and accuracy of 87% and 84% with L-SVM outperforming other classification methods. Furthermore, it is found that students who procrastinate more are less successful and are potentially going to do poorly in a course, leading to lower achievement in courses.
Table 1: Summary of similar studies
Methodology
The methodology followed in this work started with a review of the art of state and a summary of some similar work where prediction was applied to scores. After reporting the related work, retrieving the necessary data for the study was conducted. The preprocessing was applied to structure data, and then a description was applied to understand the differences and the ups and downs of the grades in each period. The new prediction was then applied.
Data retrieval
The grades were provided for the five promotions. Each promotion takes three years at school. The first year is a common program. The study is related to a specific program that the specific courses are thought starting with the second year at school. To conclude, the scores retrieved are as it is known for semester three, semester four and semester five. The last semester of the program was not included.
Preprocessing
A great deal of information has been provided in an excel document which includes: name and surname of the student, graduation number, averages of the different modules, the validation index of the module and the average of the semester. It was found that there are some grades that are under 12 which is the grade that concludes if a student passed the module or not. In some cases, the student compensates and passes despite getting grades under 12. The prediction focuses on the scores’ predicting of each module and not the success of students. This is the reason why we kept the corresponding records to the case. Furthermore, the passing state is not important; no action has been applied to the grades that are not validated by students. The most important is the confidentiality that was respected during data process and the module code conversion was normalized. Another process is to apply a unique rounding after the comma. The rows were reviewed and the extra not pertinent information was removed from the dataset as the apogee number and the validity status. The modules were classified together for each promotion and composed of around 50 students.
Data description
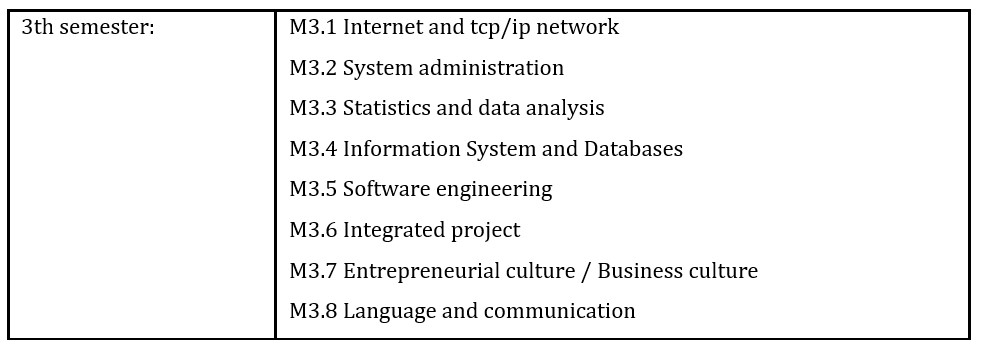
Eight modules are offered to engineering students. They take two years of preparation to get the average grade then they have access to the School. The first year is dedicated to the basic courses that are common to all the specialties and programs offered. The specific program of web and mobile engineering that we are interested in in this study starts from the second year. Almost all modules are composed of at least two courses that generally take around 22 hours of attendance including lectures and directed projects, hands on work. The semester is about four months. There are in total 8 modules in semester3, distributed as the following.
Table 2: Modules’ distribution
The third semester modules that occurred prior to the pandemic are those related to the class of 2018, 2019, 2020 and 2021. Only the class of 2022 studied the semester remotely. By class of 2022 we mean the year of its graduation after the three years spent in the whole course.
The third-semester modules that occurred before the pandemic are those related to the class of 2018, 2019, 2020, and 2021. Only the class of 2022 studied the semester remotely. By class of 2022, we mean the year of its graduation after the three years spent in the whole course. Figures below represent the distribution of the average total grades by module in comparison with the grades obtained for the online learning. The purpose is to evaluate the impact of the learning mode on the grades. Indeed, students are not the same and this may be a very important indicator that induce the results. On the other hands, according to the experience of several years in presence for the same modules the average grades have not deviated. This can be an answer and an argument to make the comparison with the learning mode. This last is more impacting than the changing level of students. It is to note that modules are thought by the same professors who have not changing this period the study is conducted and the grades are considered.
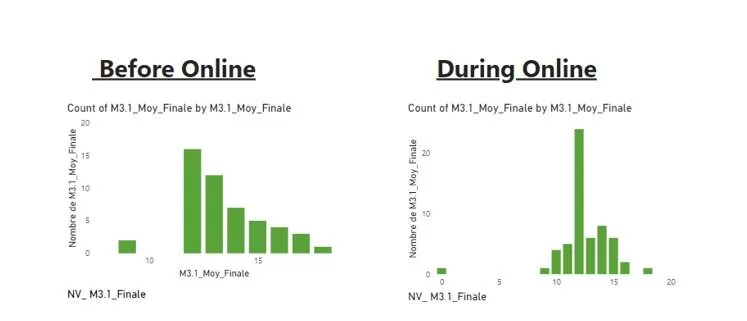
Figure 1: Comparison between notes obtained when the course was in
presence and notes obtained in online learning mode for the module 1
In Figure 1 the comparison of data show that the highest grade is the grade 12 out of 20. This last is when students were attending the course. The second distribution of students are concentrated in the second level in 13 out of 20. Moreover, the distribution is gradually less and corresponds to higher grade. Around 5 students obtained 15 out 20. When they moved to the online mode grade are distributed and the concentration is not changed but exceed the number of students having the same average 12 out of 20. Grades are not gradually distributed. There are around 7 students having 14 out of 20 and no one have 17 out of 20. Comparing this last with the presence mode there are in the contrary some students that have 17 out of 20.
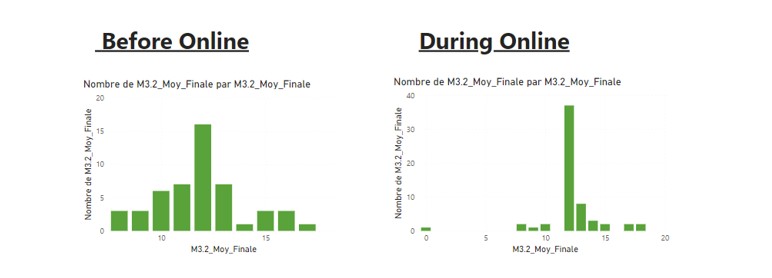
Figure 2: Comparison between notes obtained when the course was in
presence and notes obtained in online learning mode for the module 2
In Figure 2 the distribution of the average grade is different in the presence learning mode it is concentrating at 12 for the most students around 15. And many have less than 12 out of 20 and few but exist students who have obtained 16 and 17 out of 20. On the other hand, in the learning online mode, the average is for more than 35 students obtaining 12 out of 20 and less students compared with the presence learning mode have less than 12 out of 20. The conclusion is that online learning mode allow students to pass their module. And this goal concerns more students than those from the presence learning mode.
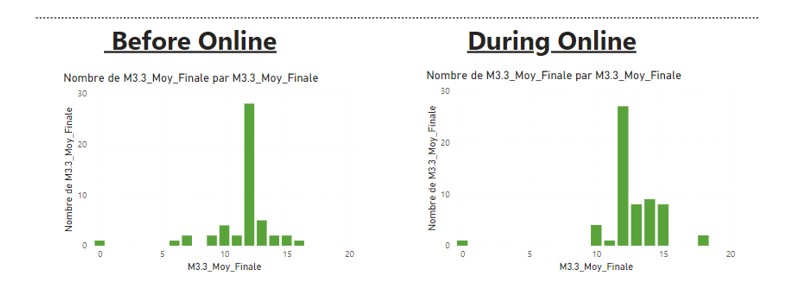
Figure 3: Comparison between notes obtained when the course was in
presence and notes obtained in online learning mode for the module 3
In Figure 3, It is clear that in online mode there are more students passing the module since the majority are distributed at the right side of the graph. More students are having 12, 13, 14, 15 out of 20. In the other side, in the left graph, more than 25 students are having 12 out of 20. And few are obtaining 13, 14, and 15 out of 20. And considering more are obtaining less than the valid and minimum grade to pass a course is 12 out of 20.
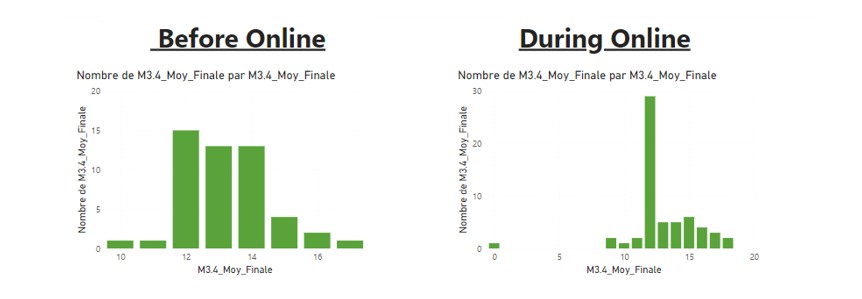
Figure 4: Comparison between notes obtained when the course was in
presence and notes obtained in online learning mode for the module 4
In Figure 4, the distribution of grades of the majority of students is distributed between 12 and 14. On the other side, in the learning online mode more than 25 are having just the minimum to pass which is 12 out of 20. Grade in this mode are gradually distributed for 5 to 7 students in the range of 13 to 18 out of 20. Less student failing the module are more slightly in the online mode.
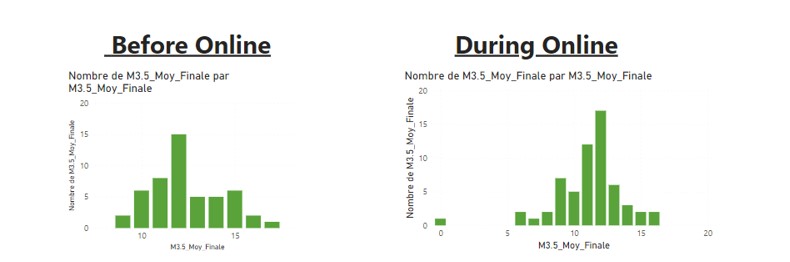
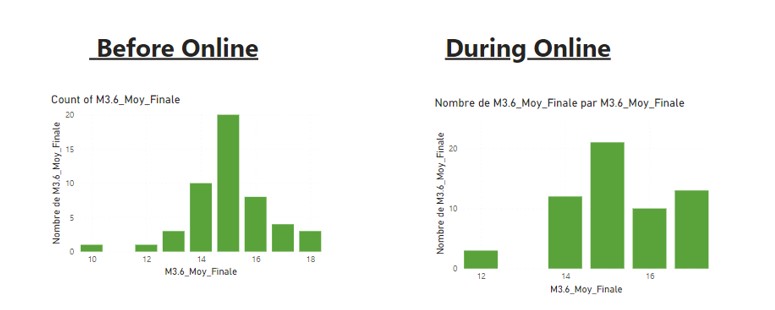
Figure 5: Comparison between notes obtained when the course was in
presence and notes obtained in online learning mode for the module 5
In Figure 5, there are more students that are failing the module and obtaining less than the minimum to pass which is 12 out of 20 in the graph at the right side. More than 10 obtained 11out of 20, around 5 obtained 10 out of 20. A little more obtained 9 and less 8 and 7 out of 20. Compared with the number of students that fail in the presence mode they are more than 5 students with the grade 11 and 6 with 10 and 2 with grade of 9 out of 20. For the good grades in presence mode students with 17 out of 20 exist compared to students in online mode the highest grade obtained is 16 out of 20 but by more students 4 students.
Figure 6: Comparison between notes obtained when the course was in
presence and notes obtained in online learning mode for the module 6
In Figure 6, all students validate in the online learning mode. The highest grade is 17 out 20 and more than 10 students are concerned. There are less than 5 students that pass with the minimum grade 12 out of 20. On the other side of the graph, the presence learning mode there are students who did not pass the module. The same distribution is for students who obtained the grade 15 out of 20.
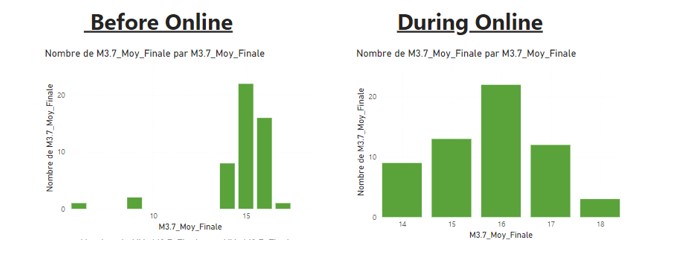
Figure 7: Comparison between notes obtained when the course was in
presence and notes obtained in online learning mode for the module 7
In Figure 7, all students are having grades between 14 and 18 out of 20 in the learning online mode. Before this mode grades are distributed where few have failed the module and good students are distributed between the range of 14 and 18 out of 20 similarly with the online ode with the difference of the number of students concerned. In the online mode there all students against 80% of them in the range of the good grades.
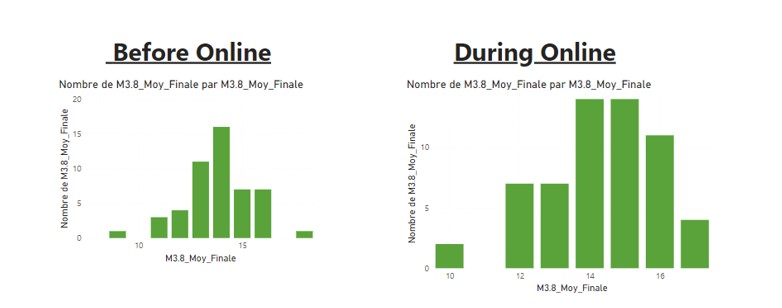
Figure 8: Comparison between notes obtained when the course was in
presence and notes obtained in online learning mode for the module 8
In Figure 8, in the presence mode there few students who obtained 9 out of 20. Some obtained 11 out of 20 and failed the course they are around 5 students. Around 16 students obtained 14 out of 20. And few obtained 17 out of 20. While just 3 students who did not pass the module and obtained 10 out of 20. Students who passed the module have obtained grades from 12 to 17 out of 20. With equally a concentration of students having 14 and 15 out of 20 and less having 16 out of 20.
Prediction Techniques application, comparison and results
In this section results are presented and analyzed. The first application that concerns the exponential smoothing was applied to all grades of the modules programmed in the third, the fourth, and the fifth semesters. A correspondence to the modules and the description of each graph are explained and summarized in the tables bellow. Regarding the application of the second method, it processed the modules of the third semester, and the observation of the graphs representing the averages in the upcoming years is explained.
Results of applying the exponential smoothing technique:
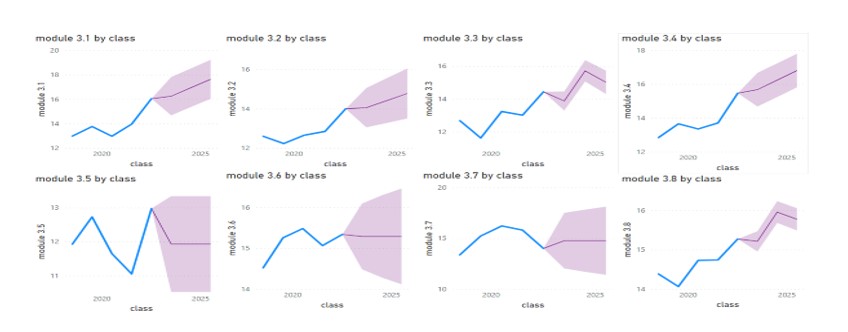
Figure 9:Prediction of 3rd semester modules with exponential smoothing
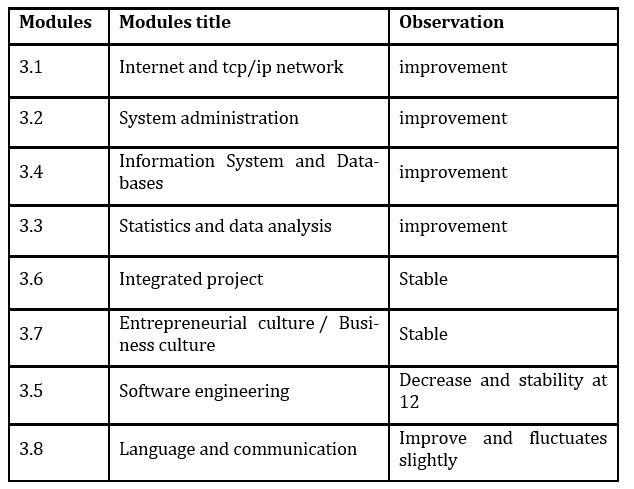
In Figure 9, the blue graph represents the changes in scores before and during Covid; the area on the last line is the prediction part. For module 3.1, grades using the learning management platform foster the improvement, and the prediction confirms this improvement; if the platform stands and is being used in teaching and evaluating students in many modules, there is improvement, stability and sometimes fluctuation. Grades’ improvement is observed in module 3.2 and module 3.4. These modules are System administration for the former and Information System and Databases for the last. On the contrary, modules 3.6 and 3.7 are stable and almost constant. These are related to Integrated project and Entrepreneurial culture / Business culture. The module 3.5 prediction of the its average is in decrease and stability at a constant of the grade 12, the minimum to get to pass a module. This module is Software engineering. The module 3.8, Language and communication, the prediction of grades is in progress and fluctuates slightly. As a summary of these results, below are the modules’ code with their titles, the observation and discussion according to these results Table 3.
Table 3: Results of Semester 3 Modules’ prediction
Results after applying the time series regression
The second forecasting method is the time-series regression model. The basic concept is that we forecast the time series of interest y (module average) assuming that it has a linear relationship with other time series x.
For 95% confidence intervals, t (3,0.025) =3.182. The standard error of the regression is the average distance that the observed values fall from the regression line. The standard error of the regression is particularly useful because it can be used to assess the precision of predictions. Error! Reference source not found. report the graphs that correspond to the prediction for each module.
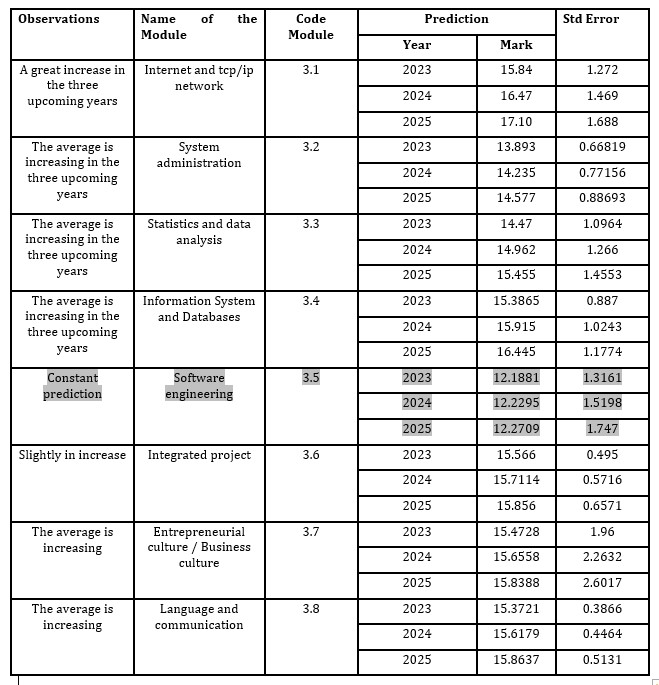
Table 4:Prediction grades and standard error of the time series regression forecasting model
In Table 4 results are reported. For each module the prediction for the 3 years 2023, 2024 and 2025. The average grade is mentioned in the table. This is because the overall grades potentially obtained by students are good when the average of the whole class is high. The highlighted lines do not correspond to the lowest low error of the performance. The followed section gives an overall summary of the performance of each technique applied to the whole grades.
The comparison between the two techniques
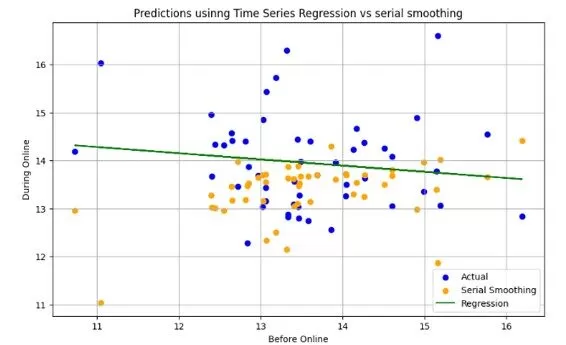
They overall grades have been used in the prediction using both techniques. As it is shown in Figure 10. There is three distributions the first is without prediction the second is by applying the exponential smoothing and the second the time regression.
Figure 10 : Comparison between the predictions with the serial smoothing and the time regression
Within the Serial Smoothing Metrics, the measures to evaluate the accuracy of the prediction are represented by values according to MAE, MSE, and RMSE. The mean absolute error represented by MAE is 1.16. The average magnitude of error represented is more important than the one measured with the time series Regression. The mean squared error that is represented by the abbreviation MSE is 2.53. the number is important. It represents the quality of an estimator. This number is higher than the measure with the time series regression technique. The root mean squared error is represented by RMSE and is computed at 1.59. At this measure too the value is bigger compared with the same type of measure computed when using the time series regression.
On the contrary Time Series Regression Metrics have been evaluated according to the same measures as the serial smoothing. The MAE is computed at 0.75. the value is less than the one obtained with serial smoothing. The MSE is found 0.90 and the RMSE has a value 0.95
Discussion
Since modules are numerous. One module is to analyze is to discuss. It is composed of two courses that are complete each other. The module is M3.5. It is to note that the majority of the professors are specialists in computer science and they are all aware of the possible activities to use online. How to exploit the online functionalities available? What was at their disposal were the Learning Management System Moodle of the University and all the features are accessible. A system of synchronous teaching is another option as Microsoft office team and all the features possible to use as the white board, the collaborative activities to communicate with students and to prepare tests. Classroom is the third option available for professors who opted for.
Regarding the module M3.5, it was shown in figure 1 that the scores before Covid are slightly better than after Covid. Comparing these results with the prediction, the graph in figure 3.5 is not different from other promotions grades. M3.5 is the second half of the second year, so the corresponding value in the coordinate axes is to be considered in half-average scoring per year. It shows an up-and-down average scoring between year 2018 and 2022; before Covid the scores are up and they are down after Covid. This explains the results in the previous Figure 1. After 2020, the grades were not at disposal and the prediction shows the decrease and takes a constant average counting from around the year 2023 if the methodology in teaching stands online.
The module M3.5 is composed of two courses; one is related to Unified modeling language and the other course is titled software engineering. This last is taught by a specialist in computer science and in using assistive online technologies; the methodology used in presence with his engineering students of the second year is collaborative activities, exposition, example-based explanations, formative and not planned evaluation. During Covid, the methodology was adapted to the situation and the teaching was in synchronous way on GoogleMeet. During the learning, the professor used to ask for small tests for evaluating the session’s objectives assimilation and the attendance of students. The final evaluation was processed on the Moodle platform of the university; the number of attempts was set to one attempt and the duration was calculated to the exact needed time to answer in order to control at the best. On the other hand, the Unified Modeling language was tough using the PowerPoint presentation besides using hands-on activities in presence before Covid. During the sanitarium situation, the professor used the synchronous method using GoogleMeet too and Microsoft team of the university as well. The evaluation was processed on Moodle using the same parameters’ number of attempts set to one and the duration is controlled and calculated to meet the time for another activity rather than taking the multiple-choice questions. Noting that the hands-on exercises are delivered online without visual supervision, the only aspect to consider in this situation is the joining members to work on the exercises. At the end of the session, the professor provides the correction, and is online all along the time to answer questions if necessary and required from students.
Conclusion
In this study, two methods were applied to the data set: the exponential smoothing and the time series regression. The exponential smoothing was applied to the overall data of the 15 modules that means modules of semester 3, semester 4 and semester 5, whereas the time series regression was processed to modules of semester 3. The purpose is to analyze an example in details. The example discussed is module 3.5 that contains two elements of the module. Comparing the results of the modules processing both the methods, the results are similar apparently. And need to be confronted to the reality to measure the better results. Indeed, they are going to be revised and more analyzed in 2025. The purpose of processing two algorithms is to measure the efficiency depending on the context.
It is essential to consider some factors as in (Karaaslan, et al., 2022). The provision of preliminary information, proficiency level of technological software use, economic status, proficiency level of use of technological devices, and asynchronous learning were considered. As a future work defining the other factors that impact the result is a direction to improve the use of the distance learning process and the efficiency of the course. Also, these factors are related to a specific field of study so they are dependent on the subject of each tough course. The performance of the prediction model is to improve, and the analysis regarding the features and the attributes that make the difference in the prediction is to vary and to improve. For each module there is a specific way that the professor undertakes in his teaching class; the technology used is another factor to consider.
These results of prediction are to consider by each professor. They have to discuss and analyze their specific methods in assessing and teaching students online and in presence. Since the comparison of the grades’ progress is impacted during covid by an improvement or a constant progress or a decrease. The overall process specific to each course is to be reviewed for an update according to the objectives stated in the program. This pandemic opened the opportunity to the e-learning alternative to shine and to prove its utility and its efficiency. This is not to say that it doesn’t need an adaptation or an additional work; on the contrary, the adaptation is to be made constantly according to the technology evolution.
References
Ahajjam Tarik, H. A. F. Y., 2021. Artificial Intelligence and Machine Learning to predict student performance during the COVID-19. s.l., s.n.
Akram, B. et al., 2018. Improving stealth assessment in gamebased learning with LSTM-based analytics. Proceedings of the 11th International Conference on Educational Data Mining, pp. 208-218.
Aucejo, E. M., 2020. THE IMPACT OF COVID-19 ON STUDENT EXPERIENCES AND EXPECTATIONS: EVIDENCE FROM A SURVEY.
Bravo-Agapito, J., J. Romero, S. & Pamplona, S., 2020. Early Prediction of Undergraduate Student’s Academic Performance in Completely Online Learning: A Five-Year Study. Computers in Human Behavior, pp. 1-27.
Chang, J. Y.-F., 2021. Comparison of learning effectiveness between physical classroom and online learning for dental education during the COVID-19 pandemic.
Chisadza, C., 2021. Online and face‐to‐face learning: Evidence from students’ performance during the Covid‐19 pandemic.
Hoofman, J. & Secord, E., 2021. The Effect of COVID-19 on Education. Pediatric Clinics of North America, 68(5), pp. 1071-1079.
Hu, Q. & Rangwala, H., 2019. Reliable deep grade prediction with uncertainty estimation. The 9th International Learning Analytics & Knowledge Conference, pp. 76-85.
Karaaslan, M. et al., 2022. Undergraduate nursing students’ experiences of distance education during the COVID-19 pandemic. Journal of Professional Nursing, Volume 38, pp. 74-82.
Khadka Bahadur Pal, B. B. B., 2021. Education system of Nepal: impacts and future perspectives of COVID-19 pandemic.
Kristof Coussement, M. P. A. D. C. D. F. B. A. R., 2020. Predicting student dropout in subscription-based online learning environments: The beneficial impact of the logit leaf model. s.l., s.n.
Maria-Dorinela Dascalu, S. R. M. D. D. S. M. M. C. T. R. S. T.-M., 2021. Before and during COVID-19: A Cohesion Network Analysis of students’ online participation in moodle courses.
Noori, A. Q., 2021. The impact of COVID-19 pandemic on students’ learning in higher education in Afghanistan.
Sin Student, K. & Muthu, L., 2015. Application of big data in education data mining and learning analytics–a literature review. ICTACT JOURNAL ON SOFT COMPUTING, 5(4).
TanMai, T., Bezbradica, M. & Crane, M., 2022. Learning behaviours data in programming education: Community analysis and outcome prediction with cleaned data. Future Generation Computer Systems, Volume 127, pp. 42-55.
Yeongwook Yang, D. H. M. P. M. W. Y.-M. H. H. L., 2020. Predicting course achievement of university students based on their procrastination behaviour on Moodle.
Zhang, X., 2021. Barriers and benefits of primary caregivers’ involvement in children’s education during COVID-19 school closures. International Journal of Disaster Risk Reduction, Volume 66, p. 102570.