1,3GOVCOPP – Research Unit on Governance, Competitiveness and Public Policies, DEGEIT – Department of Economics, Management, Industrial Engineering and Tourism, University of Aveiro, Campus Universitário de Santiago, Aveiro, Portugal
2GOVCOPP – Research Unit on Governance, Competitiveness and Public Policies, Aveiro Institute of Accounting and Administration, University of Aveiro, Campus Universitário de Santiago, 3810-193, Aveiro, Portugal
Volume 2024,
Article ID 963956,
IBIMA Business Review,
10 pages,
DOI: https://doi.org/10.5171/2024.963956
Received date: 23 October 2023; Accepted date: 19 January 2024; Published date: 12 February 2024
Academic Editor: Kátia Lemos
Cite this Article as:
Luís COSTA, Elisabete VIEIRA and Mara MADALENO (2024)," Does Googling Impact Euronext Stock Returns?", IBIMA Business Review, Vol. 2024 (2024), Article ID 963956, https://doi.org/10.5171/2024.963956
This study intends to analyze a potential connection between the number of Google searches and Euronext stock returns, considering also the impact that investor sentiment has on stock returns. For this purpose, we analyzed Euronext companies’data from 2017 to 2021, using the Generalized Method of Moments (GMM) methodology. The results show that the number of Google searches had no significant impact on Euronext stock returns. However, the evidence suggests that investor sentiment has a negative association with Euronext stock returns, meaning that good investment opportunities are found and the highest returns are obtained in periods of extreme pessimism. Therefore, the results of this study can have significant implications for private and institutional investors that invest in Euronext shares, providing insight that can help the decision-making process. This article is original because it analyzes the impact that the number of Google searches has on the Euronext stock exchange, and because no similar study for this financial market existed before. The same applies to investor sentiment. Lastly, the GMM methodology was employed as a method to improve the empirical analysis accounting for endogeneity, providing more robust results.
Keywords: Stock Returns; Euronext; Google Search; Investor sentiment
Introduction
The determination of the indicators that influence the variation of the value of the shares of companies traded in the capital markets is one of the most current and relevant subjects in financial theory and, simultaneously, one of the most researched topics in finance (Ayaz et al., 2021). The theoretical literature emphasizes that, for a conscious decision about buying or selling a stock, investors need to have endogenous and exogenous knowledge of companies (Costa, 2022a). This issue should not be dissociated from the theory of efficient markets, according to which markets are efficient when stock prices reflect all available information (Fama, 1970). However, the behavior that the economic agents have demonstrated in the investments that they make has not been entirely rational (Hirshleifer, 2001; Baker et al., 2004; Aziz and Ansari, 2021). Thus, in recent decades, a new area of research in finance has emerged, closely associated with psychology, designated by Behavioural Finance. This theory is compounded by some biases. One of them is that the investor has non-rational feelings and emotions that can affect the stock price (Baker and Wurgler, 2007). Another bias of this theory is the assumption that attention is scarce, so investors cannot possess all the information about all the stocks (Kahneman, 1973). Merton (1987) concluded that the level of attention spent on a given stock is reflected in the increased demand for information, suggesting that investor attention may be relevant to market activity.
More recently, research has emerged that studies the association between information search and the behavior of companies’ stocks (Ekinci and Bulut, 2021). According to Kim et al. (2019), the Google search engine is clearly and unequivocally the most popular and most used information search platform in the world. About 90% of Internet searches are carried out through this platform (Harford, 2017). The StatCounter website (2023) indicates that, between January 2017 and December 2021, the average use of the Google search engine worldwide was around 92%.
According to Salisu et al. (2021), changes in the volume of searches for a particular stock on Google can signal a change in the level of attention, with consequences in investors’ decision-making. Thus, if an individual search for a stock on Google increases, this fact signals an increase in the attention of individuals to that stock in the entire population. In this context, aggregate search frequency on Google is a direct and unambiguous measure of attention (Da et al., 2011; Bank et al., 2011).
The main objective of this work is to analyze the relationship between the volume of searches on Google and the variation in the value of Euronext stocks. A great addition that this study will implement in comparison to the existent empirical studies analyzed is the fact that there is still no similar study that encompasses this set of stock markets. Another objective of this study is to enquire whether investor sentiment has an impact on the return of Euronext stocks for comparison with the literature that has emerged in this field, related to other markets. Furthermore, this objective constitutes an additional contribution to the existent literature bringing novelty to these empirical studies. Finally, the present article contributes to the existing literature by applying the GMM methodology as a robustness measure accounting for endogeneity, as traditionally the issue emerges when dealing with annual financial company data.
The article is structured as follows. Section 2 presents the literature review. In section 3, the methodology, the database used, the criteria for defining the sample, and the variables used in the empirical part are presented. In section 4, the results are shown and discussed. Finally, the study’s key findings and its limitations are exposed along with suggestions for future research.
Literature Review
Ekinci and Bulut (2021), in their study for the Istanbul Stock Exchange, state that attention is a key factor in selecting stocks to buy among the large number available. The authors recall Barber and Odean (2008), who indicate that individual investors are net buyers of attention-grabbing stocks. Individual investors are more likely to buy a stock when their level of attention increases because they do not have enough time or resources to analyze the thousands of stocks in the capital market.
The study by Da et al. (2011) is often referred to in the literature as the first work to propose the volume of searches performed on Google Search as a proxy for investor attention. In their study on the Russell 3000 index, the authors studied the relationship between Google searches and stock prices. They found that increasing online search volume has a positive relationship with stock returns in the two weeks that follow. That result is then reversed after that period. These results are in line with those of Barber and Odean (2008) and therefore greater attention should result in a temporary rise in prices and eventual reversal. Similar results are found by Bijl et al. (2016) and Aziz and Ansari (2021).
Adachi et al. (2017) investigated the relationship between investor attention and stock price movements on the Japanese stock exchange. The authors indicate that a positive relationship exists between the volume of searches performed on Google Search and the stock price. Unlike previous studies that reported a reversal following an immediate rise in stock prices, these results demonstrate the possibility that an immediate rise in company stock returns may not be neutralized in the long run. Similar results are identified in studies by Takeda and Wakao (2014) in Japan, Swamy et al. (2019) in India, Ekinci and Bulut (2021) in Türkiye and Ayaz et al. (2021) in Pakistan.
Lestari et al. (2022), in their research for the Jakarta Islamic Index, used the specific characteristics of companies, including size, profitability, indebtedness, and liquidity. They also analyzed investor attention to stocks through the number of searches for the company’s ticker symbol on Google Search. The results showed that the size, profitability, and liquidity of companies positively affected stock returns. Additionally, the leverage and the number of Google searches proved insignificant in determining the variation in the price of companies’ stocks. Other authors, such as Kim et al. (2019), Gowki and Behnamrad (2019), Tan and Taş (2019), and Ekinci and Bulut (2021), also concluded that no association exists between investor attention and stock returns.
Nguyen et al. (2019) report that the number of Google searches significantly reduces annual stock returns in the Philippines, Thailand, and Vietnam. However, no evidence was found for the Indonesian stock market. Finally, the authors found a positive and statistically significant relationship between the number of searches and the return of Malaysian stocks.
Supported by the major part of the conclusions in the analyzed literature, we propose our first hypothesis:
H1: There is a positive and significant relation between the number of Google searches and the variation in the price of the stocks of companies listed on Euronext.
Miller (1986) suggests that behavioral finance can help solve long-standing anomalies in financial markets. Indeed, there is a vast literature documenting the measurability of investor sentiment and its impact on stock prices. Although different proxies are used to measure sentiment, the general conclusion is that sentiment is highly correlated with stock returns (Hirshleifer, 2001; Brown and Cliff, 2004; Schmeling, 2009).
Qiu and Welch (2004) indicate that investors are overly optimistic (pessimistic) because of good (bad) news. On the other hand, Baker and Wurgler (2007) concluded that investor sentiment leads to an overestimation of expected cash flows that are not easily substantiated by companies’ economic and financial data.
Costa (2022a) indicates that a consensus does not exist in the literature about the relationship between sentiment and stock returns. On the one hand, some studies indicate a negative association between sentiment and stock returns (Brown and Cliff, 2004; Baker and Wurgler, 2007; Schmeling, 2009; Neves et al., 2018; Costa, 2022a), while some other studies indicate the opposite. Namely, studies conclude that there is a positive association between these two variables, as is the case of the study by Fisher and Statman (2003), Vieira et al. (2018), and He et al. (2020).
Supported by the analyzed literature, we propose our second hypothesis:
H2: There is a negative and significant relationship between investor sentiment and the variation in the price of the stocks of companies listed on Euronext.
Data, Variables, Methodology
Sample
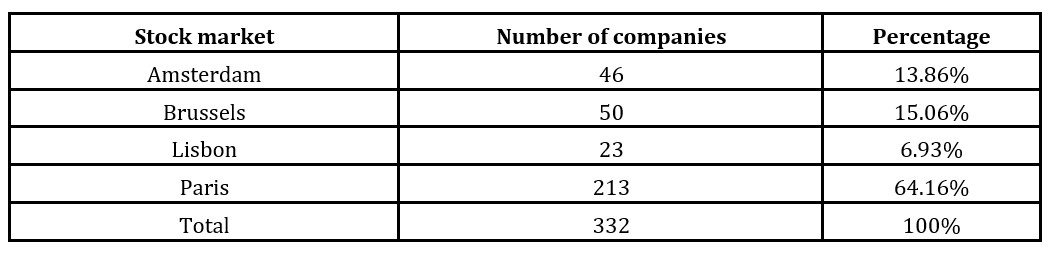
We used a sample of companies listed on the Euronext stock exchange, including the financial centers in Amsterdam, Brussels, Lisbon, and Paris. Considering the studies by Ribeiro and Quesado (2017), and Costa et al. (2021), the present study will exclusively select the constituent companies from each financial center that do not belong to the financial system and sports companies, as they are governed by different accounting standards. Besides, and considering the impact of exchange rates on the value of stock prices, only quotes from companies that were transacted in euros were selected (Costa, 2022a). Finally, we excluded companies that do not report annual accounts on the 31st of December (Costa, 2022b). Our final sample covered the period from 2017 to 2021, containing 332 companies.
Table 1 reports the distribution of the sample by country. Only companies that were listed on the stock exchange before 2017 and remained after 2021 were selected. The French market has the highest number of stocks, and that is reflected in the total percentage (64.16%). Moreover, the Portuguese market has the lowest number of companies with a total of 23.
Table 1: Distribution of the sample by country
Annual data on the economic and financial variables of companies were obtained from the website of The Wall Street Journal (Davis et al., 2021). The sample size is explained by the impossibility of obtaining older data from the site. The Wall Street Journal website also enabled the acquisition of data on stock prices, as well as on the reference indices of the centers where companies are listed. The European Economic Sentiment Indicator (ESI) has been removed from the European Commission’s website (Vieira, 2011). Finally, Google Trends was used to collect the number of searches for the ticker of companies’ stocks (Nguyen et al., 2019).
Variables used
Dependent variable
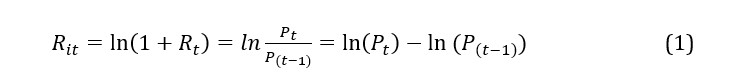
Din (2017), Neves et al. (2018), Vieira et al. (2019), and Costa (2022b) argue that the dependent variable that should be used in this type of study is the stock return. Thus, the dependent variable implemented in this investigation is the logarithmic change in stock prices ( ), which is obtained by the difference between the value of prices on December 31 of the year t ( ) and the stock price of the companies on December 31 of the previous year ( ), as described in Equation 1.
Independent variables
As the main independent variables to test our previously stated hypotheses, we used ESI representing the Economic Sentiment Indicator and Investor attention (Goog) which is the Total Google search for stock ticker computed as the natural logarithm of the Total Google search for the stock ticker.
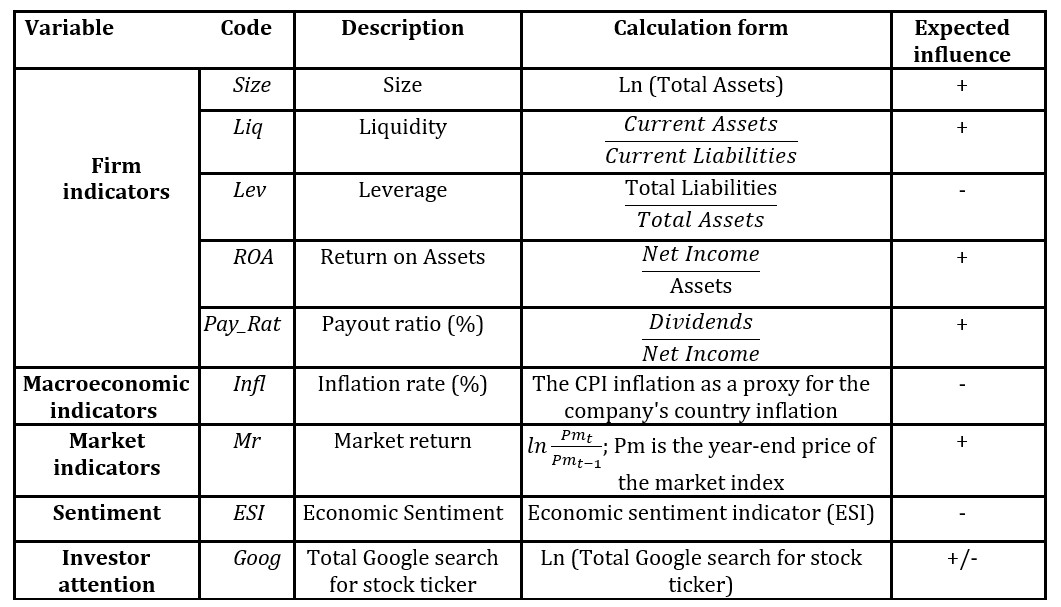
We added a set of control indicators to the model, suggested by previous studies, that are company-specific, macroeconomic, and market-related. Concerning indicators that are specific to companies, indicators of size, liquidity, leverage, profitability, and dividends were introduced (Neves et al., 2018; Vieira et al., 2018; Vieira et al., 2019; Li et al., 2020; Costa et al., 2021; Costa, 2022b). At the macroeconomic level, we also included the inflation rate (Nguyen et al., 2019). Finally, the return of the reference index of the stock exchange on which the company is listed is included (Din, 2017).
Table 2 presents the independent variables used, as well as the calculation method and the expected sign of influence.
Table 2: Presentation of the independent variables
Methodology
In this study, we will use the GMM methodology, as the model may suffer from endogeneity, which can lead to biased estimates. The GMM method can help control endogeneity and other problems by estimating model parameters more efficiently (Newey and Windmeijer, 2009; Wooldridge, 2010; Gujarati, 2022).
The literature refers to the importance of making variables stationary in time series analysis. Variables are stationary when their mean, variance, and autocovariance do not change over the sample period. If a time series is not stationary, statistical analysis can produce misleading or inaccurate results (Hamilton, 2020). First differences subtract from each value in the time series the value that precedes it, which can help remove the overall trend of the time series and make it stationary (Johnston and DiNardo 1997; Hamilton, 2020). In this work, we are going to use the first differences to make the variables stationary.
Descriptive statistics and correlations between variables
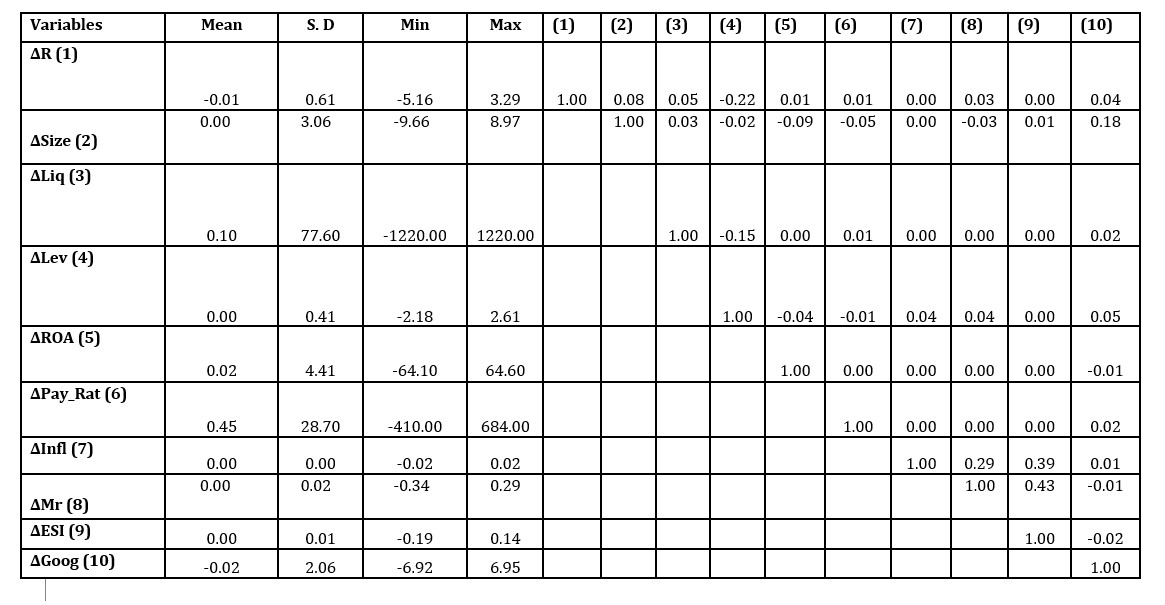
Table 3 presents descriptive statistics and correlations between the variables used.
Table 3: Descriptive statistics and correlations between variables
Except for stock returns and the number of Google searches, all variables show positive values when averaged. Regarding correlations, there is no strong correlation, which enhances the accuracy of the used set and ensures the non-existence of multicollinearity (Maroco, 2007; Costa and Matias, 2020).
Econometric Analysis
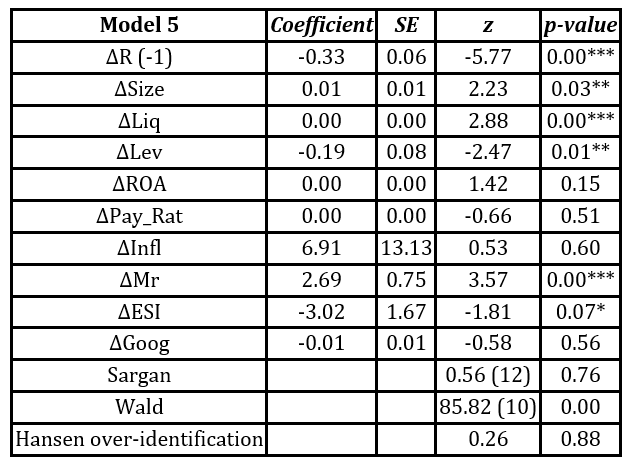
In Table 4, we estimate model 1 through the two-phase GMM methodology with level equations.
Table 4: Estimation results of the Models (1)
Notes: It is important to mention that the consistent asymptotic standard error of heteroscedasticity is in parentheses; the Sargan test with a p-value greater than 5% shows that the instruments are valid and the test values in parentheses represent degrees of freedom; the Wald test has a p-value of less than 5 percent, which means that the joint significance and coefficients are significant asymptotically distributed as χ2 under a null hypothesis of no significance, with degrees of freedom in parentheses. Hansen’s test indicates that the restrictions are consistent with the observed data and the econometric model is valid. The total number of observations is 654. Variables are defined in Table 2. T statistics; *** significance level of 1%, ** significance level of 5%, * significance level of 10%.
The results obtained suggest that investor attention, measured through the number of Google searches on the ticker of stocks, has an insignificant effect on the return of Euronext stocks. These results are consistent with the results presented by Lestari et al. (2022) and suggest that the search volume for a particular stock does not help build a profitable stock trading strategy.
The proxy that identifies investor sentiment shows a negative and statistically significant coefficient, which suggests that there is a non-rational part in determining stock returns (Schmeling, 2009; Neves et al., 2018). These results demonstrate that it is in periods of extreme pessimism that good investment opportunities can be found and greater returns obtained. This can result in an investment strategy, based on behavioral finance, which is nothing more than buying from bears and then selling to bulls. Thus, it is important to note that hypothesis 1 was not validated and, on the contrary, it was possible to validate hypothesis 2.
The size of companies shows a positive and statistically significant sign, a result that corroborates the results presented by Ribeiro and Quesado (2017). These results suggest that the larger the size of the companies the lower the expected rate of change in the price of their stocks, an important aspect for investors, especially in times of great uncertainty. On the other hand, the results obtained may also indicate that larger companies enjoy advantages over smaller companies, resulting from obtaining economies of scale and scope.
A company’s liquidity appears to exert a positive and statistically significant effect on stock returns. These results suggest that investors tend to prefer stocks that increase their solvency level in the short term, given the consequent improvement in their financial condition and the lower level of instability to which their managers are subject. These results corroborate the study by Costa et al. (2021).
Regarding the level of leverage, the results of this article indicate that it has a negative and statistically significant effect on the determination of the variation in the price of the stocks of the companies that integrate the Euronext. These results are in line with those obtained in the study by Meurer et al. (2020), to the extent that the more indebted the companies are, the greater the net means generated that must face the assumed responsibilities, plus interest, thus leaving fewer financial resources to remunerate the capital invested by the shareholders in the acquisition of a company’s stocks. In other words, the greater the proportion of a company’s liabilities in its assets, the greater its risk will be, with it being reflected in the evolution of the market price of its stocks.
Contrary to the studies by Lestari et al. (2022) and Din (2017), the ROA, dividend policy, and inflation rate did not prove to be statistically significant indicators in determining the return on Euronext stocks.
As expected, a positive and statistically significant impact seems to exist between the return provided by the benchmark index of the market where companies are listed and the return of their stocks. These results are in line with the studies by Din (2017). According to the authors, stock benchmarks tend to reflect the evolution of economic activity in the countries where companies operate. The fundamental values of companies’ stocks ultimately reflect the real economic activity as measured by industrial production or domestic product (GDP).
Conclusion
Google Trends contains large amounts of aggregated data about Internet searches. In this article, we study whether the number of searches on Google has a significant influence on the return of Euronext stocks. This empirical study focused on the period between 2017 and 2021, in a sample composed of companies that integrate the financial centers of Euronext, namely Amsterdam, Brussels, Lisbon, and Paris.
We found evidence that investor sentiment has a significant influence on stock returns and that it is in times of extreme pessimism that stocks tend to provide higher returns. These results are robust even when company-specific, macroeconomic, and market-related indicators are introduced.
Finally, it is important to note that the present study remains incomplete because it does not consider the geographic location where the searches are carried out. Chi and Shanthikumar (2016) find that companies are searched for more intensely by individuals who are closer to their headquarters. In this context, the suggestion for future investigations is that a similar study be performed that considers the place where the searches are carried out.
References
Adachi, Y., Masuda, M., and Takeda, F. (2017), ‘Google search intensity and its relationship to the returns and liquidity of Japanese startup stocks,’ Pacific-Basin Finance Journal, 46, 243-257, doi: 1016/j.pacfin.2017.09.009.
Ayaz, B., Ullah, H., Khan, M. K., and Jan, S. (2021), ‘The effect of google search volume index on the stock market excess returns. Evidence from listed firms in Pakistan stock exchange,’ Review of Education, Administration and LAW, 4 (1), 23-35, doi: 47067/real.v4i1.108.
Aziz, T., and Ansari, V. A. (2021), ‘How Does Google Search Affect the Stock Market?. Evidence from Indian Companies,’ Vision, 25 (2), 224-232, doi: 1177/0972262920985368.
Baker, M., and Wurgler, J. (2007), ‘Investor sentiment in the stock market,’ Journal of economic perspectives, 21 (2), 129-152, doi: 1257/jep.21.2.129.
Baker, M., Ruback, R. S., and Wurgler, J. (2004), ‘Behavioral corporate finance: A survey (No. w10863),’ National Bureau of Economic Research, 1, 60.
Bank, M., Larch, M., and Peter, G. (2011), ‘Google search volume and its influence on liquidity and returns of German stocks,’ Financial markets and portfolio management, 25, 239-264.
Barber, B. M., and Odean, T. (2008), ‘All that glitters: The effect of attention and news on the buying behavior of individual and institutional investors,’ The review of financial studies, 21 (2), 785-818, doi: 1093/rfs/hhm079.
Bijl, L., Kringhaug, G., Molnár, P., and Sandvik, E. (2016), ‘Google searches and stock returns,’ International Review of Financial Analysis, 45, 150-156, doi: 1016/j.irfa.2016.03.015.
Brown, G. W., and Cliff, M. T. (2004), ‘Investor sentiment and the near-term stock market,’ Journal of empirical finance, 11 (1), 1-27, doi: 1016/j.jempfin.2002.12.001.
Chi, S., and D. Shanthikumar. (2016), ‘Local bias in Google search and the market response around earnings announcements,’ The Accounting Review, 92, 115-143, doi: 2308/accr-51632.
Costa, J., and Matias, J. C. (2020), ‘Open innovation 4.0 as an enhancer of sustainable innovation ecosystems,’ Sustainability, 12 (19), 8112, doi: 3390/su12198112.
Costa, L. M. (2022a), ‘Determinants of Annual Abnormal Yields of Stocks belonging to the Euro stoxx 50 Index,’ European Journal of Applied Business and Management, 8 (2).
Costa, L. M. (2022b), ‘The impact of productivity on Euronext stock returns,’ European Journal of Applied Business and Management, 8 (4).
Costa, L., Ribeiro, A., and Machado, C. (2021), ‘Determinantes do preço de mercado das ações: evidência empírica para o PSI 20,’ Revista Gestin, 22, 41-53.
Da, Z., Engelberg, J., and Gao, P. (2011), ‘In search of attention,’ The journal of finance, 66 (5), 1461-1499, doi: 1111/j.1540-6261.2011.01679.x.
Davis, S. J., Liu, D., and Sheng, X. S. (2021), ‘Stock prices and economic activity in the time of coronavirus,’ IMF Economic Review, 1-36, doi: 1057/s41308-021-00146-4.
Din, W. U. (2017), ‘Stock return predictability with financial ratios: Evidence from PSX 100 index companies,’ Available at SSRN 3077890, doi: 2139/ssrn.3077890.
Ekinci, C., and Bulut, A. E. (2021), ‘Google search and stock returns: A study on BIST 100 stocks,’ Global Finance Journal, 47, 100518, doi: 1016/j.gfj.2020.100518.
Fama, E. F. (1970), ‘Efficient capital markets: A review of theory and empirical work,’ The journal of Finance, 25 (2), 383-417, doi: 2307/2325486.
Fisher, K. L., and Statman, M. (2003), ‘Consumer confidence and stock returns,’ The Journal of Portfolio Management, 30 (1), 115-127, doi: 3905/jpm.2003.319925.
Gowki, S. A. M., and Behnamrad, M. (2019), ‘Predicting Stock Market Activity: Role of Google Search Engine,’ Journal of Financial Management Strategy, 7 (27), 195-219.
Gujarati, D. N. (2022), Basic econometrics, Prentice Hall, Boston, U.S.
Hamilton, J. D. (2020), Time series analysis, Princeton university press, U.S.
Harford, T. (2017), Fifty things that made the modern economy, Hachette, UK.
He, G., Zhu, S., and Gu, H. (2020), ‘The nonlinear relationship between investor sentiment, stock return, and volatility,’ Discrete Dynamics in Nature and Society, 2020, doi: 1155/2020/5454625.
Hirshleifer, D. (2001), ‘Investor psychology and asset pricing,’ The journal of Finance, 56 (4), 1533-1597, doi: 1111/0022-1082.00379.
Johnston, J., and DiNardo, J. (1997), Econometric methods, McGraw-HiU, U.S.
Kahneman, D. (1973), Attention and effort, 1063, 218-226, Englewood Cliffs, NJ: Prentice-Hall.
Kim, N., Lučivjanská, K., Molnár, P., and Villa, R. (2019), ‘Google searches and stock market activity: Evidence from Norway,’ Finance Research Letters, 28, 208-220, doi: 1016/j.frl.2018.05.003.
Lestari, S., Kurniasih, R., and Sutrisno, T. A. (2022), ‘Can Company Characteristics and Google Search Increase Stock Returns? An Evidence from Jakarta Islamic Index’ In International Conference on Sustainable Innovation Track Accounting and Management Sciences (ICOSIAMS 2021), Atlantis Press, 73-78, doi: 2991/aebmr.k.211225.012.
Li, T., Xiang, C., Liu, Z., and Cai, W. (2020), ‘Annual report disclosure timing and stock price crash risk,’ Pacific-Basin Finance Journal, 62, 101392, doi: 1016/j.pacfin.2020.101392.
Maroco, J. (2007), Análise estatística com utilização do SPSS, Edições Sílabo, Portugal.
Merton, R. C. (1987), ‘A simple model of capital market equilibrium with incomplete information,’ Journal of Finance, 1869-87.
Meurer, R., Noriller, R., Huppes, C., de Sousa, A., and Arakaki, K. (2020), ‘Relation between the stock return and endogenous variables of latin american cmpanies from utilities sector,’ Negócios em projeção, 11(1), 45-58.
Miller, M. H. (1986), ‘Behavioral rationality in finance: The case of dividends,’ Journal of Business, S451-S468.
Neves, M. E. D., Sousa, M., and Barbosa, C. (2018), ‘Determinantes da rendibilidade das ações: um estudo de empresas cotadas na Euronext Lisbon,’ Portuguese Journal of Finance, Management and Accounting, 4 (7).
Newey, W. K., and Windmeijer, F. (2009), ‘Generalized method of moments with many weak moment conditions,’ Econometrica, 77 (3), 687-719, doi: 3982/ECTA6224.
Nguyen, C. P., Schinckus, C., and Nguyen, T. V. H. (2019), ‘Google search and stock returns in emerging markets,’ Borsa Istanbul Review, 19 (4), 288-296, doi: 1016/j.bir.2019.07.001.
Qiu, L., and Welch, I. (2004), ‘Investor sentiment measures,’ National Bureau of Economic Research, doi: 3386/w10794.
Ribeiro, A., and Quesado, P. (2017), ‘Fatores Explicativos da Rendibilidade Anormal Anual das Ações,’ European Journal of Applied Business and Management.
Salisu, A. A., Ogbonna, A. E., and Adediran, I. (2021), ‘Stock‐induced Google trends and the predictability of sectoral stock returns,’ Journal of Forecasting, 40 (2), 327-345, doi: 1002/for.2722.
Schmeling, M. (2009), ‘Investor sentiment and stock returns: Some international evidence,’ Journal of empirical finance, 16 (3), 394-408, doi: 1016/j.jempfin.2009.01.002.
Swamy, V., Dharani, M., and Takeda, F. (2019), ‘Investor attention and Google Search Volume Index: Evidence from an emerging market using quantile regression analysis,’ Research in International Business and Finance, 50, 1-17, doi: 1016/j.ribaf.2019.04.010.
Takeda, F., and Wakao, T. (2014), ‘Google search intensity and its relationship with returns and trading volume of Japanese stocks,’ Pacific-Basin Finance Journal, 27, 1-18, doi: 1016/j.pacfin.2014.01.003.
Tan, S. D., and Taş, O. (2019), ‘Investor attention and stock returns: Evidence from Borsa Istanbul,’ Borsa Istanbul Review, 19 (2), 106-116, doi: 1016/j.bir.2018.10.003.
Vieira, E. S. (2011), ‘Investor sentiment and the market reaction to dividend news: European evidence,’ Managerial Finance, doi: 1108/03074351111175100.
Vieira, E. S., Henriques, A. F. C., and Neves, M. E. (2018), ‘Fatores determinantes do desempenho das empresas portuguesas cotadas,’ Estudos do ISCA, (17), 1-19, doi: 34624/ei.v0i17.124.
Vieira, E. S., Neves, M. E., and Dias, A. G. (2019), ‘Determinants of Portuguese firms’ financial performance: panel data evidence,’ International Journal of Productivity and Performance Management, 68 (7), 1323-1342, doi: 1108/IJPPM-06-2018-0210.
Wooldridge, J. M. (2010), Econometric analysis of cross section and panel data, MIT press, U.S.