Yoni Delgado Chuque, Maria Isabel Flores Bazan, Angela Giovana Maza Chumpitaz and Neicer Campos Vasquez
Universidad Privada del Norte, Lima, Perú
Volume Vol. 2025,
Article ID 635545,
IBIMA Business Review,
17 pages,
DOI: 10.5171/2025.635545
Received date: 13 May 2024; Accepted date: 1 October 2025; Published date: 21 October 2025
Academic Editor: Ricardo De la Hoz Lara
Cite this Article as:
Yoni Delgado Chuque, Maria Isabel Flores Bazan, Angela Giovana Maza Chumpitaz and Neicer Campos Vasquez (2025)," Influence of the Application of Lean Logistics in SMEs (Pharmacies) to Reduce Logistics Costs “, IBIMA Business Review, Vol. 2025 (2025), Article ID 635545, https://doi.org/10.5171/2025.635545
The objective was to analyze and propose improvements for the product storage area through the application of Lean Logistics principles. A general diagnosis of the inventory process was conducted, with a focus on the storage area (critical area). Problems and their evidence were analyzed, and short- and medium-term proposals were developed. Flow diagrams and Pareto charts were created to assess the impact of these problems on productivity using the JIT (Just-In-Time) and Heijunka systems. Quantitative methods were employed to present the results. By implementing the Heijunka methodology, waiting times for product delivery were reduced from 49% to 21%. Additionally, the application of the JIT methodology increased storage accuracy from 80% to 99%, and inventory turnover experienced a significant improvement.
Keywords: Productivity, Just In time, inventory, Heijunka
Introduction
Currently, there is an economic crisis worldwide, left by COVID-19, in which many people died, others were hospitalized, and many others were left with sequelae even with treatment to recover.
Faced with this reality, in Peru, pharmaceutical companies benefited due to the high demand for products to combat COVID-19, as reflected in the study carried out by the National Institute of Statistics and Informatics (INEI) in the period 2019 and 2020, which indicates that 87% of the total Peruvian household spending was allocated to medicines made in pharmacies (Andujar Palao y otros, 2021).
However, many pharmaceutical companies experience difficulties in controlling their products, poor programming, expiration and obsolescence of products and, consequently, high storage costs, which do not add value to the supply chain. In this sector, most employees do not have constant training and training to be able to perform their jobs efficiently; there is no good management to reduce costs, which in the end impacts the profitability of companies, slowdown in product development and loss of market share (Torres Caceres & Calsina Miramira, 2020).
According to Angeles, in his research on Lean Logistics methods in the logistics operational processes of a product chain, he concluded under the Kaizen tool the company obtained as a result an
improvement of 40/60 points making it a competitive company (Angeles, 2017). Likewise, De la Vega, Gutiérrez and Leal, specify in their study of the methodological system based on Lean Logistics for the improvement of logistics processes in a medium-sized company, through the analysis of the logistics procedure of the company and the descriptive study by surveys to the leaders and administrative, They propose improvements of a new one through a diagram analysis of process operations and layout redistribution, minimizing downtime, labour costs, demarcation of zones and equipment rental, thus allowing to reduce expenses and generate profitability to the company going from 17 to 50 million (De la Vega y otros, 2017).
Lean Logistics began to be used in 1980, in the automotive industry in Japan; it is based on identifying, recognizing, and eliminating activities that do not generate value for the supply chain. Likewise, it can be defined as the correct delivery of the products, at the right time and in the right place; this can involve suppliers and manufacturers. It is also the link of companies through ascenders and descendants of goods, services, and information, to reduce waste (Mesa & Carreño, 2020).
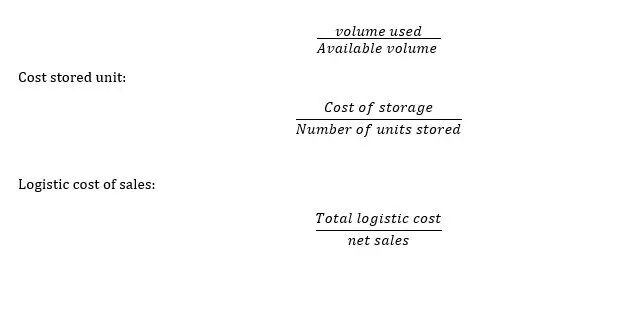
The causes that end logistics costs can be seen in the Pareto chart, figure 2. Logistics costs are those that involve the activities of ordering, maintaining, and storing pharmaceutical products in the warehouses of the company. They can be calculated as follows:
Chávez Vargas, Joyce (Chavez Vargas, “Diseño de propuesta de mejora para la gestión de inventarios y almacenes mediante un sistema de Lean Logistics para la reducción de costos en la empresa Ferreyros S.A, 2019)in the research work “Design of improvement proposal for the management of inventories and warehouses through a Lean Logistics system for cost reduction in the company Ferreyros S.A.”, whose objective is to demonstrate that through the application of Lean Logistics, it is possible to reduce costs in the company Ferreyros S.A. The study used the tools KAIZEN, 9 ́S, analysis and classification ABC, and layout distribution, having as a result a profitability of S /.10,118.33 which was obtained over 5 years, highlighting that for each S /. 1 investment earns S /. 1.64.
The research study seeks the optimal plan based on the use of Lean Logistics tools, such as Just in Time and Heijunka, for the improvement of warehouse management to reduce inventory and warehouse costs in the Ferreyros company. In the research, we seek to answer precisely, explaining through the results to what extent a plan based on the use of Lean Logistics tools will improve warehouse management in the pharmaceutical industry. The general objective of the research is to determine to what extent a plan, based on the use of lean logistics model tools such as JUST IN TIME AND HEIJUNKA, improves warehouse management for the reduction of logistics costs in the pharmaceutical company (Low Sui & Gao , 2011).
Method
The present research study according to its purpose is of applied type, since it proposes to solve the problem of high logistics costs, through lean Logistics tools.
It is descriptive when observing the problems in which the management of the supply of pharmaceutical products is found. It is explanatory when giving the proposals for improvement that will allow a reduction of costs. It is non-experimental because inferential simulation is used, and it is transversal that the company’s information will be collected and used (Wiśnicki y otros, 2024).
Direct observation- It is carried out in the logistics area, to identify the activities and the function that each worker fulfils.
For this, permission was requested from the general manager of the company and the plant manager to make observations of the inventory management process, storage, and logistics costs, to find the cause of the most relevant problem through the Ishikawa diagram. The following instruments were used for time taking Stopwatch, Camera.
Interview- It is composed of 10 questions between open and closed. This interview has the objective of collecting the information from the perspective of the person in charge of the administration of the warehouse. The interview is conducted after coordination and authorization from the line of command superior to the interviewee. At the end of this interaction, the information is processed to define the main problems.
Documentary analysis and historical data- The documentation of the warehouse was reviewed. The most relevant documents that were reviewed were the physical records of the consumption vouchers, and referral guides to verify if the fields in these documents collect the appropriate information. Likewise, the historical records of income and exits of the 2021 period (Kardex digital) were evaluated to generate the performance indicators of the current process (Rewers y otros, 2019).
The research will carry out a descriptive statistical analysis, where the data of each of the independent and dependent variables will be tabulated, analyzing averages, and the comparative figures before and after the improvement proposal will be presented.
Description of the process in the company
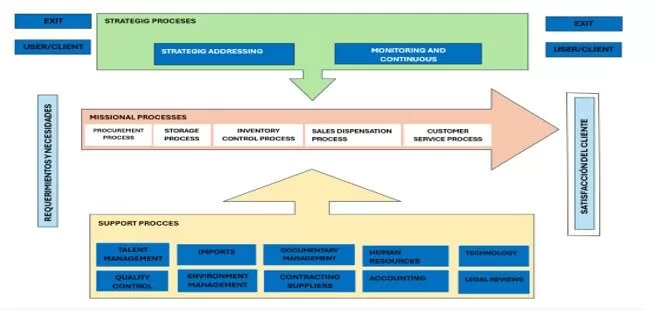
In the company, three processes are identified: strategic process, missionary process and support process. The strategic process consists of strategic direction monitoring and continuous improvement. Missionary processes are also identified: procurement process, storage process, inventory control process, sales dispensing process and customer service process. Finally, the support process consists of: quality, accounting, finance, human resources, and systems (Zapata-Cortes y otros, 2020).
Figure 2: Pharmaceutical Company Process Map
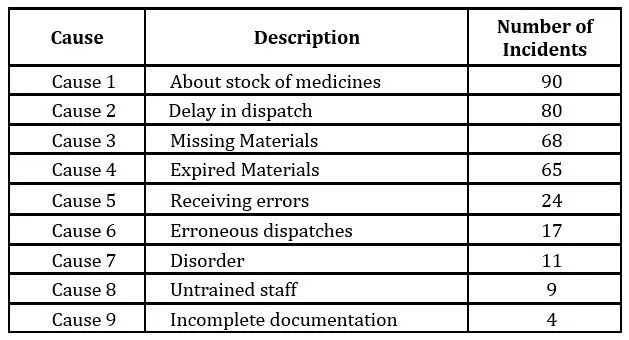
Table 1. Main causes of cost overruns in the area of operations
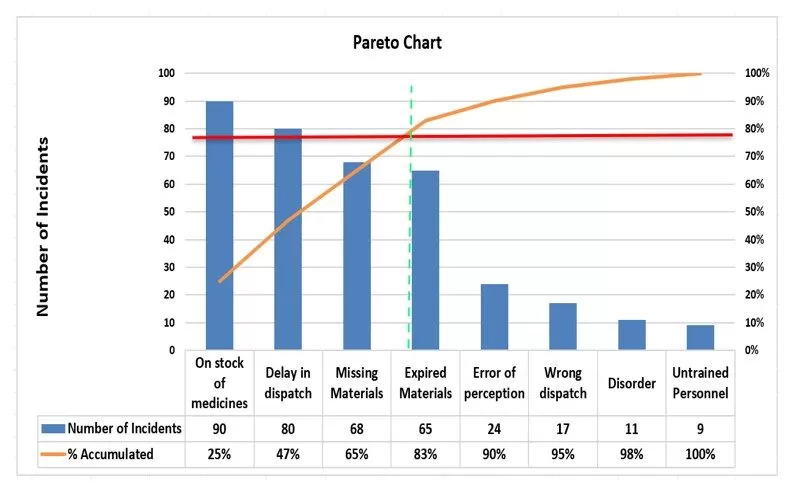
The Pareto tool determines the number of problems that occur most frequently and that comprise 80% of the causes of the pharmaceutical company’s cost overrun
Figure 3. Pareto chart of the main
It is recorded in the Pareto chart in figure 3 that the most important causes that generate problems in the processes are stock of medicines, delays in dispatch and missing materials.
Application process
In the research, the Lean Logistics, Just In Time, and Heijunka methods are applied in a traditional pharmacy of the pharmaceutical company, where there is constant rotation of products; this depends on customer demand, which is why the main causes of over cost are seen (Bermúdez Hernández y otros, 2014).
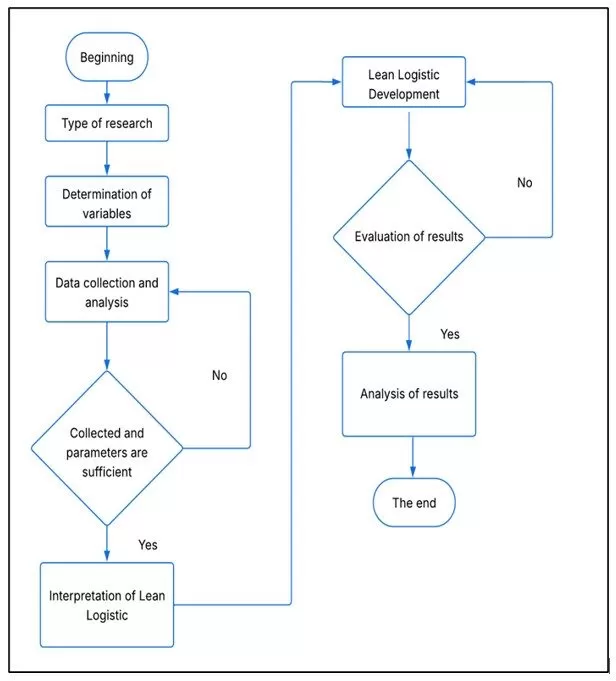
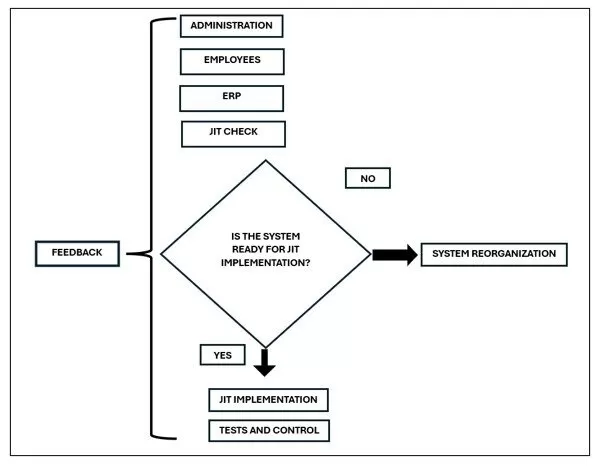
Figure 4. Algorithm for JIT implementation. Radisic
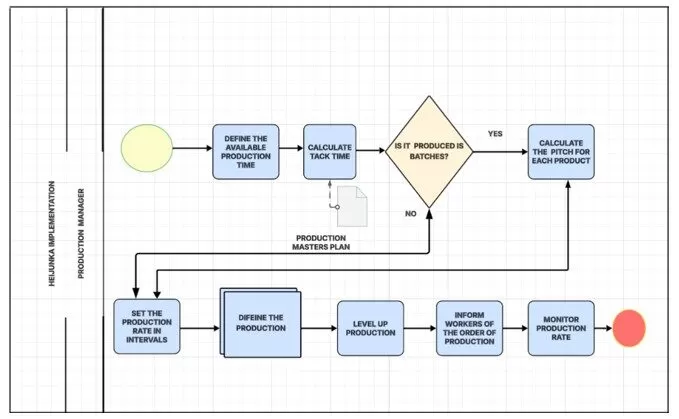
Figure 5. Algorithm for the implementation of Heijunka.
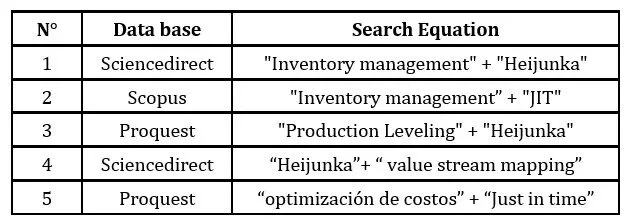
For the development of the research, research works were taken according to the Language, seniority, and as the main strategy the main keywords of the research in Spanish were considered: “Systems”, “Management”, “Inventory”, and in English: “Systems”, “Management” and “Inventory”
Table 2. Databases and search equation
The databases with the highest percentage were considered. Engineering-related publications; The study It considered the following inclusion and exclusion criteria: C1: Items older than 5 years, allow have relevant and up-to-date information, it was considered Scientific articles as of 2017. C2: Items older than 3 years, allow have relevant and up-to-date information, it was considered Scientific articles as of 2019. C3: Items older than 5 years, allow have relevant information, it was considered Scientific articles as of 2017.
The classification of valid articles for research took into consideration the inclusion and exclusion criteria and the years of publication. Duplicate articles were discarded for not providing more information.
Results
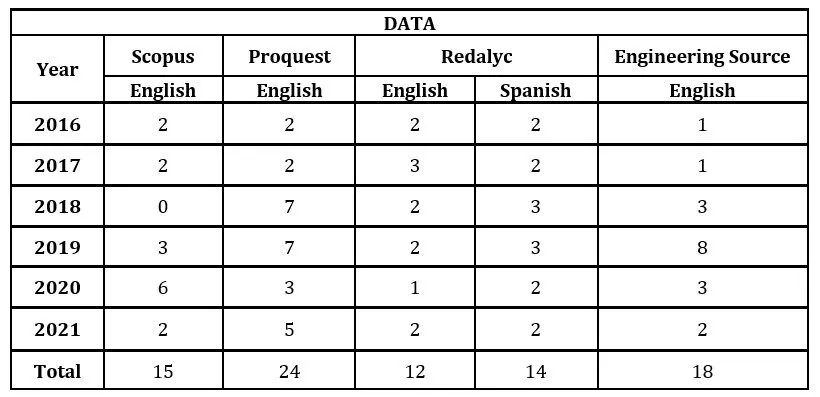
The search for the trend of Lean logistics research in the pharmaceutical sector was carried out, using the systematized search of the literature, obtaining 83 articles in the last 5 years, with the English and Spanish languages, as shown in Table 3.
Table 3. Valid articles, source of information, language, and year.
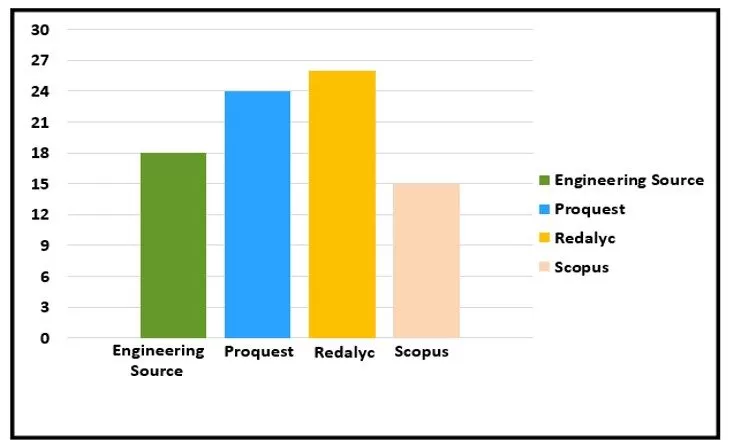
Figure 6 shows the number of total articles obtained from the data search, noting that most of the literature was obtained from Redalyc, with 26 research articles.
Figure 6. Articles found by database
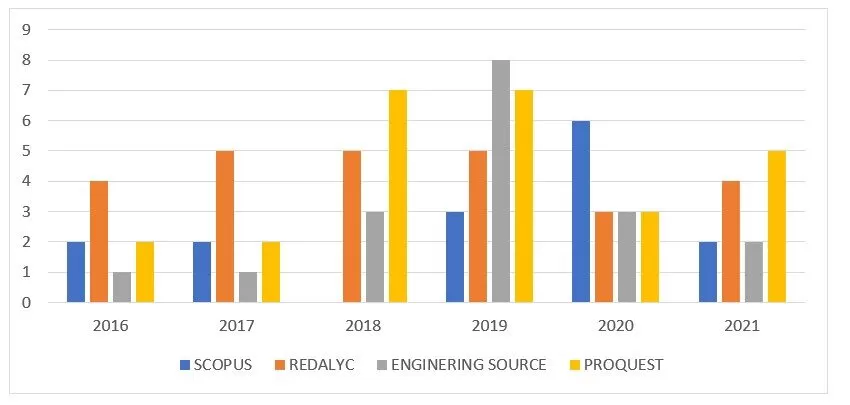
Figure 7 shows the trend of the last 5 years of the publications of articles that are related to our research topic; more articles can be observed in 2019 by the Engineering Source database with 8 investigations regarding the required topic.
Figure 7. Trend of articles in the last 5 years
By analyzing the 83 research articles found from the different databases, with the theme of Lean Logistics, we can infer that this tool is important to be able to identify, eliminate and optimize.
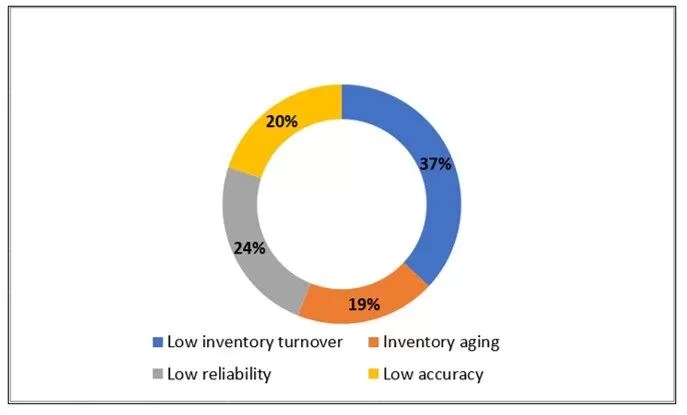
Also, another problem of the finished products’ warehouses of the pharmaceutical sector is the overcost due to low inventory turnover which represents 37%, the age of inventory 19%, low reliability 24% and accuracy 20% of the total percentage of problems identified (Angeles, 2017).
Figura 8. Problemas de almacén de PT en farmacéutica
Implementation of the HEIJUNKA system
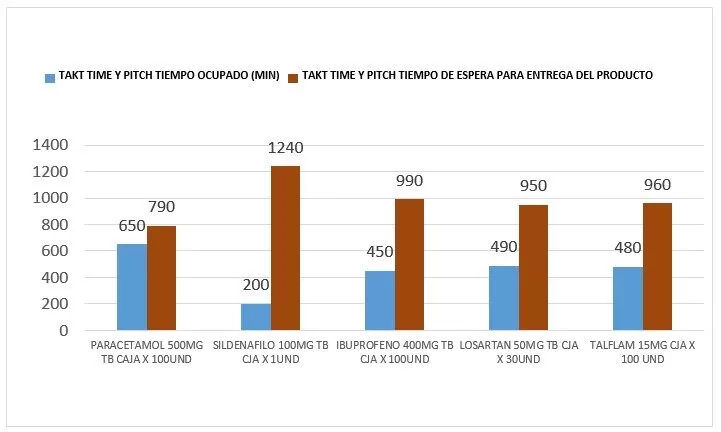
For the implementation of the Heijunka system, the takt time and pitch system were taken as an access point for the verification of waiting times for the delivery of a product or pharmaceutical input.
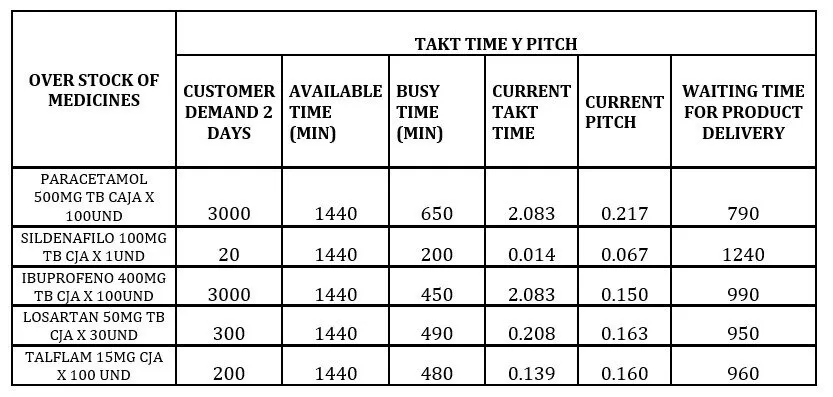
Table 4 shows 5 products or inputs that as a result of the classification by means of the takt time and pitch show a high waiting time for the delivery of each product
Figure 9. Busy time and medication delivery wait time.
It is recorded in the Pareto chart in figure 9 the busy time VS the waiting time for the delivery of pharmaceutical products, yielding approximately 49.30% before a high disorder of the system.
Table 4. Takt time and pitch of medicines, which have a longer delivery waiting time
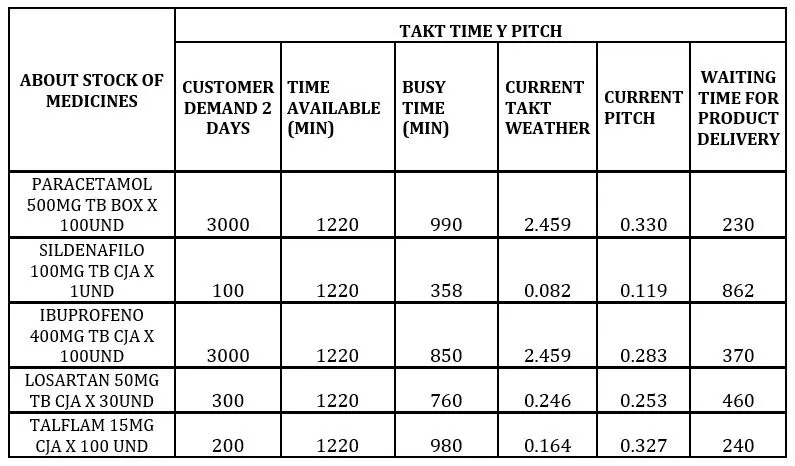
Table 5. Takt time and pitch of medicines, which presents shorter waiting time for product delivery
Table 5 shows 5 products or inputs that as a result of the improvement of the classification through the takt time and pitch show a low waiting time for the delivery of each product.
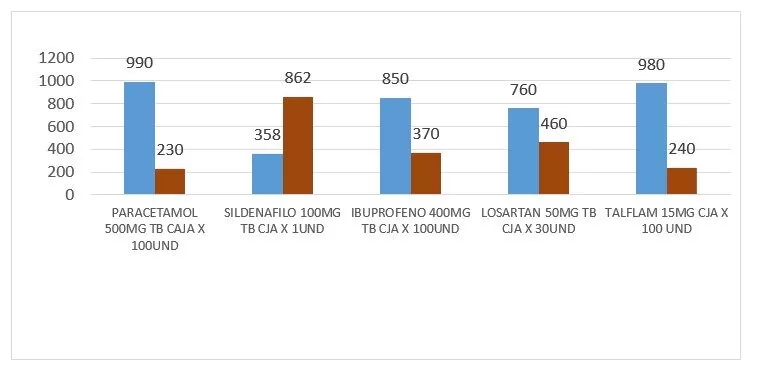
Figure 10. Busy time and medication delivery wait time after improvement.
It is recorded in the Pareto chart in figure 10 that the busy time VS the waiting time for the delivery of pharmaceutical products yields a reduction of approximately 49.30% to 21.62%, generating a positive and productive result for the company.
Implementation of JUST IN TIME
Through the application of Just in time, in order to mitigate the problems of delay in dispatch and missing materials, in the pharmaceutical company, through the implementation of complementary tools such as ABC analysis and 5’S (Rewers y otros, 2019), through rotation index formats and records of on-time deliveries such as the formats shown below:
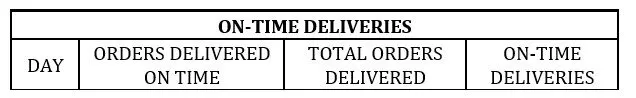
Table 6. On-time delivery format
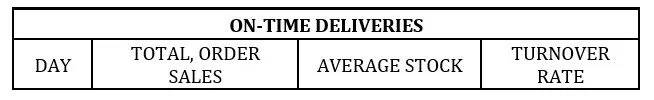
Table 7. Rotation index format
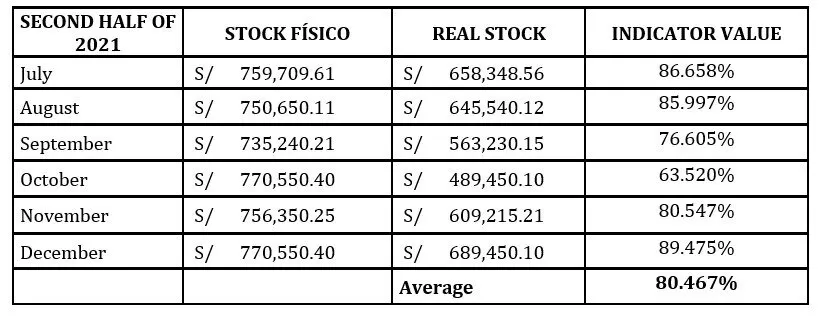
accuracy was recorded before implementation, making use of the formula.
Table 8. Inventory record accuracy in 2021
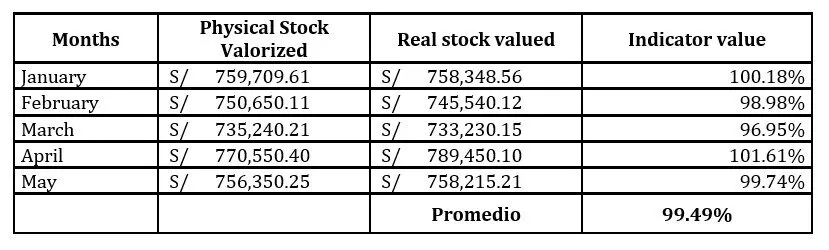
Accuracy recorded after implementation, making use of the formula
Table 9. Inventory record accuracy in 2022
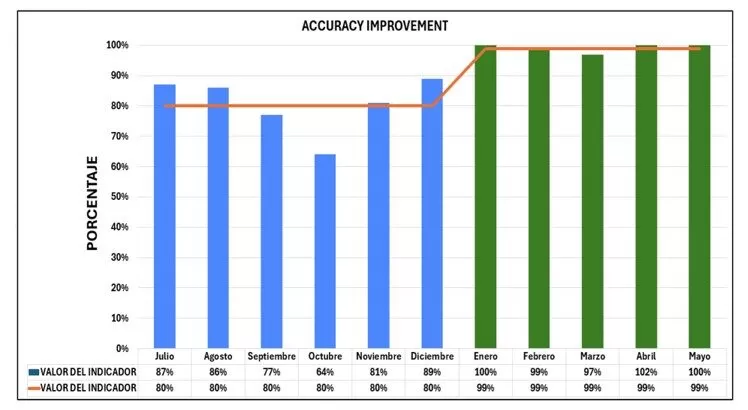
Figure 11. Comparison graph accuracy before and after improvement
Figure 11. You can see the improvement of inventory accuracy increasing by 19.02% Turnover rate recorded before implementation, using the formula:
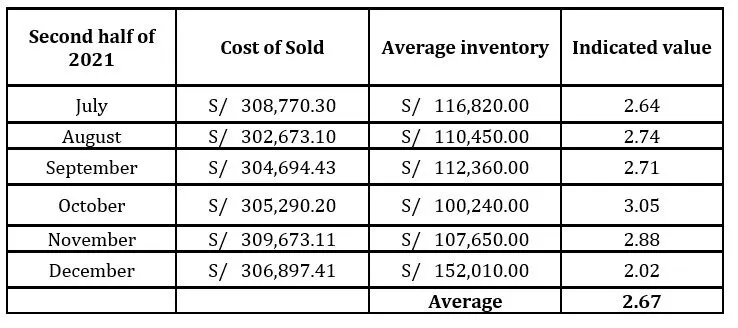
Table 10. Inventory Record Index in 2021
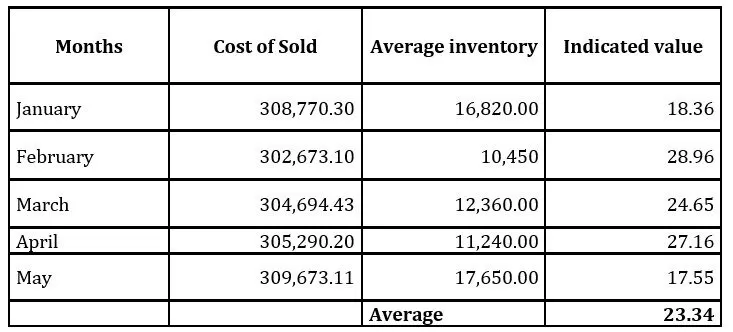
Table 11. Índice de inventario de registro de inventario en el 2022
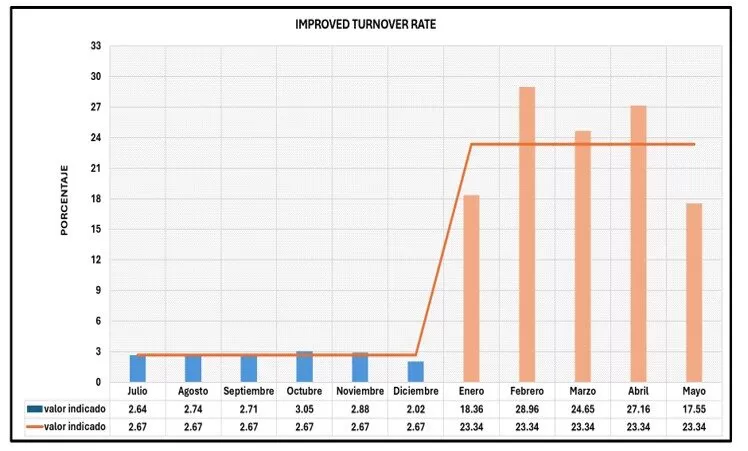
Figure 12. Comparison graph of turnover rate before and after improvement
In Figure 12, the improvement of the average turnover index could be seen, going from 2.67 to 23.34. Below is the cash flow of the project with an NPV of S/. 36,009.15 and an IRR of 74%; with this result it can be concluded that the project is viable. In addition, an IR of 3.56 was obtained, which means that, for each sun that is invested, S / is profitable. 2.56
Table 11. Income statement
CONCLUSIONS AND RECOMMENDATIONS
In the process of the project, the current analysis of the logistics process of the company has been carried out, where it was possible to identify the problem and the causes that generate the high costs and then propose improvements based on the JIT System and the HEIJUNKA, which contributed to the reduction of the main costs of the warehouse.
By implementing the HEIJUNKA methodology, it was possible to reduce waiting times for the delivery of a pharmaceutical product from 90% to 30%. By applying the JIT methodology, the accuracy of the warehouse was increased from 80.467% to 99.49%. Inventory turnover increased dramatically from 2.67 times to 23.34 times, allowing an agile entry and dispatch of materials.
Finally, an analysis of the project was carried out and an NPV of S / was achieved. 36,009.15 and an IRR of 74%; with this result it can be concluded that the project is viable. In addition, an IR of 3.56 was obtained, which means that, for each sun that is invested, S / is profitable. 2.56
It is recommended to make a report of the pharmaceutical inputs with very little rotation since in the implementation of the HEIJUNKA the products were reduced from 90% to 30% in the waiting time for the delivery of the product.
Continue to improve implementation so that all our standard indicators are in world-class values. It was possible to reduce the time with the Just In Time methodology in the warehouse inventory process, obtaining up to 53% improvement in inventories. For this reason, it is recommended to maintain the methodology over time, since some changes could be lost due to the lack of commitment of the staff.
REFERENCIAS
Andujar Palao, N., Cruz Astuquipan, C., Kuniyoshi Aniya, V., Villayzan, M., & Melgar Gamarra, G. (2021). Impacto en el sector farmacias frente a la coyuntura de la pandemia de COVID 19 en Lima metropolitana. Lima: Universidad de Lima. https://hdl.handle.net/20.500.12724/15715
Angeles, M. (2017). Propuesta de una metodología de lean logistics para ser aplicada en los procesos de operaciones logisticos en cadenas de suministro en colombia. Bogota.
Bermúdez Hernández, J., Torres Hernández, J. L., & Pérez Pulgarín, S. M. (2014). Implementation of the Just in Time (JIT) method. CIES Escolme Magazine, 5(2). http://revista.escolme.edu.co/index.php/cies/article/download/59/56
Chavez Vargas, J. (2019). “Diseño de propuesta de mejora para la gestión de inventarios y almacenes mediante un sistema de Lean Logistics para la reducción de costos en la empresa Ferreyros S.A. Cajamarca.
Chavez Vargas, J. (2019). Diseño de propuesta de mejora para la gestion de inventarios y almacenes mediante un sistema de Lean Logistics para la reduccion de costos en la empresa Ferreyros S.A. Cajamarca.
De la Vega, R., Gutierrez , J., & Leal, Y. (2017). Diseño de metodología basada en lean logistics para el mejoramiento de los procesos logísticos en la microempresa Demetra Group S.A.S. Bogota.
Leon Salvatierra, W. (2020). Aplicacion de la metodologia Lean Logistics para la reduccion de devoluciones en la gestion de almacenes de productos terminados en la empresa farmaceutica, Lima, 2010. Lima.
Low Sui , P., & Gao , S. (2011). The Application of the Just-in-Time Philosophy in the Chinese Construction Industry. Journal of Construction in Developing Countries, 16, 91-111. http://scholarbank.nus.edu.sg/handle/10635/45853
Mesa, J., & Carreño, D. (2020). Metodología para aplicar Lean en la gestion de la cadena de suministro. Espacios.
Rewers, P., Bosek, M., & Kulus, W. (2019). Increasing the efficiency of the production process by production levelling. Management and Production Engineering Review, 10(2), 93-100. https://doi.org/10.24425/mper.2019.129572
Torres Caceres, N., & Calsina Miramira, W. (2020). Modelo de gestión de la cadena de suministro y la rentabilidad de los principales laboratorios farmacéuticos del Perú. Produccion y Gestion. https://doi.org/https://doi.org/10.15381/idata.v23i1.16265
Wiśnicki, B., Tygran, D., Mielniczuk, S., Petrov, I., & Davydenko, L. (2024). A Decision Support Model for Lean Supply Chain Management in City Multifloor Manufacturing Clusters. Sustainability (Switzerland), 16(20). https://doi.org/10.3390/su16208801
Zapata-Cortes, J. A., Vélez-Bedoya, Á. R., & Arango-Serna, M. D. (2020). Distribution process improvement in a transport company. Investigación administrativa, 49(126). https://doi.org/10.35426/iav49n126.08