Geraldine Conejo-Barboza1 and Julio F. Mata-Segreda2
1 X-Ray Diffractometry Unit, 2 Biomass Laboratory, School of Chemistry,University of Costa Rica, Costa Rica
Volume 2018,
Article ID 901967,
International Journal of Renewable Energy & Biofuels,
10 pages,
DOI: 10.5171/2018.901967
Received date: 21 November 2017; Accepted date: 13 July 2018; Published date: 30 October 2018
Academic Editor: Emmanuel Keita
Cite this Article as:
Geraldine Conejo-Barboza and Julio F. Mata-Segreda (2018)," Drying kinetics as Tool for the Assessment of Dynamic Porosity of Catalyst-Support Materials" International Journal of Renewable Energy and Biofuels, Vol. 2018 (2018), Article ID 901967, DOI: 10.5171/2018.901967
Critical drying fraction data (xc) were obtained for a series of porous materials, frequently used as supports for heterogeneous catalysts. This kinetic parameter correlates well with the second-order rate constants for water diffusion in the pores (p < 0,01). It is concluded that xc is by itself a sufficient parameter for comparison of mass-transfer resistance between different candidate supports.
Keywords: Catalyst support, diffusion in pores, drying curve, dynamic porosity.
Introduction
Catalysis implies changes in rates of reaction that seek kinetic optimisation to produce some desired product, or the minimisation of side reactions. Kinetic acceleration is the result of changing the molecular environment where the reaction occurs, and transition-state complexes are stabilised relative to cases where catalysts are absent.
Heterogeneous catalysis is of fundamental importance in the transformation of raw materials into useful products such as fuels, either derived from fossil feedstocks or biofuels from renewable sources. Heterogeneous catalysts are constituted by the catalyst itself, a support that offers mechanical and thermal stability and sometimes promoters are also included, that is, substances that improve the kinetic properties of the whole catalytic material.
Besides mechanical and thermal stability, support materials for heterogeneous catalysts must allow convenient mass-transfer dynamics for both entering reactant molecules and exiting product molecules. The geometrical features of pores in supports strongly affect the selectivity of chemical reactions, a phenomenon known as “shape selectivity” (Chen, et al. 2012, Smith & Maesen, 2016).
Thus, supports must have high specific surfaces, high porosity (fraction of total volume that equals empty space), low constrictivity (ratio of mean diameter of flowing molecules to mean diameter of pores), and low tortuosity (average lengths of pores relative to macroscopic geometrical dimension of solid sample). The last three features put together have been termed dynamic porosity in previous papers from this laboratory (Ulate-Segura & Mata-Segreda, 2014, Puente-Urbina, et al. 2016).
Theoretical considerations on porosity and tortuosity have been put forward by Matyka and collaborators (Matyka, et al. 2008). There is no general relationship between porosity and tortuosity, but many trial relations have been proposed (Duda, Koza & Matyka, 2011) of various forms such as exponential, logarithmic, linear or polynomial. Nevertheless, porosity and tortuosity are intuitively interdependent variables. This issue makes the overall dynamic porosity concept a more easily handled quantity, for the relative comparison of the mass-transfer features of catalyst-support materials and other porous materials.
Besides heterogeneous catalysis, dynamic porosity is a convenient parameter for the relative assessment of processes such as combustion, drying, fluid storage in porous materials, retention of dangerous spills, permeability of soils and construction materials, or any case where it is necessary to assess transport processes in different porous media.
This work gives dynamic porosity data for the drying operation of different inorganic porous materials, some commonly used as supports in heterogeneous catalysis.
Statement of the Problem
Isothermal drying curves offer useful information on the dynamics of diffusion of fluids within the confined space of pores in solid materials.
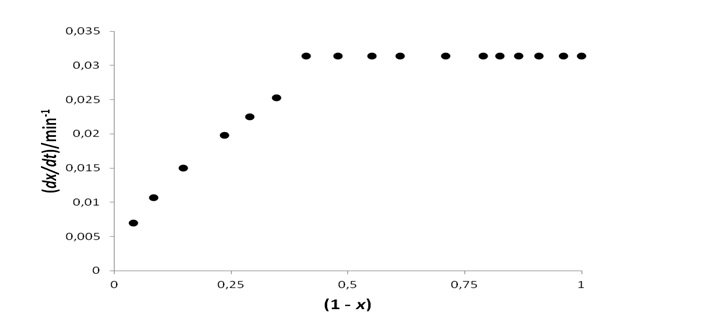
Macro as well as microscopic details during drying processes is obtained from so-called Krischer curves (Kemp,et al., 2001) at specific temperature and barometric pressure. If x is the extent of the drying process that has occurred at time t, the graphical representation of dx/dt vs. (1-x) is called a Krischer curve.
Such plots show an initial constant drying rate, such as shown in figure 1 for the case of Molecular sieve 5A at 50 °C and 87 kPa. A critical point is reached (xc), afterwards dx/dt decreases as the process proceeds. During the constant-rate period, the solid particles surfaces are entirely covered by molecules of the soaking liquid and they behave analogously to surface molecules in pure liquids.
Figure 1: Krischer curve for Molecular sieve 5 A at 50 °C and 87 kPa.
The rate of evaporation of liquids against a stagnant gaseous environment is given by the Hertz-Knudsen equation (Rahimi & Ward, 2005):
where pv is the vapour pressure of the liquid at temperature T, and M is molecular mass. A correction factor κ is included, that gives the fraction of liquid molecules that remain in the surrounding gas phase. Zeroth-order kinetics is obeyed as long as the rate of evaporation counterbalances the rate of arrival of liquid at the surface.
When xc is reached, dx/dt decreases steadily. This experimental fact indicates that kinetics is now determined by factors other than the intrinsic volatility of the soaking liquid (pv), such as internal transport limitations. More complex kinetics is observed at very high drying extents.
Microscopic approaches to the kinetics of drying have been proposed based on capillary transport in porous matrices (Coussot, 2000, Naël-Redolfi, Keita & Roussel, 2018, Shokri & Or, 2011, Hu et al., 2018). Disconnection of particle superficial water and internal water causes cessation of the capillary transport that maintains the constant evaporative flux. This explains the kinetic transition from the constant-rate stage to the decreasing-rate stage (Shokri & Or, 2011). Once this disruption occurs, the water thermodynamic activity inside pores decreases caused by the formation of menisci (Hu, et al., 2018), as predicted by the Kelvin equation. The kinetic outcome is a slower drying rate.
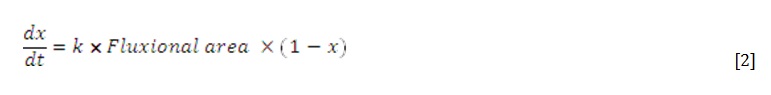
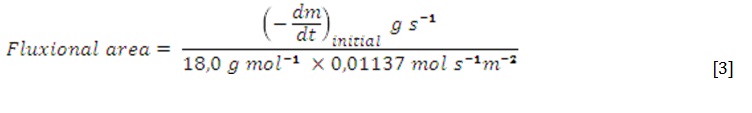
From a mechanistic point of view, at xc there is no longer a continuous liquid coverage of the surfaces. The surface area covered decreases as the drying process occurs, and it is now observed that dx/dt decreases as (1-x) decreases as well:
and the kinetics are the first order in the remaining moisture content and also proportional to the virtual fluxional area through which the liquid evaporates.
Thus, it is easily understood that fluids diffuse more easily in solids with high xc values (high dynamic porosity). xc is then an indirect measure of diffusibility of fluids and can be used to assess their relative mobility in a group of porous materials.
Materials and Methods
Materials
α-Alumina and g-alumina were prepared in the laboratory of Prof. Grettel Valle-Bourrouet (School of Chemistry, University of Costa Rica), Chromosorb WÒ 60/80 (diatomite, Varian), raw diatomite (Industrias Mineras, Barranca, Costa Rica), Florisil 50-100 (magnesium silicate, Mallinckrodt), silica gel 3mm (food-grade desiccant), silica gel 1 mm (Strip PaxÒ), silica gel 0,4 mm (Varian), zeolite Molecular sieve type 4A (Caledon Laboratories, Canada), and zeolite Molecular sieve Types 3A and 5A (Sigma-Aldrich).
Drying Curves
All measurements were done at 50 °C and 87 kPa barometric pressure. The laboratory environment was kept at 60% – 65% relative humidity.
The solid materials were soaked with tap water for periods of 14 h – 16 h. The samples were gently pressed in paper towels prior to kinetic measurements, to obtain free-flowing solids.
10-gramme samples were placed on aluminium foil sample pans of 74 cm2 surface area. The raw mass–time kinetic data were obtained by monitoring mass loss by using Ohaus MB35 Halogen Moisture Analysers.
Data Treatment
The extent of drying was obtained from the mass balance x = [m(0) – m(t)]/[m(0) – m(¥)]. The “surface” drying regime (-dm/dt = constant) was determined from the mass-time data pairs for which a linear correlation is valid with Pearson’s rp ³ 0,9990.
The apparent rate constant for the second drying stage (kap = k × Fluxional area) was obtained as the slope of dx/dt vs. (1–x) that obeys a linear relationship (pseudo first-order kinetics). The dx/dt values were calculated from cubic polynomials x = f(t). Fluxional areas were calculated by using the previously determined evaporation rate of pure water at 50 °C and 87 kPa of 11,37 mmol s-1 m-2, as follows:
All determinations were done by triplicate.
XRD
XRD patterns were obtained for ground samples, by using a single-crystal X ray diffraction (SC-XRD) D8 Venture from Bruker with a radiation source of Cu Kα1-Kα2. The conditions of measurement were 2 theta: -40 º, Omega: 160 º, Phi: 0.00º and Chi: 54,76 º. The generator settings were 50kV and 1,00 mA with a sample temperature of 294,84 K and an exposure time of 14,40 s. For the identification of the minerals the Debye rings of each sample were integrated from 2q minimum of 5º to 2q maximum of 77,95 º, gamma from 56,88º to 120º, with a step size of 0,050º. XRD diffractograms were compared to PDF-2 database 2007 of the International Centre for Diffraction Data (ICDD).
Results and Discussion
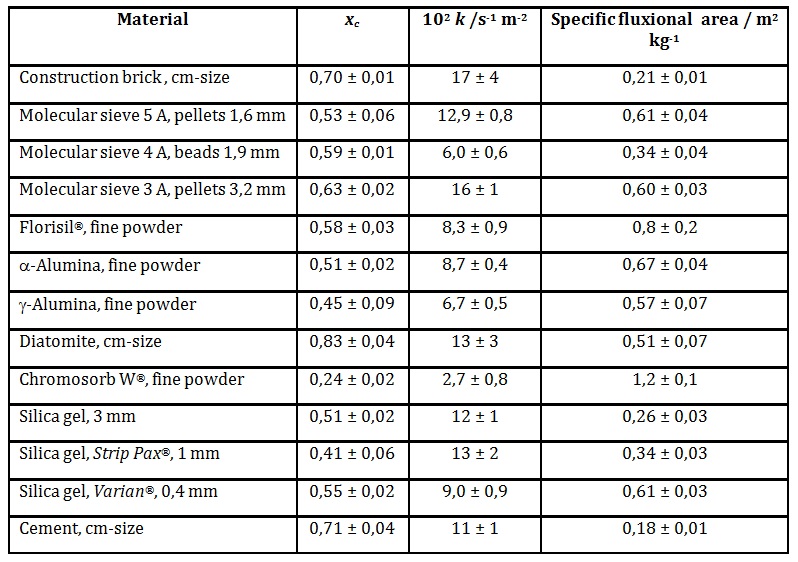
The kinetic data are shown in table 1. No correlation between dynamic porosity and chemical nature is sought in this work, but only the relation between the kinetic parameters xc and k for the different porous materials.
xc values span the range from 0,2 to 0,8. Materials with large pores evident to the naked eye show the largest xc (cm-sized chunks of construction brick, diatomite and cement, average xc = 0,75 ± 0,07). The finer materials have lower xc (0,2 – 0,6). The difference in average xc values is significant at the 99% certainty level (Student t = 3,99, p < 0,01).
The lower specific fluxional areas of chunk samples of cement and construction brick is easily understood in terms of their low macroscopic surface to volume ratios, relative to the finer materials.
Table 1: Kinetic drying parameters at 50 °C for inorganic materials
Second-order k values are related to the diffusivity of fluids in the restricted space of pores. The physical interpretation of k is analogous to the corresponding xc values. Such correlation is established by the empirical relationship:
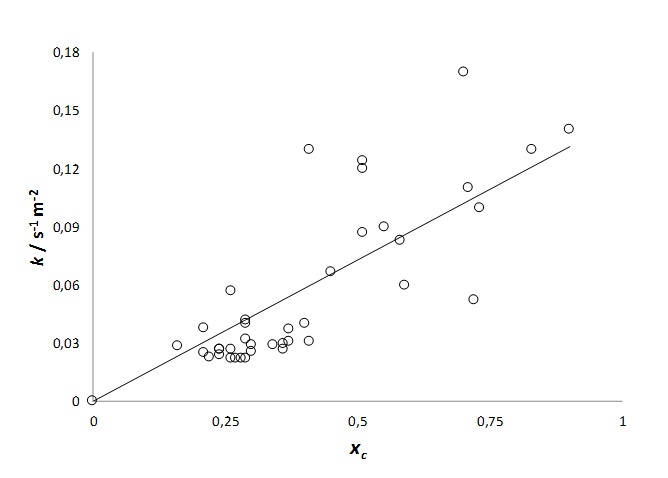
This empirical finding is also valid for other materials that include a group of 28 lignocellulosic biomasses studied in earlier work of this laboratory. The least-squares linear fit between k and xc is now:
Figure 2: Correlation between k and xc.
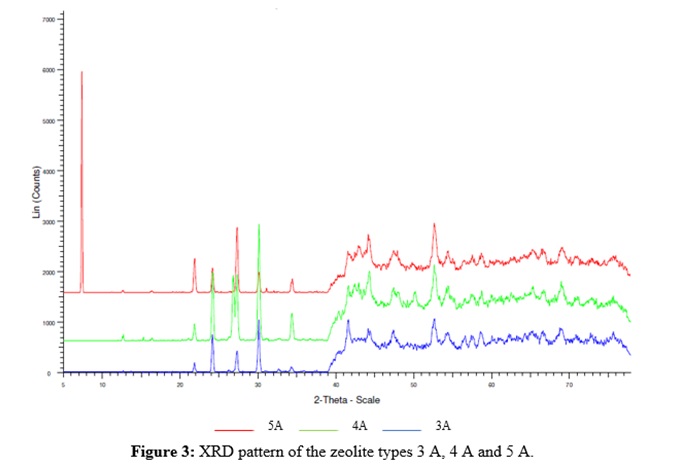
For the zeolite type A materials, pore-size range goes from 0,3 nm to 0,5 nm and shows no hydrodynamically significant differences of xc (average value 0,58 ± 0,05). The two Sigma-Aldrich products (types 3 A and 5 A) show similar k values, but the zeolite type 4 A from Caledon Laboratories has a lower value (0,060 ± 0,006 vs. 0,14 ± 0,02). The supplier declares this 4 A material to be a mixture of more than 70% aluminosilicate, 5% SiO2 and a mineral binder. XRD patterns indeed show the presence of SiO2 in 4 A (conspicuous signal for quartz at 2q = 26,7 °), as shown in figure 3. It is plausible to think of the presence of SiO2 causing an obstructive effect on the dynamic porosity for the diffusivity of water in the pores of zeolite type 4 A, relative to 3 A and 5 A analogues.
At present, we have no data from experiments such as BET isotherms that give information on the specific areas of neither these materials nor their pore-size distribution. Nevertheless, a comment is due on the similarity of k values for Molecular sieve type 5A (0,5 nm pore size), Molecular sieve type 3A (0,3 nm pore size), and diatomite (1 mm – 5 mm pore size).
Mata-Segreda (2014) studied the drying kinetics of filter paper samples of different pore sizes at 22 °C and 87 kPa. The author found an empirical regression equation that relates xc with pore size:
The equation is valid for pore sizes up to 11 mm. It was observed that xc tends asymptotically to the expected theoretical value of 1, for larger pore sizes.
Use of equation [6] gives the three following results: a) Molecular sieve type 5A xc(calc) = 0,62 vs. xc(obs) = 0,53 ± 0,01; b) Molecular sieve type 3A xc(calc) = 0,61 vs. xc(obs) = 0,63 ± 0,02; c) diatomite xc(calc) = 0,87 vs. xc(obs) = 0,83 ± 0,04. This result gives additional support to the xc – k correlation found in this work.
The data for the three samples of silica gel indicate that macroscopic features such as bead size in the range from 0,4 mm to 3 mm have no significant influence on either xc or k. The differences in specific fluxional areas are simply due to the macroscopic surface to volume ratio (Student t = 5,4, p < 0,05).
Mass-transfer limitations are used in laboratory and industrial heterogeneous catalysis, as variables to improve chemical selectivity. Transport through pores may become kinetically determining for the cases of very good catalysts. The pores in support materials are far from straight but follow tortuous interconnecting paths of varying cross-sectional areas. Mass transport is determined by the effective diffusivity of chemical species in the pores (De). An equation that relates De to bulk diffusivity (Db) is De = (ep s/t) Db, where ep is volumetric porosity, s the constrictivity of the pores and t stands for their tortuosity (Fogler, 2016). Typical values are ep ~ 0,4, s ~ 0,8 and t ~ 3,0. Thus, De /Db ~ 10-1.
This result can be analysed by equating De/Db ~ kap/(dx/dt)initial for every experiment, where (dx/dt)initial = (-dm/dt)initial/Dmc. This assumption makes De/Db a ratio of diffusivities of the fluid in the pores relative to surface.
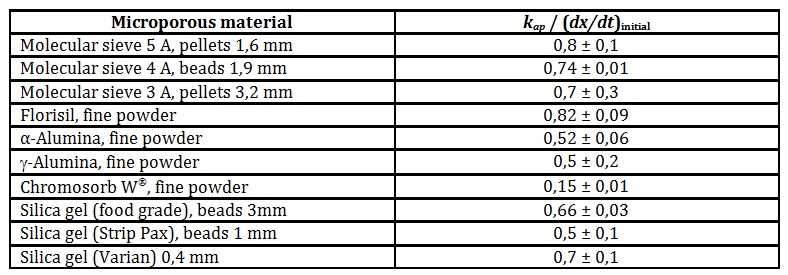
Materials with macropores are expected to show De/Db ~ 1. For construction brick samples, De/Db = 1,3 ± 0,2 and for cement chunks, De/Db = 1,3 ± 0,4. Table 2 shows the experimental values for the microporous materials.
Table 2: Mass-transfer limitation of the internal diffusion dynamics of water
Various studies have been undertaken for understanding the molecular basis of the reduced diffusivity of molecules in the restricted spaces of pores, relative to bulk (see for example Ye, et al., 2011, Khalili, et al. 2014, Fukatsu, et al., 2017). Theoretical and experimental studies indicate that for the case of H2O in silica pores, the fluid molecules are frozen, that is, nanoconfinement exerts restriction of molecular motions both translational and rotational. This effect is also evident from the above data.
A shape-selective heterogeneous catalyst (Masel, 2001, Smit & Maesen, 2006, Chen, et al., 2012) selects product molecules according to their cavity geometry and pore dimensions and how easily they diffuse. So, the desired product can travel out of the solid matrix and if side products are formed, they could be converted into the desired product. Thus, it is of practical importance to assess dynamic porosities amongst a group of possible support candidates.
Both k and xc can be used to assess diffusional barriers of support materials, allowing their comparison amongst a group of possibilities. Since xc is easier to measure, one concludes that it is by itself a sufficient parameter for comparison of mass-transfer resistance between different candidate supports.
Acknowledgement
The authors wish to thank Prof. Grettel Valle-Bourrouet for her comments on the diffractometric data of the zeolite materials used, and having provided the samples of α-alumina and g-alumina.
Chen, Z., Cui, Z.-M., Li, P., Cao, C.-Y, Hong, Y.-L., Wu, Z.-Y., Song, W.-G. (2012). Diffusion induced reactant-shape selectivity inside mesoporous pores of Pg@meso-SiO2 nanoreactor in Suzuki coupling reactions, Journal of Physical Chemistry C 116, 14986-14991.
Coussot, P. (2000). Scaling approach of the convective drying of a porous medium, European Physics Journal B 15, 557-566.
Duda, A., Koza, Z., Matyka, M. (2011). Hydraulic tortuosity in arbitrary porous media flow, Physical Review E 84, 036319.
Fogler, H. S. (2016). Elements of chemical reaction engineering, 5th edition, Prentice-Hall, Boston, chapter 15.
Fukatsu, Y., Morikawa, K., Ikeda, Y., Tsukahara, T. (2017). Temperature and size effects on structural and dynamical properties of water confined in 1 – 10 nm-scale pores using proton NMR spectroscopy, Analytical Sciences 33, 903-909.
Hu, Z., Wyrzykowski, M., Scrivener, K., Lura, P. (2018). A novel method to predict internal relative humidity in cementitious materials by 1H NMR, Cement and Concrete Research 104, 80-93.
Kemp, I. C., Fyhr, B. C., Laurent, S., Roques, M. A., Groenewold, C. E., Tsotsas, E., Sereno, A. A., Bonazzi, C. B., Bimbenet, J.-J., & Kind, M. (2001). Methods for processing experimental drying kinetics data, Drying Technology 19, 15-34.
Khalili, A., Morad, M. R., Matyka, M., Liu, B., Malekmohammadi, R., Weise, J., Kuyper’s, M. M. M. (2014). Porosity variation below a fluid-porous interface, Chemical Engineering Science 107, 311-316.
Masel, R. I. (2001). Chemical kinetics and catalysis, Wiley-Interscience, New York, chapter 12.
Mata-Segreda, J. F. (2014). Drying kinetics as a new tool for the estimation of pore size of materials, UNED Research Journal 6, 149-152.
Matyka, M, Khalili, A., Koza, Z. (2008). Tortuosity-porosity relation in porous media flow, Physical ReviewE 78, 026306.
Naël-Redolfi, J., Keita, E., Roussel, N. (2018). Water absorption measurement of fine porous aggregates using an evaporative method: Experimental results and physical análisis, Cement and Concrete Research 104, 61-67.
Puente-Urbina, A., Morales-Aymerich, J. P., Kim, Y. S., Mata-Segreda, J. F. (2016). Drying kinetics and assessment of relative energy cost for drying of woody biomasses, International Journal of Renewable Energy and Biofuels, DOI:5171/2016.701233.
Rahimi, P. & Ward, C. A. (2005). Kinetics of evaporation: Statistical rate theory approach, International Journal of Thermodynamics 8, 1-14.
Shokri, N., Or, D. (2011). What determines drying rates at the onset of diffusion controlled stage-2 evaporation from porous media?, Water Resources Research 47, 1-8, Sept. 2011.
Smith, B. & Maesen, Tl L. M. (2006). Towards a molecular understanding of shape selectivity, Nature 451, 671-678.
Ulate-Segura, D. G. & Mata-Segreda, J. F. (2014). Drying kinetics as a method for the evaluation of relative diffusivity of water in porous biomass materials, International Journal of Renewable Energy and Biofuels, DOI:5171/2014.970016.
Ye, H., Zhang, H., Zhang, Z., Zheng, Y. (2011). Size and temperature effects on the viscosity of water inside carbon nanotubes, Nanoscale Research Letters 6, 87.