1Faculty of Energetics, University POLITEHNICA of Bucharest, Bucharest, Romania
2Center for Research and Training in Innovative Techniques of Applied Mathematics in Engineering “Traian Lalescu”, Department of Applied Mathematics, Faculty of Applied Sciences, University POLITEHNICA of Bucharest
Volume 2021,
Article ID 853739,
International Journal of Renewable Energy & Biofuels,
8 pages,
DOI: 10.5171/2021.853739
Received date: 24 September 2020; Accepted date: 23 February 2021; Published date: 6 August 2021
Academic Editor: Daniel Homocianu
Cite this Article as:
Valeria-Alina ANDRONESCU and Elena-Corina CIPU (2021)," Applied Mathematics on Wind Turbines’ Behavior and Rightsizing Spatial Distribution" International Journal of Renewable Energy and Biofuels, Vol. 2021 (2021), Article ID 853739, DOI: 10.5171/2021.853739
Taking into account the recent interest in producing green energy through wind turbines, this paper aims to reconsider other options regarding different distributions in order to increase the production efficiency. Also, this paper analyses the hypothesis of Romania using only wind turbines to provide the energy needed to sustain the system, which at first may seem a bold idea, but pollution has become such a heated debate issue nowadays that it cannot be ignored anymore. On the other hand, there is a comparison between the standards set for 2011 and the goals achieved until 2020 in Romania in terms of generating green energy.
Keywords: Wind, Turbine, Applied Mathematics, Distribution
Introduction
It is well known that pollution has become a heated issue nowadays and its effects on nature determined people to look for other ways of producing energy, thus wind energy has stepped out. But the problem is how to increase the performance of the wind turbines. This is the aim of our study, to optimize the distribution of the wind power plants that may replace fossil fuel energy in Romania.
What is a Wind Turbine?
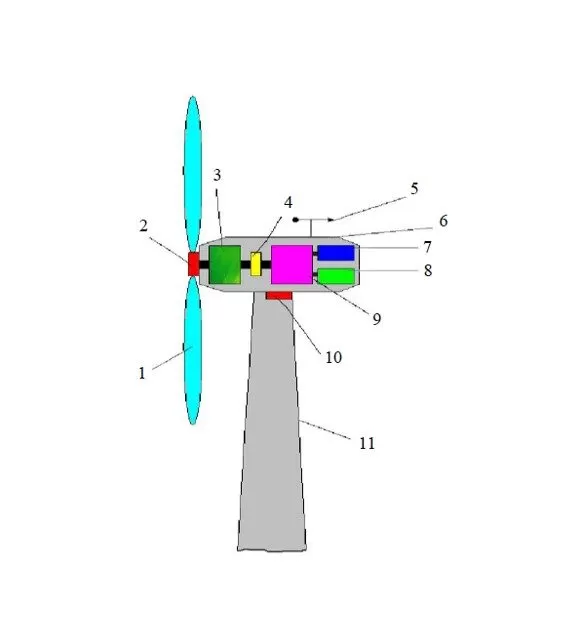
To begin with, everyone needs to know how a wind turbine looks like and its principle of functioning. A wind turbine is an ensemble used for over 3000 years with a precise configuration (presented in Fig. 1) that includes the blades (1) meant to capture gusts of wind and to set in motion the rotor (2). This last one gives an impulse to a low-speed shaft (3), then to a gearbox connected to a generator (7). The generator, based on electromagnetic induction, produces wind energy which is then forwarded to an electrical station.
Fig. 1. Components of a wind turbine
When the weather is unfavorable to producing wind energy, the power plant has an anemometer (9) attached to measure the direction and speed of the wind. If the wind exceeds a certain value, it activates a brake to stop the blades’ rotation and any damage to be done.
What needs to be pointed out is the fact that there are various types of wind turbines, but each of them has used the same principle and the best known is the one with one rotor and three blades, presented above.
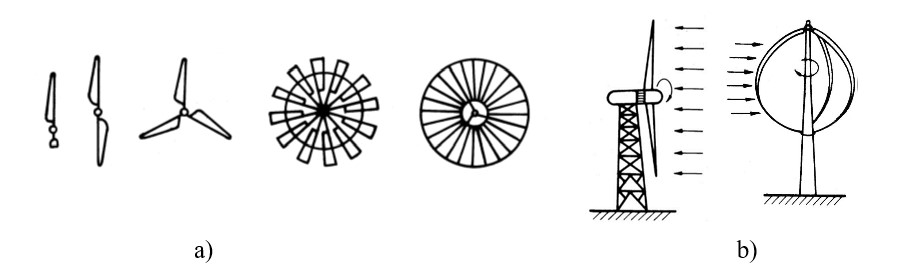
There are also turbines with a smaller number of blades, mounted either upstream or downstream, with a shaft either horizontally or vertically (Figure 2. b), with multiple or single bladed rotors (Figure 2. a). They can also be mounted either on-shore or off-shore. Some examples are shown in the images below.
Fig. 2: Turbines with a smaller number of blades
A wind system is designed to give efficiency to certain parameters set by the manufacturer. Normally, a turbine with a rotor and three blades has:
A power of 2,5 MW;
Wind speed: between 3 and 25 m/s (over 25 m/s the turbine stops automatically so as not to endanger the devices inside);
Tower Height: 90 – 140 m;
Propeller speed: 6 – 15 rot/min;
Propeller diameter: 100 – 110 m;
Weight: 20 – 200 tons.
We present some formulas used to optimize energy production below:
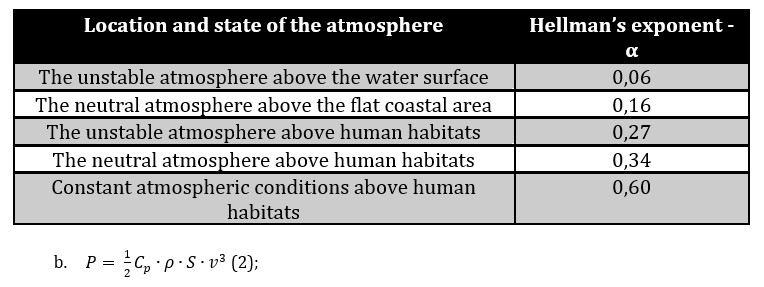
Equation (1) represents the relation of the wind speed v as a function of the height h, where v0 and h0 are the speed, respectively the ground height, and α is the exponent of Hellman, specific to the area, the time of the day, the season, etc.
Table 1: Examples of values for Hellman’s exponent
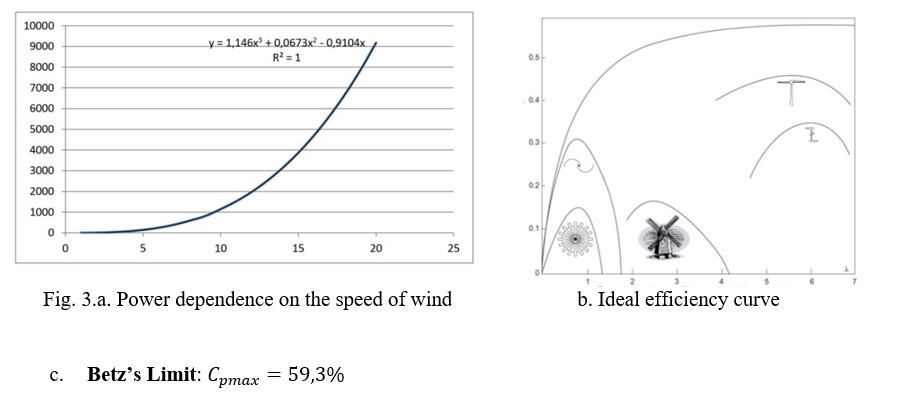
Equation (2) reveals the power of the turbine where is the power (performance) coefficient of the turbine, ρ is the air density (approx. 1,25 kg/m3 under normal conditions of temperature and pressure), S represents the area covered by the turbine blades and v – the wind power. We should point out that for a wind speed of 10 m/s, the power developed by the turbine is 8 times higher than for a speed of 5 m/s.
The graphic below was made using a Mat Lab program and reveals the dependence of the wind speed on the height of the propeller.
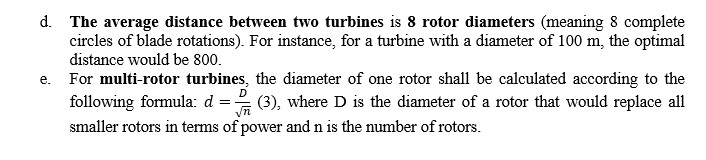
This limit shows that, in the absence of any friction with air and the friction of the internal components between them, the maximum efficiency of a turbine does not exceed the threshold of 59,3%. However, modern ones reach up to 40-45% efficiency. The picture on the right side illustrates the variation of the coefficient of performance with the ratio between the peripheral speed of the blades and wind speed for different turbines.
Rightsizing wind turbine’s distribution
In the following lines, we will calculate to find out the number of wind turbines Romania needs to completely replace the energy produced with fossil fuels. Foremost, fossil fuels cover about 15 327,9 million kWh in the first 8 months of 2019 and the production in wind farms was about 4406,9 million kWh (218,6 million kWh more than the same period of 2018), according to Transelectrica.
Based on these data, the wind farm that is needed should generate about another 16 billion kWh, besides what it already produces. So, 2.2 billion kWh will be required to replace energy from fossil fuels. Given this number, we will be capable of estimating the number of wind turbines, but also their configuration.
Now that the number of turbines is known, the next issue would be adequate space to build. Taking into account the last point’s information, namely that there must be 8 times the rotor diameter between two turbines, then it is 800 m. To distribute the 2300 turbines, it will be used the knowledge related to fractals, respectively Peano’s curve, which should ensure the optimal distance and efficiency in field distribution.
Peano’s curve is an example of a fractal, defined by Benedoit Mandelbrot, as an object whose Hausdorff and topological dimensions are different. A fractal is a fragmented geometric figure that can be divided into parts, so each of them is a copy of the original. The fractal, as a geometric object has the following characteristics:
it is self-similar at least approximately or stochastic;
it has a simple and recursive definition;
it has infinite detail and complexity: any level of magnifications seems identical and has a fine structure at infinitely small scales;
it has a fractal dimension or a self-similarity dimension.
In the book by Salvado (2011), the author notes that Peano’s curve is a fractal which, on one hand, is a curve – a continuous geometric shape on the interval [0, 1], and on the other hand, it passes through all the points in the 2-dimensional space [0, 1] x [0, 1]. Owing to these properties, it is also called the space-filling curve.
We say that a space-filling curve is a curve whose range contains the entire 2-dimensional unit square. These curves are special cases of fractal constructions, in which the fractal dimension is 2. Space-filling curves in the 2-dimensional plane are called Peano curves, as Giuseppe Peano was the first to discover one. Peano discovered a dense curve that passes through every point of the unit square interval onto the unit square.
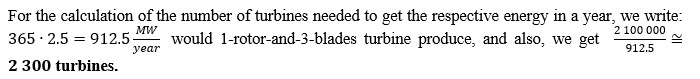
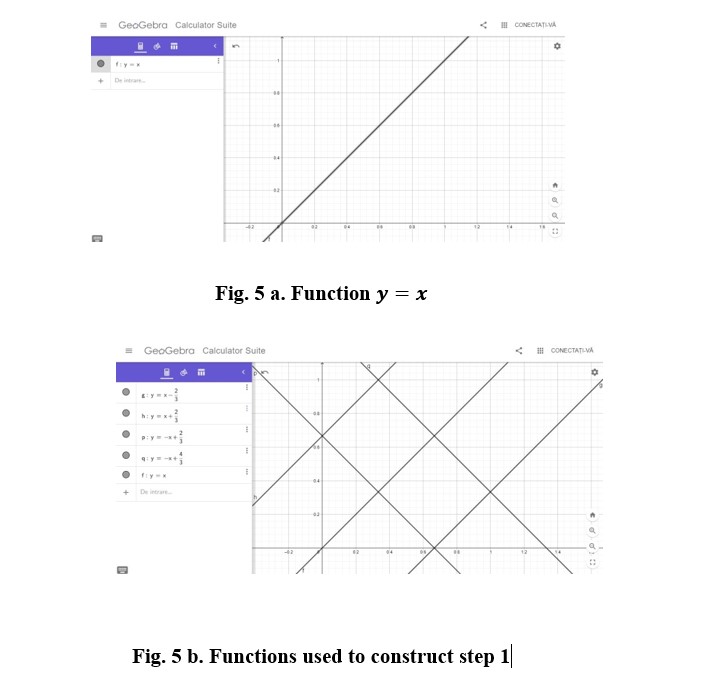
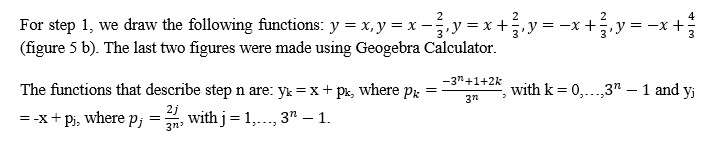
To construct an example of a Peano curve, we start with a square of vertices (0, 0), (0, 1), (1, 0), and (1, 1). Step 0 is the function (Figure 5 a)
Fig. 6: Placement of all wind turbines
Each red dot represents a wind turbine, the distance at which they were drawn is 800 mm, which is equivalent to 800m in the field. As seen from the picture, the advantage of this settlement is the ease with which wind turbines can be built, saving land. Even if they were placed on-shore or off-shore, they would not disturb either agricultural work or marine animals’ lives or even prevent off-season fishing, as cameras are monitoring the area.
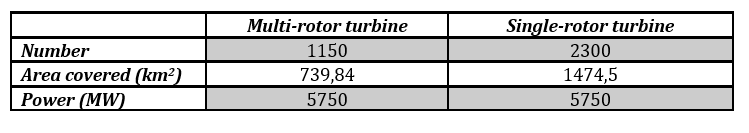
The total area covered is 1474,5 km2 and the total amount of electrical power is 5750 MW.
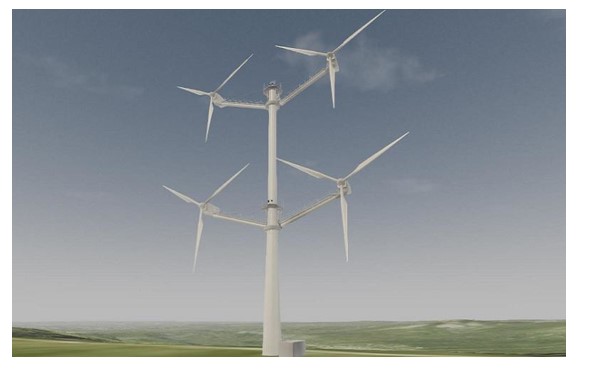
From another point of view, we will now consider another type of turbine, namely turbines with several rotors. As an example, we will process the design of a 4-rotor turbine, still in prototype condition, but which has ended its testing period (fig. 8).
Fig. 8: Four-rotor wind turbine
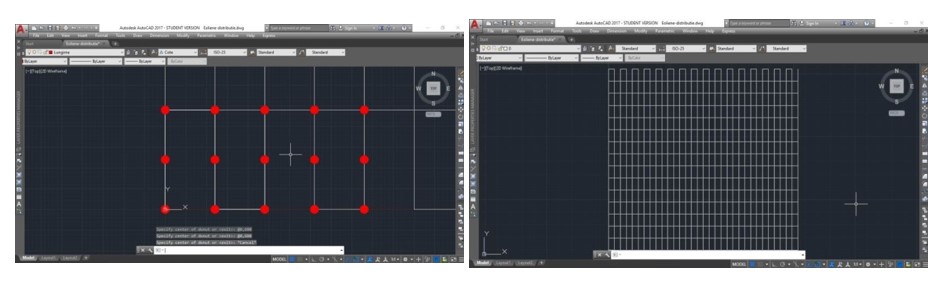
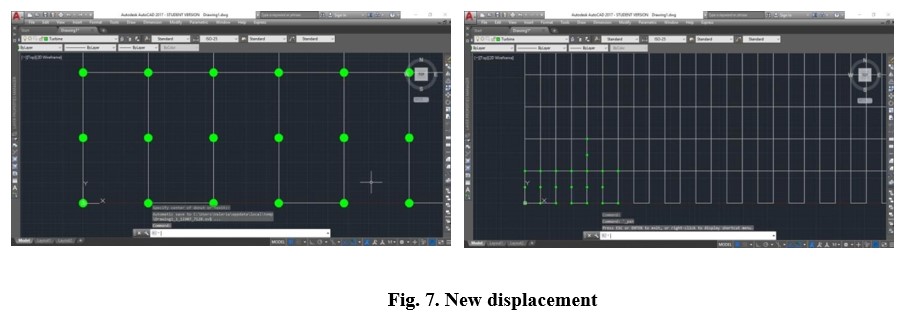
We will then calculate its power relative to our common turbine (power of 2,5 MW and rotor’s diameter of 100m). Using eq. (3), we have that the diameter of a small rotor is 50m, and the power developed by such a turbine is about 5 MW. This means that the number previously calculated will be halved, so it will require there only 1150 multi-rotor turbines that can electrically support the demand. Peano’s curve model shall settle these. This time, we will use the same distance between 2 turbines, 800 m. The total area is 739,84 km2 and the total power: 5750 MW. The photos below were created using AutoCAD 2017 and the green dots are the multi-rotor wind power plants.
Table 2: Comparison of the 2 types of placement
European standards
According to the European Commission, 2011 brought hope in the wind energy field by proposing that 34% of total electricity consumption be provided renewable energy sources, of which 12% represent wind energy, all at the European level. In other words, the target was to triple the percentage in recent years, i.e., about 4,8%. In 2011, the European Commission estimated that wind energy will exceed the 161 GW thresholds by 2020.
It should also be noted that the prices of the construction of a wind power plant have decreased considerably since the first appearances of this invention, reaching about 1,23 million/MW on land and 2-2,2 million/MW offshore. The most common types of turbines are those with a horizontal shaft, mounted upstream and with 3 blades on the rotor which start the movement of the blades at speeds above 3 m/s and to stop automatically when reaching a speed of 25 m/s, to not endanger the electrical installation of the materials.
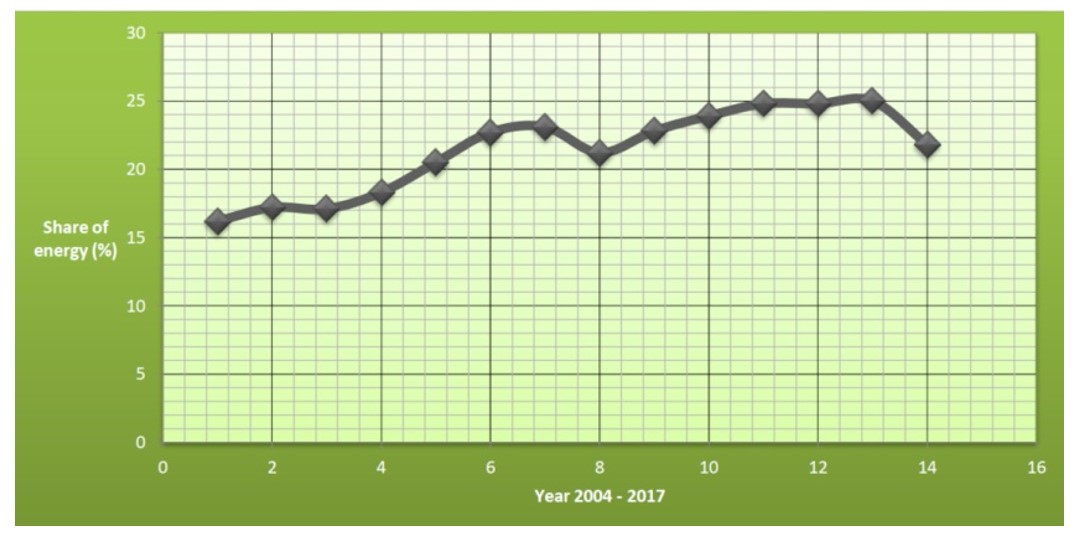
As for development in the member states, it is different because of the particular levels of economy and investment in this area. Denmark (for instance) is currently the market leader, with the largest offshore wind farm having a capacity of 1200 MW and 174 turbines. Romania is not bad in this regard either, having a great development opportunity, especially in the Dobrogea area (already exploited in this sense) and the Bărăgan area. The figure below unveils the share of energy from renewable sources in the gross final consumption of energy, from 2004 to 2017, and the information was taken from the official Eurostat website.
Fig. 9. Share of energy from renewable sources between 2004 and 2017
Although hardly any investment was made in the area (no other wind turbine was built in 2018), this did not affect production, and it even multiplied it. For the future, Romania aims to reach a percentage of 27,9% of total electricity from renewable sources by 2030, which some specialists have described as “little”, given the percentage that has already been reached (23,9%).
Conclusions
Romania has a very high wind energy potential, which brings many advantages to both the community and the natural environment. Wind energy means reducing gas emissions, helping to reduce dependence on energy savings, and high costs to obtain raw materials, however harmful to humans.
Even if it might seem easier to build a single rotor turbine, that it covers a greater area might become a drawback at some point, thus a wind farm made of 1150 multi-rotor wind power plants with a power of 5 MW each could sustain the demand of electricity in Romania, practically to erase the need of fossil fuels.
Given that our country is so close to reaching its 2020 target in terms of renewable energy production, it can be concluded that the project of 1150 multi-rotor wind power plants meant to save us from pollution is not just a dream, but it can be made true with perseverance and well-trained people.
Acknowledgments
This article is financed by the University POLITEHNICA of Bucharest, through the project “Engineer in Europe” in an online system, registered at MEC under no. 457/GP/06.08.2020, by using the fund for financing special situations that cannot be integrated into the form of financing state higher education institutions.