Department of Finance, Bucharest University of Economic Studies, Bucharest, Romania
Volume 2018,
Article ID 675223,
Journal of Accounting and Auditing: Research & Practice,
20 pages,
DOI: 10.5171/2018.675223
Received date: 2 October 2017; Accepted date: 21 November 2017; Published date: 3 October 2018
Academic Editor: Aura Emanuela Domil
Cite this Article as:
Radu Alin Păunescu and Georgeta Vintilă (2018), “Study of the Influence Factors of Effective Corporate Tax Rate from the Baltic Countries ", Journal of Accounting and Auditing: Research & Practice, Vol. 2018 (2018), Article ID 675223, DOI: 10.5171/2018.675223
This empirical research takes into consideration a topic that is not much studied in the academic literature: the drivers of effective corporate tax rate (ECTR) in the Baltic financial markets. Using a sample of 40 companies listed on stock exchanges from Estonia, Latvia and Lithuania, we empirically tested the influence of profitability (ROA, ROE and ROIC), indebtedness and assets composition and other variables on ECTR. Results were in line with other well-known studies from the literature and seem to support the political cost theory. Additionally, we deployed other variables such as audit fees, R&D expenses, statutory rate and advertising expenses. Each result was explained in the context of corporate finance.
The beauty of nature is driven by the evolution. But evolution itself is a continuous struggle for acquiring skills and dominant position. Similar idea can be applied to countries and financial markets. More often, the social gap between developed markets and the emerging ones is becoming almost conspicuous. There is a real endeavor for the emerging markets to obtain the status of ‘developed market’. There are many ways to study the emerging markets, and the social aspect is on interest not only for the financial analysts, but also for the broad public. Numerous factors differentiate the emerging markets from the developed ones, but in the present paper, as novelty, we focused on taxation from the Baltic stock exchanges in the context of corporate finance. The final goal for the European Union is strength by union and harmonized policies at all levels for member states, including taxation. But there are still gaps and disparities between West and East within the European Union. Estonia, Latvia and Lithuania were admitted as members in the EU in 2004 and all three countries are, in a way, interdependent at all levels. With a similar history, all three former communist countries represent an example of fiscal policies nowadays, but there are few academic papers about the effective corporate tax rate within these countries. Despite the fact that statutory tax rates represent taxation within the financial markets, the effective corporate tax rates (abbrev. ECTR) based on financial statements give a proper insight on tax burden of a company. Taxation is a sensitive issue in attracting the investors and can influence a financial market and the ‘developed/emerging’ status. Baltic financial markets are considered emerging countries and in the present paper we set our goal to study their effective corporate tax rates from the perspective of corporate finance. The influence of the financial statements on the ECTR can be considered a starting point for new fiscal policies applied to reduce the gap from the Baltic countries and Western EU member states.
Our sample consists of Estonia, Latvia and Lithuania over the period 2000-2016, which is significant in the context of the transition process to the free market economy. Being based on financial statements, the variables used includes drivers of the ECTR such as indebtedness, asset composition and profitability. As a novelty for a paper about the Baltic taxation, we included variables for the audit fees and advertising expenses because these variables can capture the political power theory and also the impact of corporate governance on taxation. Corporate governance can be the link between fiscal policies within the European Union. We consider that the size of the company is significant in the context of reduction of tax burden and Dyreng et al. (2017) proved that ECTRs have decreased over time (maybe as effect of transition process). The contribution of the article is in emphasizing the ECTR’s influence factors as part of the new policies aimed at strengthening the EU markets. First, we contribute to the literature by adding a newer perspective on the ECTR from the Baltic region. Second, we illustrate the taxation of newer EU members and the integration of the emerging stock exchanges. We found that the effective corporate tax rate from the Baltic region is influenced by the classic drivers from the literature (indebtedness, asset composition, size) in line with the principles of accounting and tax deductions. The level of influence (R2) recorded though a reduced value which means that there could be other drivers of the ECTR in the Baltic countries. This can be attributed to the relative small number of companies included in the sample (only listed companies). Overall, proxies used indicate the presence of the political cost theory and a diminished role of tax avoidance. Managers of the Baltic companies are more focused on the financial management than on the fiscal management. We consider that the political cost theory is due to the fact that each one of the three countries has a small population and it is more a ‘solidarity cost’ for the large companies.
The remainder of the article proceeds as follows. Section 2 provides a literature review. Section 3 reveals the sample and variables, along with the econometric methodology. Section 4 presents the empirical results. Section 5 is the conclusion.
Prior Literature and Hypotheses Development
Baltic region with its three countries, Estonia, Latvia and Lithuania, have an important role in the study of drivers of the effective corporate tax rate. All of them are similar, former communist states, but on the same time each one has its own characteristics (‘idiosyncratic’). Alena et al. (2017) used cluster analysis for the ECTR and observed that in each case the Baltic countries are grouped in the same clusters together with Bulgaria, Romania, Poland and Czech Republic. This cluster of the new acceding EU member states has the lowest level of ECTR among the European countries and is tax competitive.
The differences between the Baltic States are important for the economist and for the financial analysts. Also, the influence factors of the ECTR based on the financial statements can be used as a benchmark for future fiscal policies necessary for the fiscal harmonization at the level of the European Union. The development gap between the EU member states is a matter of interest for the economists and it can be reduced through the channel of taxation. There are few papers on the academic literature about the Baltic countries and their effective tax rates.
Baltic stock markets are integrated on a single trading platform. Deltuvaitė (2016) used empirical analysis to study the Baltic stock markets and observed that these markets are related, but the Latvian market is more isolated. Brännäs and Soultanaeva (2011) empirically observed that Estonia and Lithuania are more affected by changes from the US and Western Europe and Latvia is influence by Russia. But for a better perspective of investors, the three Baltic States decided to become one Baltic financial market and our main focus is on the Baltic stock market, and additionally on each stock exchange. Also, all three countries adopted fiscal policies designed to help the financial markets to get the emerging status and to become attractive for investors. Tax incentives have a significant impact on the effective tax burden and to attract investors. For example, according to Eurostat[1] in Lithuania, the R&D expenses are deductible even “[…]in a triple amount in the tax period when they are incurred” and the profit reported for tax purposes can be reduced with half of the value of expenses in “[…] incurred in the acquisition of investment asset”. Thus, taxation is an important part in the process of becoming a developed market. Statutory rates are the first info points about corporate taxation, but for the corporate finance perspective, the effective corporate tax rate has the accurate image about tax burden from a financial market. The gap between statutory rates and ECTR is another important aspect because it shows how much tax deductions can be used with respect to the legal regulations. Dyreng et al. (2017) observed with empirical models that for the European countries, ECTRs and statutory rates decreased and the Baltic region are not an exception. Finkenzeller and Spengel (2004) studied the Baltic countries, among other new EU members from 2004, and they observed that these states compensate the tax incentives with tax rate reductions designed to give advantage against the Western European countries. Following the study of Hanlon and Heitzman (2010), we place our study about effective corporate tax rate between taxation, corporate finance and accounting. We started from the idea that the Baltic stock exchanges are together emerging markets and new places for investing. The final goal was to study the drivers of the effective corporate tax rates from the Baltic listed companies in the context of the relations between managers-shareholders and investors. The corporate income tax / effective tax rate has macroeconomic, microeconomic, political and social impact.
1.1. Drivers of the ECTR Based on Financial Statements (academic literature)
2.2.1. The impact of profitability and size on the ECTR
There are countless computation formulas for the ECTR, but Devereux and Griffith (1998) developed the effective marginal tax rate and the effective average tax rate. The literature about the drivers of ECTR has at its core three categories of indicators based on financial statements: profitability, assets composition and indebtedness. Finkenzeller and Spengel (2004) considered that higher profitability makes the companies search for location with lower statutory tax rates such as the Baltic region. Gupta and Newberry (1997), Lee and Swenson (2012), and Richardson and Lanis (2007) studied the drivers of effective corporate tax rates and one of the proxied used for profitability was the return of assets (ROA) which recorded a positive link with ECTR. Gupta and Newberry (1997) decomposed the formula of the effective tax rate and have rewritten it with ROA included. Thus, they considered that an increase of the ROA will lead to an increased ECTR. But other authors such as Buijink et al. (2002) who studied European companies or Md. Noor et al. (2010), recorded a negative link between ECTR and return of assets. We consider that big and profitable companies are able to redirect their profitability and size in order to obtain lower levels of ECTR and thus, lower levels of tax burden. From this idea, two theories were derived in the academic literature: political power and political cost theories. Belz et al. (2015) obtained a negative link between firm size and the effective corporate tax rate, supporting the political power theory. In research papers, political power is usually linked to firm size on the principle that size is power. The opposed side of the authors see size as a weakness in front of the fiscal authorities.
Dyreng et al. (2016) considered that large companies are victims of their size and suffer from the political cost theory. With size comes visibility in front of the public authorities and society who demand good practices; and that is a part of the profit of the companies to be shared within the community.
We set the presence of both theories political power and political cost as dual hypothesis for our empirical study
H1: Presence of political power and political cost through negative/positive link between ECTR and profitability/ firm size
2.2.2 The Impact of Indebtedness on the ECTR
The Modigliani–Miller’s theorem (1958) brought into the light the well-known link between indebtedness and taxation. The fact that interest expenses are deductible means that, in theory, debt reduces the level of the effective corporate tax rate. Finkenzeller and Spengel (2004) considered that the tax shield of the interest deductibility is lower for countries with low levels of statutory rates such as Lithuania and Latvia. Also for Estonia, interest expenses had indirect impact on tax burden, since in 2004, the tax base was formed by the distributed profit, so the interest expenses had a moderate effect in this context.
Gupta and Newberry (1997), Richardson and Lanis (2007), Wu et al. (2012) obtained empirical results about a negative link between long term debt and ECTR. We constructed our second hypothesis as follows:
H2: Higher indebtedness is negatively correlated with the effective corporate tax rate.
2.2.3 The impact of the structure of assets on the ECTR
Another important ‘pillar’ of the academic literature regarding the effective corporate tax rates is the link between ECTR and capital/inventory intensity. Gupta and Newberry (1997), Richardson and Lanis (2007) considered that capital investments have tax benefits which should lower the level of ECTR and inventory-intensive should have higher levels of ECTR. Fernández-Rodríguez and Martínez-Arias (2014) used the emerging countries and found that the inventory intensity is positively correlated with the effective tax rates. Derashid and Zhang (2003) recorded a negative link between capital intensity and the effective corporate tax rate. More assets mean more debt capacity and thus, more interest expenses for tax deduction, which finally means lower ECTR. Wu et al. (2012) obtained a positive link between inventory intensity and ECTR. We set as third hypothesis (dual) as the following:
H3: Negative relation between capital intensity and the ECTR; negative link between inventory intensity and the ECTR.
2.2.3 Other potential drivers of ECTR
Gupta (2007) considered that corporate income taxes capture a glimpse of the political aspects from the financial markets. Authors such as Griffith and Klemm (2004) considered that statutory rate can be a negative influence in the ‘war for investors’ of tax competition between countries (emerging/developed). Devereux (2006) showed that higher statutory rates are positively correlated with higher effective corporate tax rates. Thus, we deployed a variable for statutory rate and we expect to have a positive link with ECTR.
Graham et al. (2012) considered the financial statements as the main source of risk in financial reporting. Gallemore and Labro (2015) observed that lower levels of effective corporate tax rate depend on the quality of the financial reporting. Cook et al. (2008) found a positive correlation between audit fees and ECTR, but for the companies which used “Big Four” accounting firms, the correlation reversed. Mills et al. (2013) considered that big companies have the financial resources to pay for tax specialists in order to maximize their tax savings and to reduce their ECTR. Donohoe and Knechel (2014) observed positive correlation between audit fees and tax aggressiveness which is specific to US companies. However, Baltic countries have lower statutory rates, and we expect that companies with higher audit fees have a positive correlation with ECTR because more activity from the auditors means companies’ inefficiency; as external auditors inhibit the managers from tax avoidance practices.
Gupta and Newberry (1997) considered that research and development expenses are deductible and act as tax shield. They obtained a mixed link between R&D intensity and ECTR. Richardson and Lanis (2007) obtained a negative link between ECTR and R&D intensity. Pilinkienė (2015) revealed that the Baltic States have R&D expenditures in low technology industries with a slowly trend. Estonia has the best R&D expenditures among the Baltic countries close to the EU average.
Research Methodology
3.1. Data and Variable Measurement
In order to apply our empirical models, we developed a sample which comprises public companies from the three Baltic countries: Latvia, Estonia and Lithuania. The sample is covering the period between 2000 and 2016. It comprises 40 companies: Latvia 17, Estonia 7 and Lithuania 16. We chose the year 2000 as the starting point because, from our perspective, it represents the end of transition for the Eastern European countries and the beginning of a new financial era. Companies with more than three years of missing data or negative pretax income/negative ECTR were excluded from the sample. We excluded the financial companies such as banks and insurance companies from the sample because they have other regulations for financial reporting. Data were collected from Thomson Reuters Eikon. These filters yielded a total of 680 observations.
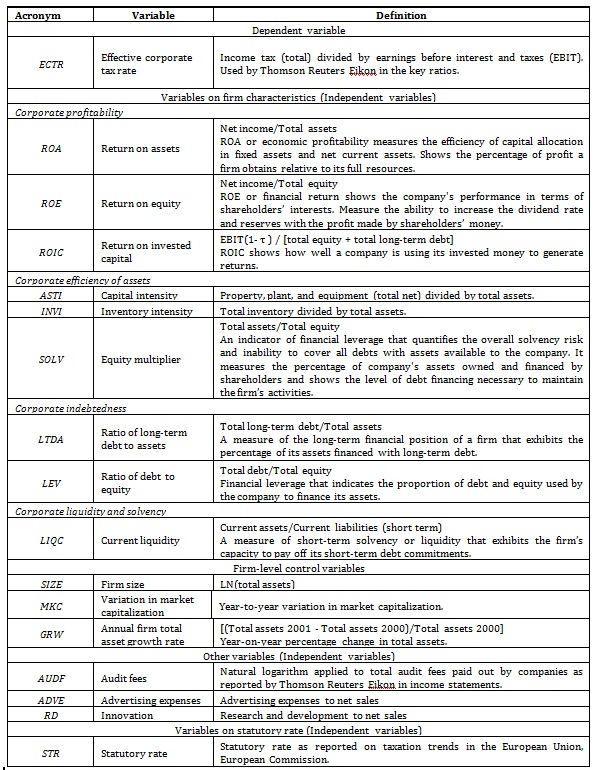
Table 1 comprises the variables used in the empirical analysis. We used the ECTR as proxy for the corporate tax burden. We selected different variables for profitability expressed through three proxies: return on equity (ROE), return on assets (ROA), and return on invested capital (ROIC) because each one captures the perception of company’s stakeholders. Other firm characteristics included indebtedness, liquidity, and solvency.
First of all, we used three proxies for profitability (ROA, ROE and ROIC) and we expect a negative correlation contrary to other papers from the literature (see Gupta and Newberry, 1997). We expected to find a negative correlation between debt and the ECTR due to the deductibility of the interest expenses. As proxies for indebtedness, we used solvency/financial leverage to ensure robustness for results. Since our study is based on financial statements, many of the variables depend on the efficiency of assets. Capital intensity and inventory intensity are common variables from the academic literature. We focused our research on the opposed theories of ‘political power’ and ‘political cost’. The first theory is linked with firm size, market capitalization and firm’s annual total asset growth rate. Belz et al. (2015) consider that big companies own enough financial resources to lobby for a lower tax burden and to achieve a reduction in the effective corporate tax rate. Financial resources mean power and with power, the lack of fear of penalties appears for big companies. On the other side, political costs theory is present in the case in which a large company is targeted by authorities attempting to use taxation to help support the budget. This theory is more relevant in the context of the emerging markets and the Baltic markets are aspiring at the status of ‘developed market’. Political cost can be considered a barrier for the development of a stock exchange. We expected to observe both theories in our sample.
Additional to these variables, we deployed audit fees as part of the corporate governance because audit is a strong element for financial quality and also for testing political power theory. Auditor’s reports can reduce questionable activities conducted by the big companies in order to reduce their effective tax rate. Kern and Morris (1992) observed a direct relation between the size of a company and the difference between earnings recorded in its accounting and reported taxable earnings. We expected to find a negative link with the ECTR. Advertising expenses are very important for the development of a company and can enhance the level of political power owned by a big company. We expected to find a negative link with the ECTR. Statutory rates are directly linked with ECTR and we deployed a variable in our empirical models.
1.1. Model Specification
For the empirical model, we used multivariate regressions (data panel) and we deployed generalized least squares (cross-section weights [GLS]) regressions as an estimation method. Gujarati (2004) indicates GLS as a method against heteroscedasticity. In order to avoid biased results, we used fixed effects and White cross-section techniques. The general regression examines the influence on the ECTR of firm characteristics, auditing fees, statutory rates, and firm-level controls, as follows:
where i = firms 1-40, t = financial years 2000-2016, ECTR = effective corporate tax rate (dependent variable), Firm_characteristics = variables regarding corporate efficiency, indebtedness, liquidity, and solvency, along with profitability (explanatory variables), Firm_controls = variables regarding firm size, market capitalization, and annual growth, Other_variables = audit fees paid out by companies (explanatory variables), advertising expenses, research and development intensity; α0 = intercept, β1, β2, β3 = regression coefficients, ɛit is the error term.
Empirical Results
2.1. Descriptive Statistics, Correlations, and Stationarity Checks
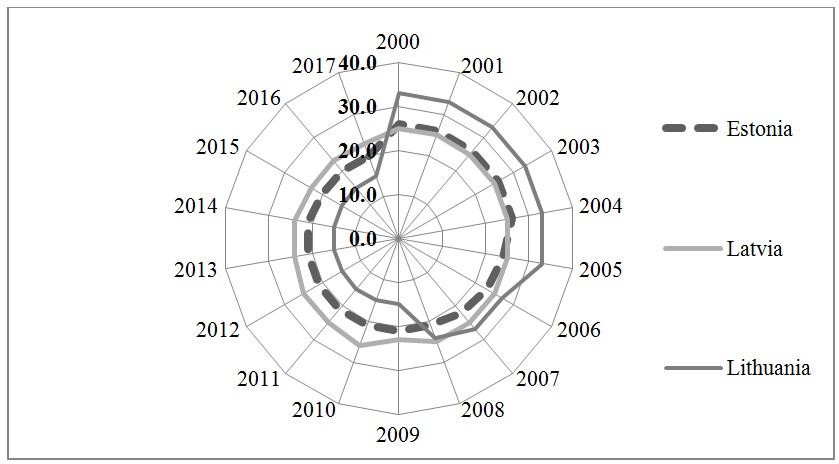
Estonia, Latvia, and Lithuania are in a continuous endeavor to attract foreign investors through their tax systems. For example, in Estonia, there was the zero percent corporate income and the flat income tax rates[1]. Elschner and Vanborren (2009) and other authors observed that member states from the European Union had a decline of their statutory rates and implicitly on their ECTRs. Figure 1 confirms that the Baltic States reduced their statutory rates. Lithuania had the most striking evolution from 33% to 15%. Finkenzeller and Spengel (2004) said that Estonia in the period of pre-accession had a tax system with tax base not linked to the corporate profits. In fact, the retained earnings were exempted from taxation and only distributed profits were exposed to corporate income tax. But our study is based on variables from the financial statements and we avoid this legal provision.
Source: Authors’ computations. Figure 1 contains the top statutory corporate income tax rates (including surcharges) for the period 1995-2017. Data are available at: European Union,
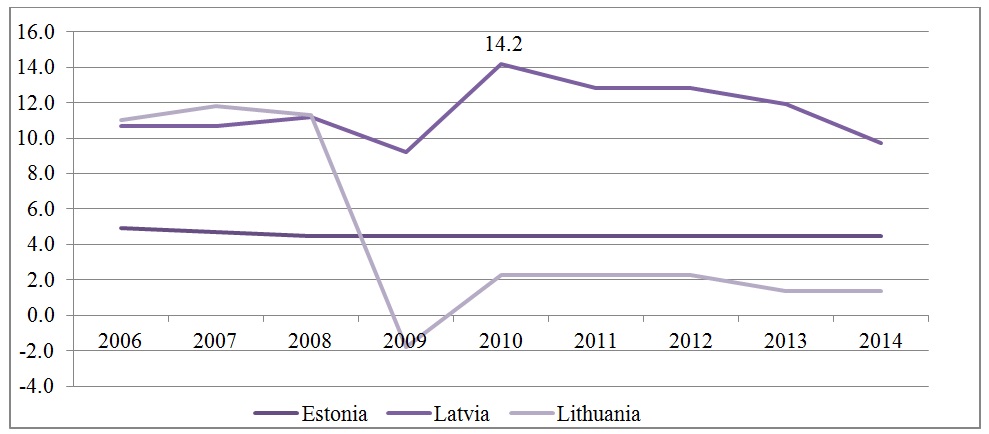
There are some differences between the Baltic countries in term of economic development. With the lowest population (1.3 million[1]), Estonia is the most advanced. The second place is occupied by Latvia and on the last place is Lithuania with 2.9 million inhabitants (the biggest Baltic state) which try harder to attract foreign investors with lower fiscal policies. The reduction of statutory rates is connected with accession to the EU, but they can be derived from the transition process to the capitalist markets. Baltic countries have successfully implemented the international views about corporate finance, accounting standards and digitalization to obtain lower levels of effective corporate tax rates. Also, the fact that the total population combined is almost 7 million people eases the activity of the fiscal authorities and implementation of more laxed tax policies. Elschner and Vanborren (2009) observed the tax differences between new member states from Eastern Europe and the older ones. They conclude that the accession fueled the gap between them as an effect of the sharp tax competition (see Davies and Voget, 2009). As it can be seen from Figure 1, after year 2004 (accession year), the statutory rates have decreased. The effective average tax rates had slightly moved over the years but are lower than the statutory rates, which means that the Baltic companies are using tax deductions and tax breaks in order to lower their ECTR. In Figure 2, there are the gaps between statutory rates and the effective average tax rates within the Baltic countries.
The highest gap between statutory rate and the effective average tax rates was recorded by Latvia in 2010 (14.2%) and the lowest by Lithuania in 2009 which means that EATR was higher than statutory rate. Companies from Lithuania did not cope with the shift from fiscal policies and they use fewer tax deduction. Latvia was the most affected Baltic state by the 2007 crisis and it is possible that the state allowed more tax aggressiveness for the companies to recover.
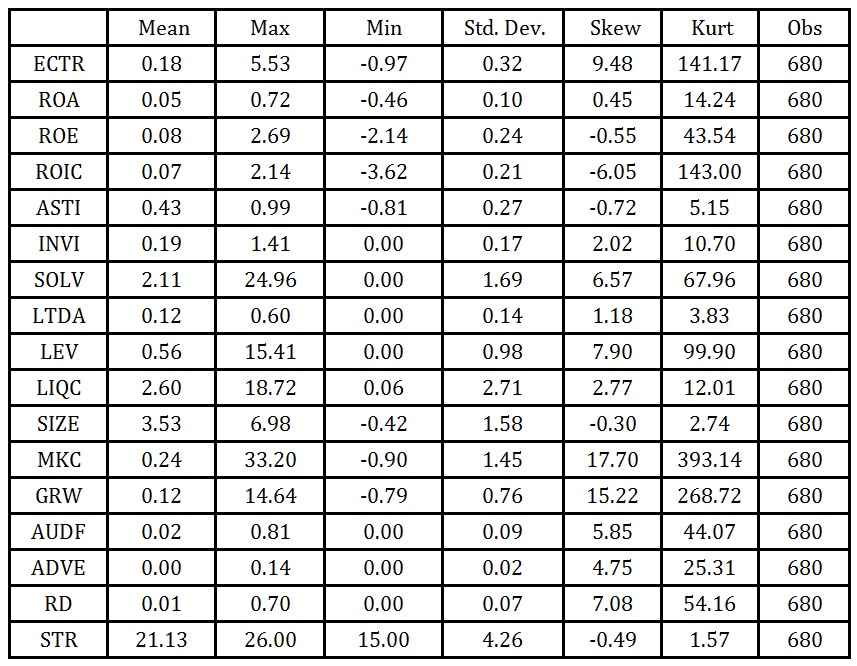
Descriptive statistics for the selected variables are presented in Table 2. It should be noted that the means of effective corporate tax rate is 18% much smaller than US companies.
Table 2: Summary statistics (N = 680)
Source: Authors’computations. Data based on financial statements reported by Thomson Reuters Eikon. Notes: For definitions of the variables, see Table 1.
About profitability ratios, ROE 8%, ROA 5%, and ROIC 5%, which are low ratio, but are expected for the emerging markets which were severely affected by the 2007 crisis, especially Latvia. On average, statutory rates are 21.13% which indicate a moderate use of tax avoidance and tax deductions.
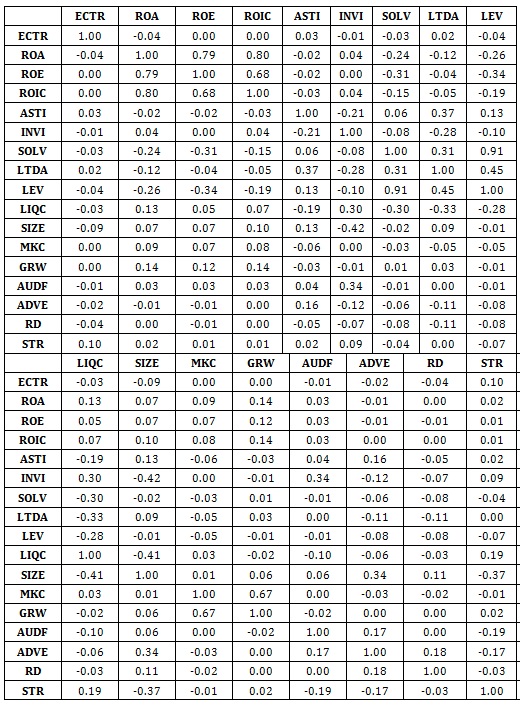
The correlation matrix is presented in Table 3. Standard errors are increased by the effect of multicollinearity and lead to results that are statistically insignificant.
Table 3: Correlation matrix – Pearson
Source: Author’s computations
Notes: Values highlighted with ‘* and italics indicate high correlation. For definitions of the variables, Please see Table 1 for definition of variables.
Profitability variables recorded high levels of correlation but we deployed them in separate models. There is a high correlation between SOLV and LEV. Also, market capitalization and assets’ annual growth are correlated, but we decided to keep them together since they are constructed from unrelated data.
1.1. Econometric Output
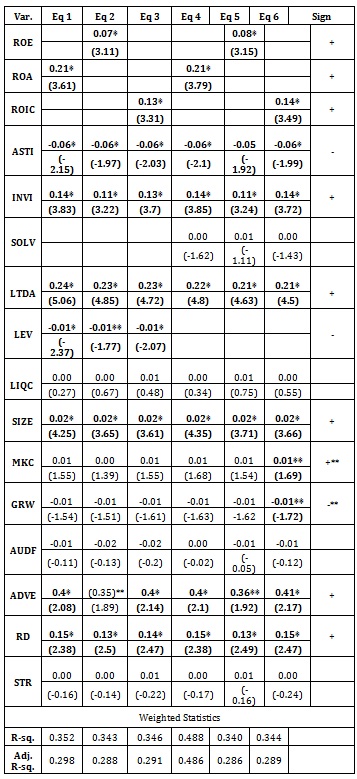
Table 4 contains the empirical results obtained with generalized least squares (GLS) estimation method.
Table 4: Coefficients estimated by generalized least squares (GLS) with White’s method (cross-section weights) and fixed-effects
Source: Author’s computations
Notes: Statistical significance: *, ** indicate statistical significance at the 5% and 10% significance level. The t-statistics are in parentheses. Total observations: 680. Period 2000-2016. Method: Panel EGLS (Cross-section weights). White cross-section standard errors & covariance. For definitions of the variables, see Table 1.
In statistical inference, the coefficient of determination (R2) is used in order to validate a model. On average, the goodness-of-fit statistic (R2) was 37%. The low value means that only 37% of the variation of the effective corporate tax rate is explained by the selected variables. In fact, there is no clear line about which variables influence the level of ECTR and there are many computation formulas for the effective tax rate. We keep the formula used by Thomson Reuters because it is one of the most common and spread formula from the financial analysis about ECTR. The maximum value was recorded for Eq.4 (48.8%). One possible explanation is that the European States, including the Baltic ones, have lower levels of effective corporate tax rates, compared with US companies and they are less incentivized to use tax avoidance practices for reducing tax burden. This hypothesis is supported by Huizinga and Laeven (2008) who obtained empirical results about the fact that tax records are smaller in the European markets than in the United States because tax burden is less significant. Also, the quality of financial reports and the performance of the Baltic companies are at a level specific to the emerging markets and the managerial abilities of the CEOs have less impact on the ECTR.
All three proxies for profitability – ROA, ROE and ROIC – recorded a positive link with the effective corporate tax rate in all six equations. Our initial hypothesis H1 was rejected (political power) and proved (political cost) in the same time. The results are on the same line with other papers from the literature (see Gupta and Newberry, 1997; Lee and Swenson, 2012). The logic behind this choice is related to corporate governance. We considered that they represent, in this context, the view about taxation of the most important stakeholders within a company: shareholders, managers and investors. Return on assets is considered by some authors as return of the managers; ROE is return of the managers and ROIC is return of the investors. Also, they represent the financial health of the company and we are expected to have a negative correlation with ECTR since a prosperous company should be able to lower its effective tax rate. Using European companies, Buijink et al. (2002) recorded negative correlation between ROA and the ECTR. ROA had the strongest coefficient (0.21) and shows the return of the managers and the positive link means that Baltic CEOs are unable or unwilling to fully use performance for reducing the ECTR. ROIC had positive link with ECTR. It is possible that lower levels of ECTR are to be considered questionable and to be regarded as a risky investment by investors. Thus, companies with levels of ECTR way down above the average may not attract investors compared to the ones with higher ECTR. Efforts to increase the profitability are ‘expensive’ and the costs are non-deductible, so more return means higher ECTR in this context. The final point is about the relation between profitability and managers. Managers who are able to increase the company’s profitability may have more appetite for non-deductible expenses (on their own benefit or for the company). This idea is important in the context of corporate finance (the lack of protection of minority shareholders) and in the context of political power vs. political cost theories. With our empirical results, we accepted part of the hypothesis H1 and we supported political cost theory for the Baltic companies. It could be a consequence of the fact that the Baltic States gave many deductions to the company in their struggle to become developed states and, maybe, as pay-back, companies have to endure the political costs effect. To support the political cost theory even more, variable SIZE for firm size recorded a positive sign. Thus, we accepted half of the hypothesis H1. It seems that the Baltic companies are taxed more as they become bigger. Market capitalization (subject to the fact that it was statistically significant only in Eq. 6 with ROIC) recorded a positive link with the effective tax rate. Companies which are successful on the capital markets and attract more investors have a lower level of ECTR, maybe as an effect of the political cost theory. Because companies with high levels of market capitalization are able to attract more investors, they are also able to lobby for more tax breaks. Year-to-year assets’ growth recorded a negative sign which supports the political power theory (subject to the fact that it was statistically significant only in Eq. 6 with ROIC). Firm size (proxied in many ways) as a driver of the effective corporate tax rate has different trends over time: as becoming bigger, a company is aimed by the fiscal authorities, but after a level, when the company has enough financial resources and political power for lobbying, it appears a reverse sense of tax-related influence – from the company to the authorities.
A positive correlation was recorded between ECTR and inventory intensity as we expected because stocks do not have tax deductions. On the other side, capital intensity recorded a negative link with the effective corporate tax rate. Thus, we proved hypothesis H3. Intangible assets have tax deductions such as tax depreciations which lowers the level of ECTR. Stickney and McGee (1982) considered that heavily capital intensity firms and leveraged usually have lower levels of ECTR.
It is notorious that indebtedness has an influence on the level of effective corporate tax rate. Variables related to debt are LTDA, LEV and SOLV (which was not statistically significant). Interest expenses derived from debt are tax deductible, and is expected that ECTR for an indebted company to be lower. Variable for the financial leverage, LEV, proved this fact and recorded a negative link with the ECTR. The fact that the Baltic stock exchanges are underdeveloped, banking system remains a major source of financing. LTDA recorded a positive link with ECTR and our hypothesis H2 was rejected. Long term debts have interest expenses but also have higher risk of bankruptcy and more control from the creditors. Thus, managers have more difficulties to search for financial resources and have more non-deductible expenses. Also, the attention of the creditors complicates the ability of the managers to use financial ‘tricks’ designed for obtaining a lower ECTR. Thus, for the Baltic companies and their effective corporate tax rate, indebtedness plays an important role through the fact that lowers the level of taxation, but on the long time the influence becomes opposed.
Variables for current liquidity and statutory rate were not statistically significant. These results are interesting in adding the low value of R2. It seems that for the Baltic companies, the level of ECTR is not influenced in a major proportion by the statutory rates established through fiscal policies, and the managers are more focused on the financial management. Nikkinen et al. (2012) studies revealed low integration between global and the Baltic stock exchanges. Thus, the Baltic countries were not incentivized to use statutory rates as a major driver of their stock exchanges and companies are more interested about profitability and financial management.
To further explore the effective corporate tax rate in the context of corporate governance, we deployed in our estimation models; variables for audit fees, adverting expenses and R&D expenses. AUDF was not statistically significant and we rejected hypothesis H1. Audit fees matters for the quality of financial reports and for investors. More audit fees means that the managers are controlled and are inhibited from tax avoidance and illegal practices conducted for tax elusion. Thus, we expected the companies with higher audit fees to have higher levels of ECTR. Advertising expenses and R&D expenses were positively correlated with ECTR and we deployed these variables in our models in support of political power theory. Companies which have more advertising expenses and R&D should be more profitable and should become bigger; with size comes power. Also, some of these expenses are deductible. The positive sign indicates, again, that in the Baltic financial markets, the political cost theory is present.
4.3 Supplemental Analyses
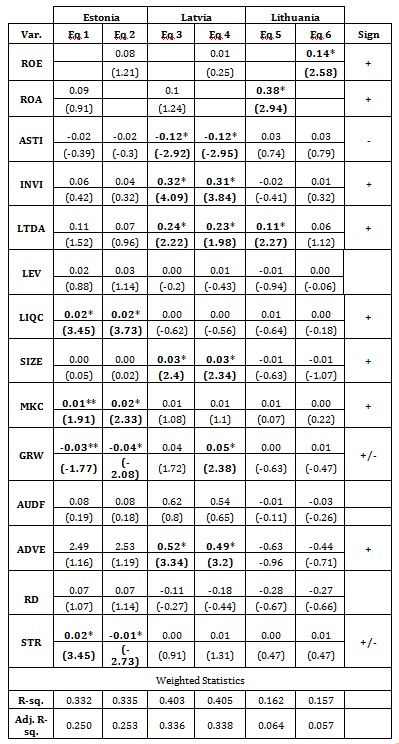
Apart from the empirical analysis deployed on the Baltic countries as a sample, for further in-depth analysis, we applied the estimation model for each country from the sample. Table 5 contains the drivers of ECTR for each country: Estonia, Latvia and Lithuania.
Table 5: GLS and fixed-effects results of firm characteristics on taxation, 2000-2016
Source: Author’s computations
Notes: statistical significance: *, ** indicate statistical significance at the 5% and 10% significance level. T-statistics are in parentheses. Total observations = 1,836. Method: Panel EGLS (Cross-section weights). White cross-section standard errors & covariance and fixed effects. For definitions of variables, see Table 1. EE = Estonia, LV = Latvia, LT = Lithuania.
From Table5 it can be observed that the coefficient of determination (R2) had the smallest values for Lithuania and we considered that Adj. R-sq. has values that indicate to eliminate these regressions. The negative economic performances from the pre-accession period (2000-2004) have affected the Lithuanian companies and losses affected the general level of the effective corporate tax rates, and there are no significant influence factors of ECTRs. Budrytė (2005) considered that despite the fact that Lithuania has the lowest tax burden among the Baltic States, there are some difficulties about collections and tax compliance. This can be the reason of the lack of statistically significance recorded for Lithuania in our models. Thus, for the country analysis, we kept only Estonia and Latvia which had the highest R2 (40.5%). Alena et al. (2017) refer in appreciative terms to the financial policies conducted by Estonia and Latvia. For Estonia, variable for current liquidity was positively correlated with the effective corporate tax rate and this fact was expected since more liquidity means fewer loans and less interest expenses. Statutory rate had a positive link with the ECTR in Eq.1 (with ROA) and a negative link in Eq.2 (with ROE). This result means that in Estonia, ECTR is influenced by the level of statutory rate and it is an indicator of the lack of tax avoidance practices from the managers. For example, fiscal authorities adopted a program named Controlled Foreign Companies (CFC) as a measure to reduce tax avoidance[1]. Managers focus more on the financial management than on the fiscal management, as year-to-years assets’ growth shows: a negative sign on the link with ECTR. But, the positive sign of influence recorded for the market capitalization proves the political cost theory. The link between STR and ECTR is probably due to the fact that in Estonia, statutory rates were constant over the years and the managers could use them as a benchmark for the ECTR. Deltuvaitė (2016) considered that Estonia and Lithuania are more exposed on the international risk than Latvia which is more exposed on the domestic risk drivers. Thus, public companies from Estonia are more depended and interested on the level of statutory rates because they are more exposed.
For Latvia, we recorded a negative link between capital intensity and ECTR. And a positive sign between inventory intensity and ECTR. These results are in line with the principles of tax deductions. Long term debt on total assets recorded a positive link with the effective corporate tax rate which means that on the long time, debt brings non-deductible cost for the company. Again, the presence of political cost theory was proved for Latvia through the positive correlations between the effective tax rate and SIZE, GRW and adverting expenses. Big companies from Latvia are taxed more by the state and the idea of domestic risk drivers is supported by these results.
Concluding Remarks
The maturity of the Western European markets makes investors seek other places of investing. An interesting place from the European Union is the Baltic regions with Estonia, Latvia and Lithuania because all these former soviet countries are trying to be attractive for investors. We conducted an empirical study of the drivers of ECTR in the Baltic countries, in the context of corporate finance for the period between 2000-2016. As a result, we observe that tax deductions, based on financial statements and assets composition, follow the accounting principles (e.g. heavy capital intensity companies have lower levels of effective corporate tax rates and companies with more inventory intensity have higher levels of ECTR; indebtedness with the deductibility of the interest expenses lowers the level of ECTR but on the long term the link is reversed). The positive signs obtained for profitability proxies (ROA, ROE, ROIC), proxies for size (firm size, market capitalization, assets growth) and advertising / R&D expenses supported the presence of the well-known political cost theory. It seems that for the Baltic companies, their financial success is shared with the state and population. This link is expected for small countries with small population and thus, fewer contributors. Statutory rates had results that were not significant from the statistical point of view and these results mean that the managers from the Baltic companies are more focused on the financial management than on the fiscal management and tax avoidance. For Estonia (models per country), we recorded a mixed link between statutory rate and effective corporate tax rate. Unfortunately, the audit fees were not statistically significant and we could not draw a conclusion about their impact on the effective corporate tax rate.
There are some limitations in our articles, derived from the small number of companies included in the sample, after we applied filters of selection. Baltic stock exchanges are underdeveloped and on the future research we propose a data base with other companies from the Baltic region in order to capture the drivers of effective corporate tax rate from these countries.
Alena A., Lucia M., Slavomíra M., (2017). Meta-analysis categorization of EU countries in the context of corporate income tax. Contaduría y Administración 62 (2017) 1001–1018
Belz T., von Hagen D., & Steffens C. (2015). R&D intensity and the effective tax rate: A meta-regression analysis. Working paper. http://dx.doi.org/10.2139/ssrn.2623561
Brännäs, K. & Soultanaeva, A. (2011). Influence of News from Moscow and New York on Returns and Risks of Baltic States’ Stock Markets. Baltic Journal of Economics, 11(1), 109–124. http://dx.doi.org/10.1080/1406099X.2011.10840493
Buijink W., Janssen B., & Schols Y. (2002). Evidence of the effect of domicile on corporate average effective tax rates in the European Union. Journal of International Accounting, Auditing and Taxation, 11, no. 2: 115-130. http://dx.doi.org/10.1016/S1061-9518(02)00069-1
Budryte A., (2005). Corporate income taxation in Lithuania in the context of the EU. Research in International Business and Finance, 19 (2005) 200–228
Cook K.A., Huston G.R., & Omer T.C. (2008). Earnings management through effective tax rates: The effects of tax-planning investment and the Sarbanes-Oxley Act of 2002. Contemporary Accounting Research, 25, no. 2: 447-471, http://dx.doi.org/10.1506/car.25.2.6
Davies R., & Voget J. (2009). Tax Competition in an Expanding European Union. Institute for International Integration Studies Discussion, No. 276. Dublin
Deltuvaitė Vilma, (2016 Investigation of Stock Market Integration in the Baltic Countries. Economics and Business. doi:10.1515/eb-2016-0006
Derashid C., & Zhang H. (2003). Effective tax rates and the industrial policy hypothesis: Evidences from Malaysia. Journal of International Accounting, Auditing and Taxation, 12, no. 1: 45-62. http://dx.doi.org/10.1016/S1061-9518(03)00003-X
Devereux M.,(2006). Developments in the taxation of corporate profit in the OECD since 1965: Rates bases and revenues. University of Warwick.
Donohoe, M. P., & Knechel, W. R. (2014). Does corporate tax aggressiveness influence audit pricing? Contemporary Accounting Research, 31(1), 284-308. doi: 10.1111/1911-3846.12027
Dyreng S.D., Hanlon M., Maydew E.L., & Thornock J.R. (2017). Changes in corporate effective tax rates over the past 25 years. Journal of Financial Economics, 124, no. 3: 441–463.
Dyreng S., Hoopes J., & Wilde J. (2016). Public pressure and corporate tax behavior. Journal of Accounting Research, 54, no. 1: 147-186. http://dx.doi.org/10.2139/ssrn.2474346
Elschner C., & Vanborren W. (2009). Corporate effective tax rates in an enlarged European union. Taxation Papers, 14.
Fernández-Rodríguez E., & Martínez-Arias A. (2014). Determinants of the effective tax rate in the BRIC countries. Emerging Markets Finance & Trade, 50, s3: 214-228.
Finkenzeller M., Spengel C., (2004). Measuring the Effective Levels of Company Taxation in the New Member States: A Quantitative Analysis. Taxation Papers, Working paper nr.7.
Gallemore J., & Labro E. (2015). The importance of the internal information environment for tax avoidance. Journal of Accounting and Economics, 60, no. 1: 149-167. http://dx.doi.org/10.1016/j.jacceco.2014.09.005
Graham J., Raedy J., & Shackelford D. (2012). Research in accounting for income taxes. Journal of Accounting and Economics, 53, no. 1: 412-434.
Gujarati D.N. (2004). Basic Econometrics. 4th ed. New York: McGraw-Hill/Irwin.
Gupta S., & Newberry K. (1997). Determinants of the variability in corporate effective tax rates: evidences from longitudinal data. Journal of Accounting and Public Policy, 16, no. 1: 1-34. http://dx.doi.org/10.1016/S0278-4254(96)00055-5
Gupta S.,(2007). Determinants of tax revenue efforts in developing countries. Working Paper 07/184. InternationalMonetary Fund., http://doi.org/10.5089/9781451867480.001.
Hanlon M., Heitzman S. (2010). A review of tax research. Journal of Accounting and Economics, Vol. 50, No. 2-3, p.p. 127-178
Huizinga H., & Laeven L. (2008). International profit shifting within multinationals: A multi-country perspective. Journal of Public Economics, 92, nos. 5-6: 1164-1182.
Kern B.B., & Morris M.M. (1992). Taxes and firm size: The effects of tax legislation during the 1980s. Journal of the American Taxation Association, 14, no. 1: 80-96.
Lee N., & Swenson C. (2012). Are multinational corporate tax rules as important as tax rates? International Journal of Accounting, 47, no. 2: 155-167. http://dx.doi.org/10.1016/j.intacc.2012.03.001
Md Noor R., Fadzillah N.S.M., & Mastuki N. (2010). Corporate tax planning: A study on corporate effective tax rates of Malaysian listed companies. International Journal of Trade, Economics and Finance, 1, no. 2: 189-193.
Mills L., Nutter S., & Schwab C. (2013). The effect of political sensitivity and bargaining power on taxes: Evidence from federal contractors. The Accounting Review, vol. 88, issue 3, pp. 977-1005. http://dx.doi.org/10.2139/ssrn.1621861
Modigliani F, & Miller M.H. (1958). The cost of capital, corporation finance and the theory of investment. American Economic Review, 48, no. 3: 261-297.
Nikkinen, J., Piljak, V., Äijö, J. (2012). Baltic Stock Markets and the Financial Crisis of 2008–2009. Research in International Business and Finance, 26,398–409. http://dx.doi.org/10.1016/j.ribaf.2012.03.003
Pilinkienė V., (2015). R&D investment and competitiveness in the Baltic States. Procedia – Social and Behavioral Sciences 213 ( 2015 ) 154 – 160
Richardson G., Lanis R. (2007). Determinants of the variability in corporate effective tax rates and tax reform: Evidence from Australia. Journal of Accounting and Public Policy, 26, no.6: 689-704. http://dx.doi.org/10.1016/j.jaccpubpol.2007.10.003
Stickney C. P., McGee V. E., (1982). Effective corporate tax rates the effect of size, capital intensity, leverage, and other factors, Journal of Accounting and Public Policy, Volume 1, Issue 2, Pages 125-152, ISSN 0278-4254, https://doi.org/10.1016/S0278-4254(82)80004-5.
Wu L., Wang Y., Luo W., & Gillis P. (2012). State ownership, tax status and size effect of effective tax rate in China. Accounting and Business Research, 42, no. 2: 97–114. http://dx.doi.org/10.1080/00014788.2012.628208