Poznan University of Life Sciences, Poznan, Poland
Volume 2021,
Article ID 946405,
Journal of Accounting and Auditing: Research & Practice,
14 pages,
DOI: 10.5171/2021.946405
Received date: 17 February 2021; Accepted date: 11 July 2021; Published date: 29 November 2021
Academic Editor: Grzegorz Warzocha
Cite this Article as:
Agnieszka PIECHOCKA-KALUZNA (2021), " Non-Earning Management Measures of The Quality of Financial Statements", Journal of Accounting and Auditing: Research & Practice, Vol. 2021 (2021), Article ID 946405, DOI: 10.5171/2021.946405
The quality of financial statements is the fundamental issue in terms of the reliability of the accounting conducted by those who prepare them. Since the beginning of the 21st century, and with the growing concerns regarding the data released in financial statements, the development of methods for testing the quality of financial reporting has been of great and growing importance. New methods designed for testing this quality are constantly being sought. It is also particularly important that in the event of significant changes in the scope of accounting and prepared financial statements, such as the introduction of IAS/IFRS, companies can be able to determine whether such integral changes influenced the quality of prepared statements and if so, to what extent. This paper is a description of the author’s several years of research, completed in 2020, on quality changes in financial reporting in Poland resulting from the implementation of IAS/IFRS. The research was conducted on the entire population of companies listed on the Warsaw Stock Exchange (WSE) in the years 2005-2019 which shifted from Polish regulations to IAS/IFRS. The novelty of this article is the use of not only less known methods (other than earnings management) of quality measurement, but also the XGBoost method, which is unprecedented in other researchers.
The globalization of the economy and business observed in the late 20th and early 21st centuries required the necessity to unify and standardize the “international language of business”, represented by accounting. This resulted in many works concerning the introduction of IAS – International Accounting Standards, and, subsequently, of IFRS – International Financial Reporting Standards (the abbreviations IAS and IFRS shall be used later in this paper) in an increasing number of countries throughout the world.
A logical corollary of such actions was to ask in what way the introduction of IAS/IFRS would influence the quality of financial statements drawn up in accordance with the new regulations. It was therefore of particular importance to find some criteria which would allow a reliable comparison between the quality of financial statements prepared “before” the introduction of IAS, i.e. prepared based on local solutions used by individual countries, and the quality of financial statements drawn up in accordance with the newly introduced international regulations.
The author has therefore decided to verify whether the example of Poland, which started implementing IAS in 2005 after joining the EU, entailed any changes in the quality of the prepared financial statements and, if so, in what way their quality changed. Partial research results were described by the author of this article in several local publications (Piechocka-Kałużna, 2019, and other publications). However, it was not until 2018-2020 that research was conducted on the most representative group of financial statements from companies that shifted from local Polish regulations to IAS. This enabled the comparison of the quality of their financial statements before and after the implementation of IAS. Initially, the research was centered on the application of the so-called earnings management (Piechocka-Kałużna, 2020). This paper, in turn, presents the effects of employing the supplementing complementary methods used for measuring the quality of financial statements.
A review of literature on the quality of financial accounting
The necessity to unify accounting as a response to the increasing globalization of the economy has many advocates. They include researchers and members of regulatory authorities, and, above all, participants of capital markets. Such standardization is aimed at supporting the management of multinational companies by increasing the comparability, as well as the clarity and quality of financial reporting. It enables ensuring better comparability of data, and thus contributes to a better functioning of financial markets (Fritz & Lämmle, 2003; Diaconu, 2006; Alexander & Jermakowicz, 2006; Brochet, Jagolinzer & Riedl, 2013).
Most of the aforementioned authors point to IFRS as the best standardization solution in financial reporting (Eccher & Healy, 2003; Amstrong, Barth, Ding & Su, 2008; Jagolinzer & Riedl, 2010). At the same time, it is noted that the IFRS adoption is beneficial to firms since it provides them with a lower cost of equity capital (Kim & Shi, 2007; Daske et al., 2007). It is also demonstrated that the adoption of IAS allows increasing the comparability of financial statements drawn up in different countries reducing information asymmetry (Leuz &Verrecchia, 2000; Leuz, 2003), and fosters the preparation of financial analyses that better reflect the actual entities’ situation (Ashbaugh & Pincus, 2001). The reason why the IFRS’s set of standards aspires to the role of a model for accounting, including, in particular, harmonized financial reporting, is the fact that it has already been widely accepted in many countries throughout the world. Today, there are more than 100 countries that have implemented and required, or at least allowed, the application of IFRS for the preparation of financial statements by entities (Ho, 2016).
Therefore, extending a model that is already commonly accepted and applied at any rate seems to be the simplest tool for the global harmonization of regulations which will increase the clarity and comparability of financial reporting among regions, countries and multinational companies, and minimize the concerns of investors and other stakeholders as well (Rogdaki, Koutoupis & Rodosthenous, 2011).
However, to answer the question about whether the implementation of IAS provided actual benefits measured not only in terms of mere comparability but also in terms of increased quality of financial statements, objective measures should be used in this respect. In literature, these measures most frequently concentrate on a diagnosis of applying the so-called “earnings management” (Burgstahler & Dichev, 1997; Lang, Smith, Raedy & Wilson, 2006; Barth, Landesman & Lang, 2008; Chen, H., Tang, Q., Jiang, Y. & Lin, Z., 2010; Dechow, Ge & Schrand, 2010; Sun, Cahan & Emanuel, 2011; Christensen, Lee, Walker & Zeng, 2015). The author of this paper also commenced the research with changes in accounting quality in Poland resulting from implementing IAS by conducting a study on the subject of earnings management (Piechocka-Kałużna, 2020).
It is nonetheless worth going beyond the used measure of earnings management to conduct other measurements inspired by studies carried out by the already mentioned authors and others (Leuzet et al., 2003; Morais & Curto, 2008; Isidro & Raonic, 2012; Hribar, Kravet & Wilson, 2014).
Thus, this paper is based on research carried out in two other crucial areas (except for earnings management which was described in another paper by the author of this article):
Timely loss recognition – high-quality financial statements should recognize loss on a timely basis,
Value relevance – high-quality financial statements should value all the positions relevantly.
These two areas might be determinants (measures) of the quality of financial statements, but not so popular as earnings management, however, they are also recognized measures enabling the identification of changes in the quality of statements facing the transition to IAS (Soderstorm & Sun 2007). It is also beyond doubt that such studies, carried out additionally in these two slightly less popular areas, will enable the objectivization of the results of measuring the most popular area previously obtained by the author, i.e. the identification of applying earnings management. Conducting such additional studies (other than on earnings management) in the same group as in a previous study by the author (Piechocka-Kałużna, 2020) will either lead to strengthen the reliability of the previously obtained results or to question them.
The first of these additional aspects of the quality of an entity’s financial statement is timely loss recognition. Timely loss recognition represents conservatism in accounting, reflecting the prudence principle. However, many companies desire to conceal their loss for the year. Among the numerous reasons for that behavior, at least three should be mentioned. Firstly, loss-makers are generally not able to increase the price levels for their products (especially for durable goods) since there is a risk that potential future complaints will not be honored. In effect, it may decrease the demand for these loss-makers’ products. Secondly, loss-makers’ suppliers are much more reluctant to grant trade credit because of the high risk of default of such a loss-making company. These suppliers are afraid that they deliver their goods and loss-maker entity will not have enough resources to settle the payment due to become a bankrupt. Thirdly, recorded losses for the year have an unfavorable influence on a company’s funding conditions (including the impact on interest rate increase).
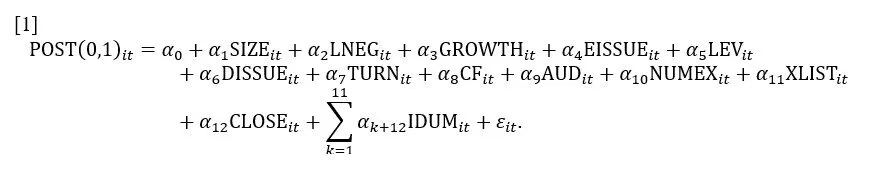
It is assumed that high-quality financial statements will report losses much more frequently since high-quality accounting standards do not possess built-in mechanisms for delaying loss recognition. According to model [1], it may be assessed using logistic regression:
Where (following Christensen) LNEG is an indicator variable that equals one for observations in which the annual net income scaled by total assets is less than -0.20, and zero otherwise. A positive coefficient on LNEG suggests that IFRS firms recognize large losses more frequently in the post-adoption period than they do in the pre-adoption period.
Model [2] may also be applied as the second measure useful for timely loss recognition evaluation:
where NI is the net income per share, P is the share market price, R is the annual return including dividend, and RD is an indicator variable that takes the value one if R is less than 0, and zero otherwise. This regression is calculated separately in the pre-adoption and post-adoption periods. A higher incremental coefficient on “bad news”, represented by β3 in the post-adoption period, is consistent with more timely loss recognition after IFRS adoption.
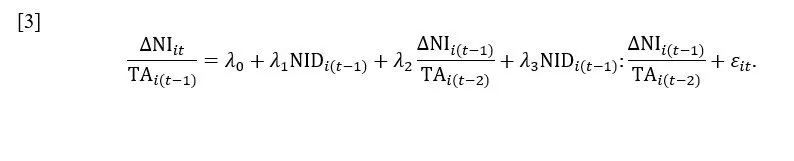
Following Christensen’s approach (Christensen, Lee, Walker & Zeng, 2015), the model [3] was applied as the third determiner of timely loss recognition:
where ΔNI is the change in the net income, TA is the total assets, and NID is an indicator taking the value one if ΔNI is less than 0 and 0 otherwise. A larger negative coefficient on the negative income (λ3) in the post-adoption period is consistent with more timely loss recognition after IFRS adoption that is, losses are less persistent.
The last measure of the quality of a company’s financial statement refers to value relevance. The most popular and recognized measure for this aspect of quality is the assessment of the relationship between data obtained from financial statements (as profit for the year or book value) and data that come from the capital market (as share price). Following previous studies, it is worth applying model [4]:
where P is the share price 6 months after the year-end, BVPS is the book value per share, and EPS is the earnings per share. A higher positive coefficient on earnings per share in the post-adoption period indicates increased value relevance of reported earnings after IFRS adoption. This would be consistent with a post-IFRS increase in accounting quality (Christensen, Lee, Walker & Zeng, 2015).
Methodology and sample description
This paper offers an analysis of data obtained from financial statements submitted by entities noted on the Warsaw Stock Exchange in the years 2004-2019 (data for 2004 in the sense of comparative data from the opening balance as compared to data for 2005, and data for 2019 in the sense of statements for 2019 published mostly in 2020) which changed reporting standards from the provisions of the Polish Accounting Act to International Financial Reporting Standards. This study is aimed at determining whether this change means an actual improvement in the quality of financial statements. This article is a sequel to the previous studies by the author (Piechocka-Kałużna, 2019), and its results should verify the validity of the conclusions previously reached.
The novelty of this study lies in the approach used in the literature, namely the use of the XGBoost method to measure the importance of variables used. It is worth noting that this is the first time this method, which is commonly used in machine learning and artificial intelligence, is being used to analyze financial statements. Thanks to this method, the author could reliably assess the significance of the features used. Also, various types of modifications were applied, such as the use of a model with fixed effects instead of an unobservable effect model for panel data. The author decided to apply this solution where the procedure used so far in the literature yielded uninterpretable results. Additionally, in the course of the research, the author’s attention was drawn to certain irregularities in the research methodology adopted worldwide for measuring the quality of financial statements, which, in the author’s opinion, occur and need clarification. It is particularly often that even though some of the parameters are statistically insignificant, they are nonetheless interpreted in a number of publications, despite the fact that no statistical significance means in this case that a particular parameter does not significantly differ from 0 (thus, it should be removed from the regression model and not interpreted), which is why such a variable does not affect the response variable. Under these circumstances, the author decided to exclusively interpret the parameters that are statistically significant. Moreover, in each of the analyzed models, the author clearly indicates which parameters are statistically significant and what is their level of statistical significance.
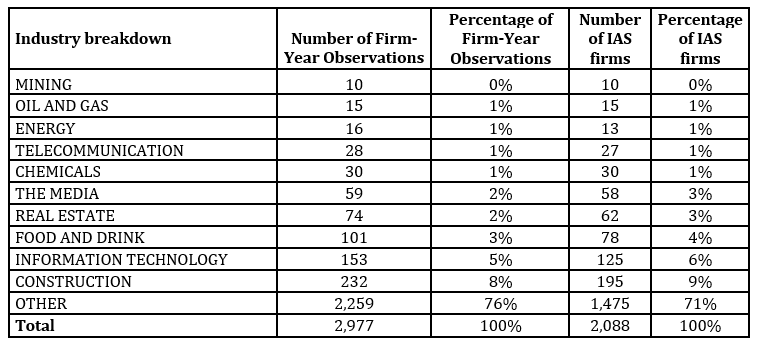
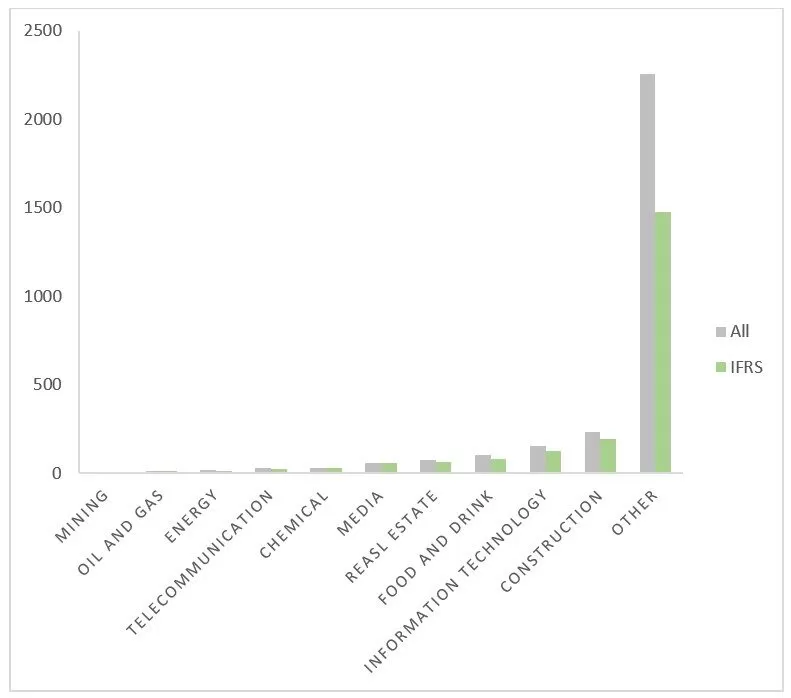
The sample consists of 2977 firm-year observations of Polish-based companies quoted on the Warsaw Stock Exchange – WSE (Poland) between 2004 and 2019. During the study, year-end standalone financial statements, auditors’ opinions and share quotations obtained from the Notoria database were used. Additionally, data of the aforementioned companies obtained from the National Court Register were analyzed. For each of these firms, the accounting standards applied to the annual reports were checked and a sample of ‘switch companies’ was designed – i.e. companies that transformed their accounting framework from Polish Accounting Rules (PAR) to International Financial Reporting Standards (IFRS). These were all transformations into IFRS during the years 2004-2019 on the WSE that referred to standalone financial statements only. The sample excludes group financial statements. Table 1 and chart 1 present an industry breakdown of the sample.
Table 1: Industry breakdown of the sample
Fig 1. Industry breakdown of the sample
As in well-known studies by Ball et al. (Ball, Robin & Wu, 2003; Ball & Shivakumar, 2005), Basu (Basu, 1997) and Barthet et al. (Barth, Landesman & Lang, 2008), anomalies were removed using the following criteria:
GROWTH > -100 or GROWTH < 100,
LEV -100,
DISSUE -100,
BVPS -100,
EPS -100,
ΔNI -100,
ΔCF -100.
All variables were defined in a manner most similar to the corresponding formulas described in the models, except for the control variable IDUM for which (following WSE methodology) industries were divided based on sub-indices:
WIG-budownictwo for construction industry,
WIG-chemia for chemical industry,
WIG-energia for energy,
WIG-górnictwo for mining,
WIG-informatyka for information technology,
WIG-media for the media,
WIG-paliwa for oil and gas industry,
WIG-spożywczy for food and drink industry,
WIG-nieruchomosci for real estate industry,
WIG-telekomunikacja for telecoms,
Others not included in none of above sub-indices.
Each of the applied models was estimated in two ways. First, for companies before transferring into IFRS (and it was named as -pre) second, for the same companies but after transferring into IFRS (which was named as -post). For each of the 4 models used for measuring quality, there are estimated regressions with results which illustrate the significance of particular variables at a given significance level (‘***’ for 1‰, ‘‘**’ for 1%, ‘*’ for 5% or ‘.’ for 10% significance). If there is no asterisk or dot, then it means that the variable was statistically insignificant in explaining the dependent variable.
As previously mentioned, the XGBoost (eXtreme Gradient Boosting) method (Chen & Guestrin, 2016) was applied for measuring the significance of features. The adopted approach utilizes regression trees (Breiman, Friedman, Stone & Olshen, 1984) and is widely used in the artificial intelligence community. Currently, this is one of the most frequently used methods of machine learning. It is widely used in industries like (Google, Alibaba, Tencent), enabling the use of not only quantitative but also qualitative features, and is perfectly scalable (the algorithm can be started simultaneously in numerous processes). Its remarkable advantage is the possibility of measuring the importance of the used variables. The importance is calculated separately for each tree. Next, it is averaged over all trees and scaled so that the most important feature has a measure of importance of 100. The results are presented using plots. If, for some models the plot is missing, it means that the tree with only one division was optimal and only one feature is important according to this criterion.
Results
Timely loss recognition assessment
Models [1] – [3] were applied to assess timely loss recognition. Model [1] is a fixed effect panel model in which n = 221, T = 1 – 15 and N = 1611.
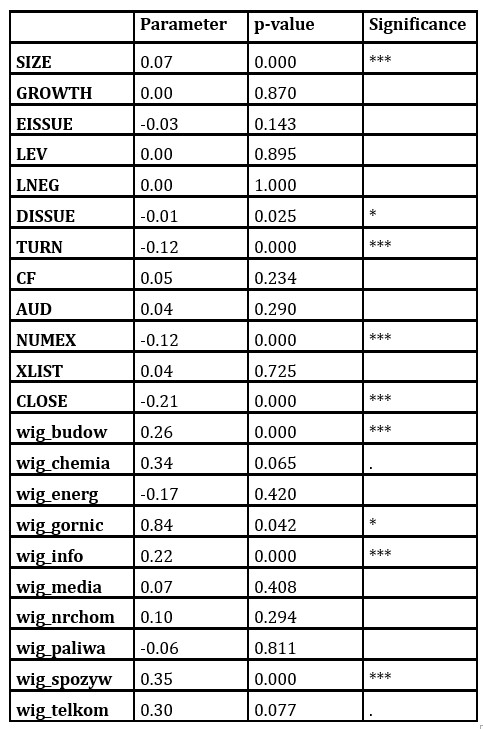
Table 2. Logistic regression for model [1].
According to table 2:
SIZE, TURN, NUMEX, CLOSE, construction, information technology and food and drink are significant variables at 1‰ significance level,
DISSUE and mining are significant at 5% significance level,
Telecoms are significant at 10% significance level.
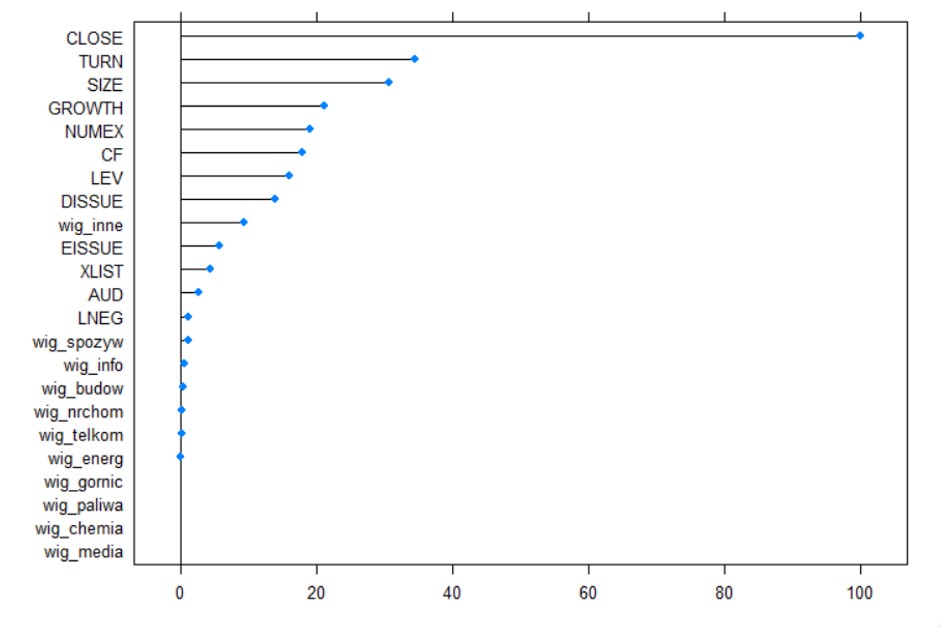
Fig 2. Importance of the features for model [1]
A ranking of importance for model [1] estimated using the XGBoost method shows that the CLOSE variable is the most important, which is partially consistent with panel regression results.
In model [2], it was assumed, in contrast to a study by Christensen, that R means the return on equity (ROE) ratio. Therefore, if a company reported loss for the year and if the value of its net assets was negative, the calculation of that variable was abandoned because it would lead to economic misinterpretation.
The effect of the estimation model [2] is a pooled estimation panel where n = 161, T = 1 – 12 and N = 490 (n = 222, T = 1 – 14 and N = 1694). The results of the regression are presented in tables 3 and 4.
Table 3. Panel regression for model [2] -pre
Based on table 3, it can be seen that the variable RD is significant at1‰ significance level and R: RD is significant at 10%
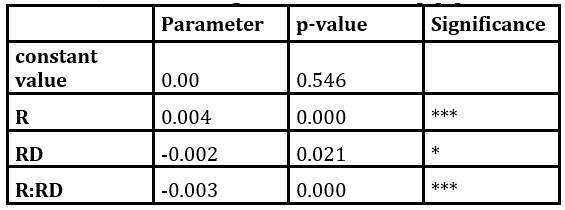
Table 4. Panel regression for model [2] -post
For years after transferring into IFRS, all of the variables occurred were significant, namely:
Variables R and R:RD at 1‰ significance level,
RD and constant value at 5% significance level.
Applying model [3], a pooled estimation panel was obtained where:
n = 187, T = 1 – 12 and N = 718 for the “-pre” companies,
n = 216, T = 1 – 13 and N = 1587 for the “-post” companies.
The detailed results are presented in tables 5 and 6.
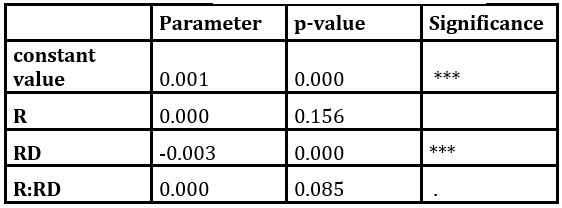
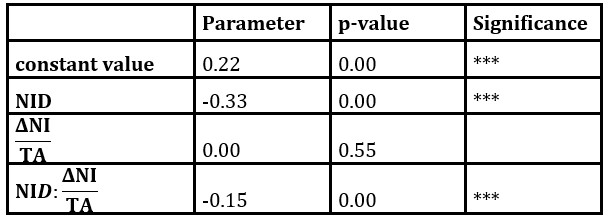
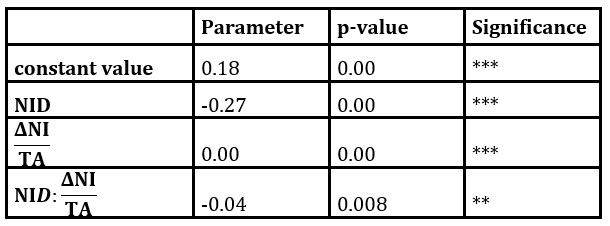
Table 5. Panel regression for model [3] –pre
Table 6. Panel regression for model [3] -post
All variables in model [3] for the years after the implementation of IFRS were significant, however, at different levels:
Variables NID and at 1‰ significance level,
Variable on at 1% significance level.
Value relevance assessment
The last model [4] was used to assess value relevance, as the third facet of financial statement quality.
The results of this pooled estimation panels are presented in tables 7 & 8. For -pre companies, the model yielded n = 227, T = 1 – 13 and N = 872. For the“-post” companies, it resulted n = 227, T = 1 – 15 and N = 2014.
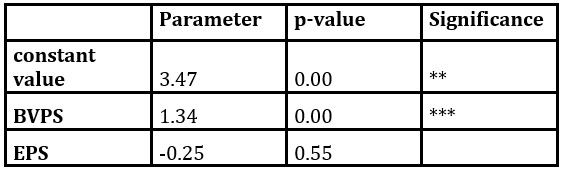
Tables 7. Panel regression for model [4] – pre
Based on table 7, the variable BVPS is significant at 1‰, and the constant value at 1% significance level.
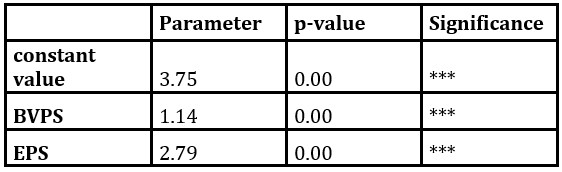
Tables 8. Panel regression for model [4] – post
The data of all of the three variables are significant at 1‰ significance level for the -post companies.
Conclusions
The final results with regard to the changes in the quality of financial statements for companies after transforming into IFRS are presented in table 9. The table presents a breakdown of the results of the research described in this article (in the field of the so-called “timely loss recognition” and “value relevance”). Additionally, (in table 9a), the results of research in the field of the so-called earnings management have also been presented. The research was conducted on the same population and described by the author in another article (Piechocka-Kałużna, 2020). This breakdown enabled the verification of conclusions reached previously by the author.
The volatility of data was calculated as the variance of the examined variable (Table 9a). An asterisk (‘*’) means that it was based on residuals instead of raw data. According to Barth et al. (Barth, Landesman & Lang, 2008), it is much more appropriate to examine the residuals of the models than the absolute values.
To test the equality of two variances, the well-known F-test was used. When testing other differences, the bootstrap test was used (Efron, 1982). Sampling was started (with replacement) on a sample of companies with the same size as the whole sample. For each of the samples, the value of interest was determined and compared with the observed value. The entire procedure was repeated 1000 times. The percentage of bootstrap values greater than the observed value is referred to as the p-value of the test. The R-squared reported in the table is adjusted R-squared that can serve as a measure of the quality of the model if the number of explanatory variables is greater than 1 (It is the proportion of the variance for a dependent variable that’s explained by the independent variables in a regression model). It recognizes the percentage of variation of the dependent variable.
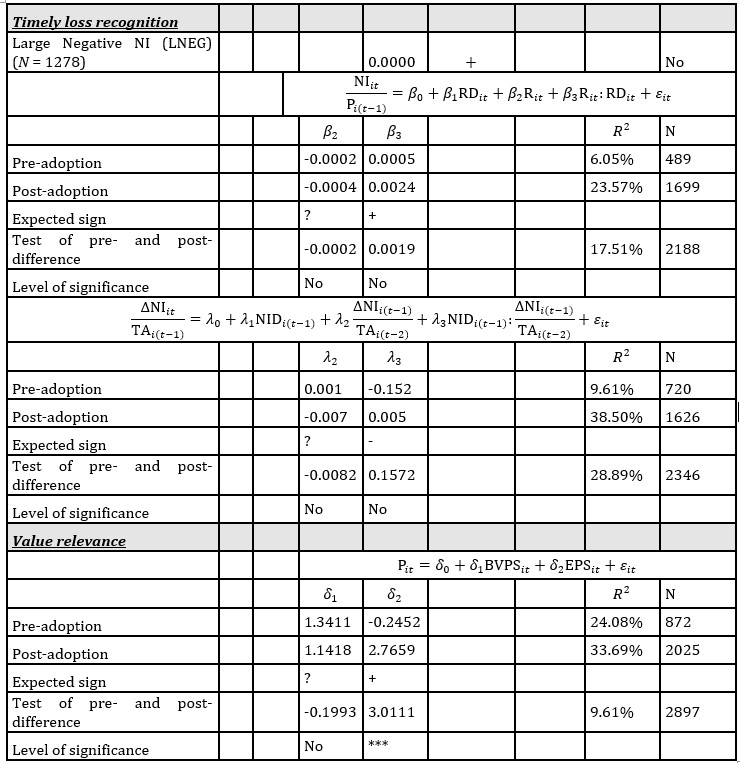
Table 9: Timely loss recognition and value relevance as the determinants of the quality of financial statements
Source: Own elaboration based on research for the years 2004-2019.
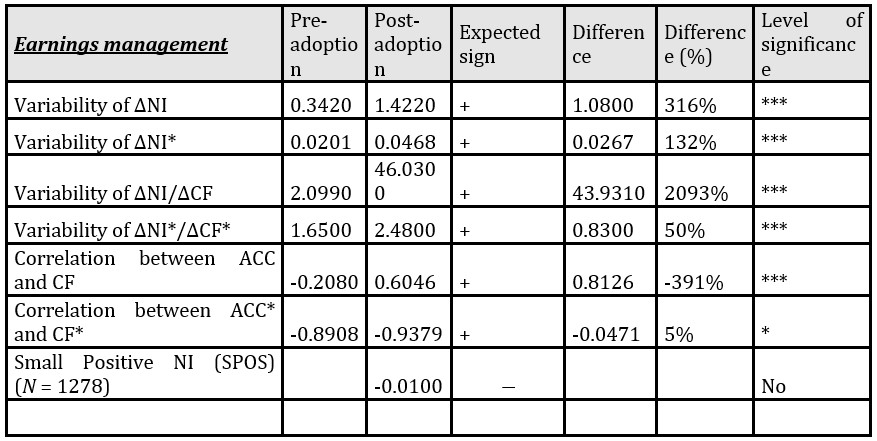
Table 9a: Earnings management as the determinants of the quality of financial statements
Source: Piechocka-Kałużna, 2020
Based on a previous study by the author of this article regarding the quality of financial reporting in the field of earnings management (Table 9a, as cited in Piechocka-Kałużna, 2020), it was concluded that the variability of earnings after the adoption of IFRS was higher than before the adoption of these standards. This is interpreted as a reduction in earnings management, which is a phenomenon that should be interpreted as an increased quality of financial statements. The studies conducted at that time also indicate that increased variability of earnings is accompanied by increased variability of cash flows, which reinforces the belief that it is an outcome of adopting IFRS, and not of, for example, a change in the methods of operation in the analyzed companies. Subsequent results of the aforementioned studies also indicate that a negative correlation between accruals and operating cash flows in periods before implementing IFRS changed into a positive correlation, which also confirms the belief that the adoption of international standards had a positive effect on the quality of financial statements
With regard to the current studies which focus on timely loss recognition and value relevance (tab. 9), their results also reveal the partially positive effect of implementing IFRS on the quality of financial reporting. The coefficient on LNEG in model [1] is slightly positive; therefore one is rather not allowed to make any conclusions about recognizing losses on a timely basis. However, the incremental timeliness of “bad news” about companies in financial statements, represented by β3 in model [2], increased significantly in post-adoption periods in comparison to periods before using IFRS. That in turn suggests more timely loss recognition. Conversely, the result of the persistence of losses represented by λ3 (from model [3]) has not corroborated the above-mentioned conclusion. Finally, the outcomes of the value relevance analysis proved the significant increase of that quality measure, as δ2 (calculated in model [4]) changed significantly in post-adoption periods at 1‰ significance level.
The results of the study, conducted on a group of Polish companies listed on the stock exchange, which transferred to IFRS regulations, are therefore partially consistent with a previous study conducted by the author, described in another article. They demonstrate that IFRS standards are better than Polish local regulations (in terms of the quality of financial statement), but the difference is negligible and downright symbolic. Therefore, if these changes are not so substantial, the interpretation that can be proposed is that domestic regulations (in line with the Polish local Accounting Act) can also be considered as high-quality standards.
Alexander D., Jermakowicz E. (2006),‘A True and Fair View of the Principles/ Rules Debate’, ABACUS, Vol. 42, No. 2, p. 154.
Armstrong Ch. S., Barth M. E., JagolinzerA. D., Riedl E. J. (2010),‘Marketreaction to the adoption of IFRS in Europe’,The Accounting Review, January, 85(1), 31–61.
Ashbaugh H., Pincus M.(2001),’Domestic Accounting Standards, International Accounting Standards, and the Predictability of Earnings’,Journal of Accounting Research, 39(3), pp. 417–434.
Ball R., Robin A., Wu J.S. (2003),‘Incentives versus standards: Properties of accounting income in four East Asian countries’,Journal of Accounting and Economics, 36(1-3), 235-270.
Ball R., Shivakumar L. (2005),‘Earnings quality in UK private firms: Comparative loss recognition timeliness’,Journal of Accounting and Economics, 39(1), 83-128.
Barth M.E., Landesman W.R., Lang M.H.(2008),‘International Accounting Standards and Accounting Quality’, Journal of Accounting Research, Vol. 46, No. 3, p. 475, 482, 467-498).
Basu S. (1997),‘The conservatism principle and the asymmetric timeliness of earnings’,Journal of Accounting and Economics, 24(1), 3-37.
Breiman L., Friedman J.H., Stone C., Olshen R. (1984),‘Classification and Regression Trees’, CRC press.
Burgstahler D., DichevI.(1997),‘Earnings management to avoid earnings decreases and losses’, Journal of Accounting and Economics, 24, p. 107.
Chen T., Guestrin C. (2016),‘XGBoost: A Scalable Tree Boosting System’, In 22nd SIGKDD Conference on Knowledge Discovery and Data Mining.
Chen H., Tang Q., Jiang Y., Lin Z.(2010),‘The Role of International Financial Reporting Standards in Accounting Quality: Evidence from the European Union’,Journal of International Financial Management and Accounting,Vol. 21, Issue 3.
Christensen H.B., Lee E., Walker M., Zeng C.(2015),‘Incentives or Standards: What Determines Accounting Quality Changes around IFRS Adoption?’,European Accounting Review, Vol. 24, p. 38, 40, 41.
Daske, H., Hail L., Leuz C., Verdi R. (2007), ‘Adopting a Label: Heterogeneity in theEconomic Consequences of IFRS Adoptions’, Working Paper, Goethe University ofFrankfurt, University of Pennsylvania, University of Chicago, and MIT.
Dechow P., Ge W., Schrand C. (2010),‘Understanding earnings quality: A review of the proxies, their determinants and consequences’,Journal of Accounting and Economics, 50, p. 355.
Ding, Y., Su, X. (2008),‘Implementation of IFRS in a regulated market’,Journal of Accounting and Public Policy, 27(6), 474–479.
Eccher E., Healy P. (2003),‘The role of international accounting standards intransitional economies: a Study of the People’s Republic of China’, Workingpaper, Massachusetts Institute of Technology.
Efron B. (1982),‘The jackknife, the bootstrap, and other resampling plans’, Philadelphia: Pa. Society for Industrial and Applied Mathematics.
Fritz S.,Lämmle C. (2003),‘The international harmonisation process of accountingstandards’, International Master Program Strategy and Culture, 3.
(2016),‘A Case Study of True and Fair View Override in Financial Reporting’, Nang Yan Business Journal (v. 5 no. 1), p. 14.
Hribar P., Kravet T., Wilson R. (2014),‘A new measure of accounting quality’,Review of Accounting Studies, 19(1), 506–538.
Isidro H., Raonic I. (2012),‘Firm incentives, institutional complexity, and thequality of “harmonized” accounting numbers’,The International Journal ofAccounting, 47(4), 407–436.
Kim J., Shi H. (2007),‘International Financial Reporting Standards, Institutional Infrastructuresand Costs of Equity Capital Around the World’, Working Paper, Concordia University and Hong Kong Polytechnic University.
Lang M., Smith Raedy J., Wilson W. (2006),‘Earnings management and cross listing: Are reconciled earnings comparable to US earnings?’,Journal of Accounting and Economics, 42, p. 261.
(2003), ‘IAS versus US GAAP: Information-asymmetry Based Evidence from Germany’sNew Market’, Journal of Accounting Research, 41(3) pp. 445–472.
Leuz C., Nanda D., Wysocki P. (2003),‘Earnings management and investorprotection: an international comparison’,Journal of Financial Economics,69, 505–527.
,Verrecchia R.(2000), ‘The Economic Consequences of Increased Disclosure’,Journal of Accounting Research, 38(Suppl.), pp. 91–124.
Morais A. I.,Curto J. D. (2008),‘Accounting quality and the adoption ofIASB standards – Portuguese evidence’, contab. finanç. [online]. 19(48),103–111.
Piechocka-Kałużna A. (2020),‘Earnings management and the quality of financial statements after the transfer into IFRS. Case of Poland’, Conference Proceedings of 36th IBIMA Conference: 4-5 November 2020, Granada, Spain (ISBN: 978-0-9998551-5-7) in progress.
Piechocka-Kałużna A. (2019),‘Jakość jako determinanta wiarygodności współczesnej sprawozdawczości finansowej w Polsce’, Wydawnictwo CeDeWu.
Rogdaki E., Koutoupis A., RodosthenousM.(2011),‘Ensuring the “True and Fair View Principle” of Banks’ Financial Statements after the Introduction of the Application of IFRS: The Case of Greece’, European Research Studies, volume XIV, Issue (3), p. 20.
Soderstorm N. S., Sun K. J. (2007),‘IFRS adoption and accountingquality: a review’,European Accounting Review, 16(4).
Sun J, Cahan S. F., Emanuel D.(2011), ‘How Would the Mandatory Adoption of IFRS Affect the Earnings Quality of U.S. Firms? Evidence from Cross-Listed Firms in the U.S.’, Accounting Horizons, Vol. 25, No. 4, p. 847.