1AGH University of Krakow, Faculty of Management, Krakow, Poland
2University of Western Macedonia, Department of Accounting and Finance, Campus, Greece
Volume 2025,
Article ID 296180,
Journal of Accounting and Auditing: Research & Practice,
12 pages,
DOI: https://doi.org/10.5171/2025.296180
Received date: 11 April 2025; Accepted date: 5 September 2025; Published date: 25 November 2025
Academic Editor: Patrycja Kokot-Stępień
Cite this Article as:
Malgorzata BIALAS and Simeon KARAFOLAS (2025), " Macroeconomic and Other Factors Contributing to the Emergence of Non-performing Loans: An Analysis of Five EU Countries ", Journal of Accounting and Auditing: Research & Practice, Vol. 2025 (2025), Article ID 296180, https://doi.org/10.5171/2025.296180
The global financial crisis of 2008 caused significant problems, primarily in the financial sector, particularly in banks. One of the most serious consequences was the substantial increase in non-performing loans (NPLs). In some countries, the financial crisis evolved into severe economic and social turmoil, prompting states to resort to special borrowing through the EU and the IMF, which in turn exacerbated the crisis. This article examines the evolution of NPLs across five European countries with distinct characteristics. First, two Eurozone countries that were forced to borrow from the EU and the IMF were Greece and Cyprus. Then, another Eurozone country, France, which did not suffer similar borrowing, and two countries outside the Eurozone, the United Kingdom and Poland. Do the evolution of NPLs have any similarities between the categories of these countries? What factors influenced the evolution of NPLs? This examination spans the period from 2008 to 2023. This study is the first to compare NPLs by distinguishing these specific categories of countries and therefore acquires particular importance in the relevant bibliography. To carry out the study, the evolution of NPLs among the five countries was examined. The study then examines the extent to which macroeconomic factors, such as GDP, public consumption, and unemployment, are related. The study finds that Greece and Cyprus, which entered EU and IMF lending programs, have the highest NPL ratios. There is a strong correlation between NPLs, unemployment, and public consumption, but not with GDP.
Keywords: bank, non-performing-loan, NPL, crisis
Introduction
The banking system plays a significant role in the financial system of every economy (Carmona, Climent, Momparler, 2019). This applies to both developed and developing countries (Aluko and Ajayi, 2018; Dia et al., 2020). Thanks to the credit and deposit activities conducted by banks, capital can flow from entities with excess to entities with demand. This favours the financing of consumption and investment (Yuksel and Zengin, 2017) and, consequently, affects the economic development of a given country (Asaah et al., 2019). The share of the banking system, considering credit institutions, in the Euro Area had a decline after the 2008 crisis passing from almost half of the total financial system assets at around one third on the decade of 2020, mainly because of the growth of the share of Non-bank financial institutions (NBFI) especially during the first decade that followed the 2008 crisis, (see ECB Committee on Financial Integration, 2024).
After the financial crisis that began in 2007 in the United States, legislators and banking supervisors in many countries began paying increased attention to the early recognition of losses on granted loans and to the need for greater disclosure in financial statements.
Non-performing loans (NPLs) are loans for which the borrower has not repaid the amounts due in accordance with the contractual terms. However, there is no single universally accepted definition of NPLs. The term is defined differently for accounting and financial reporting purposes than for prudential or supervisory purposes. Regardless of the specific definition used, it is widely recognized that a high share of NPLs in total loans is a common characteristic of major banking and economic crises. Therefore, the appropriate definition, identification of causes, valuation, and mitigation of their effects are crucial issues for central banks and financial supervisors in every country.
This paper presents an analysis aimed at identifying the main factors contributing to the increase in NPLs in total loan portfolios. The analysis is based on a review of the literature and on case studies of Cyprus and Greece. These two Eurozone countries were chosen because they experienced a severe economic crisis in the 2010s due to the economic reconstruction programs imposed by their lenders, the EU and the IMF. The recourse to these lenders was a consequence of the inability to access international markets to finance their public debt (see, for Cyprus, Karafolas and Kleanthous, 2019, and European Commission, 2016; for Greece, Karafolas, 2017, Karafolas, 2019a, Karafolas and Stergiou, 2023). The examination of the two countries will be conducted in comparison with three other European countries, one of which, France, belongs to the Eurozone, as does Cyprus, which is also in the Eurozone. In contrast, the other two do not belong to the Eurozone: Poland, and the United Kingdom, which also left the EU at the end of January 2020. The data from 2008 to 2023 were analysed across the crisis and post-crisis periods, as well as the COVID-19 pandemic.
The subject of this research paper is to examine the underlying reasons for the emergence of a high NPL share in total loans. The literature presents findings from numerous studies examining macroeconomic determinants of NPL growth—such as public debt, unemployment rates, interest rates, exchange rates, and GDP dynamics. According to the authors of this paper, however, factors beyond the macroeconomic environment may also play an essential role in the increase of NPLs. Consequently, the following research hypotheses were put forward:
An increase in unemployment should be positively correlated with an increase in NPLs due to the deterioration in the economic condition of businesses, and especially households.
The reduction in government consumption would positively influence NPL growth by reducing the government’s disposable income available to businesses and households.
GDP growth should slow NPL growth as the economic situation improves.
However, examining these hypotheses could help determine whether the impact on NPL growth is due to macroeconomic factors.
To verify the hypotheses, the share of NPLs in total loans in the banking system for selected countries will be analyzed.
Non-performing Loans (NPLs) Definition
Generally speaking, non-performing loans (NPLs) are loans for which the borrower has failed to make payments for more than 90 days, in violation of the terms of the contract. Loans may also be classified as NPLs if the expected recoverable amount is lower than the loan’s carrying amount at origination. Once the debtor resumes making payments, the loan may be reclassified as a performing loan, even if all arrears have not yet been fully repaid. In this sense, NPLs are loans that are either in default or close to default (Cortavarria et al., 2000).
When a bank classifies a loan as non-performing, it must recognize loan loss provisions (LLPs). The amount of LLP equals the difference between the contractual cash flows the borrower originally agreed to pay and the bank’s current best estimate of the amount it expects to recover. In some countries, the value of these provisions is presented separately on a line below the gross value of loans on the balance sheet. In others, provisions are deducted directly from the loan amount and reported on the balance sheet on a net basis. In such cases, separate disclosure of the provision amount is necessary so that users of the financial statements can adequately assess the bank’s credit risk exposure.
Recognizing LLPs reduces the bank’s equity, as provisions are charged against earnings. In extreme situations, losses arising from provisions may erode equity below the minimum levels required by banking regulators, potentially leading to bank insolvency. Consequently, bank management may have an incentive to minimize the amount of provisions recognized, particularly when the bank is already in a financially vulnerable position (Bialas, 2022).
Research has shown that some banks used the creation of loan loss provisions (LLPs) to smooth earnings. By building so-called “hidden reserves” banks reduced income in the current period to increase it in subsequent periods, thereby offsetting other losses and presenting more stable results to shareholders (Billings and Capie, 2009). Similar conclusions were reached by Higson (2012), who examined companies—including banks—undergoing management changes. He observed that in the first year after new management takes over, firms often create excessive provisions, which can then be released in later years to demonstrate an apparent improvement in financial performance.
The concept of NPLs is closely linked to IAS 39 Financial Instruments: Recognition and Measurement, which classifies loans into two categories:
Performing loans, which included both healthy loans and those with incurred but not reported losses (IBNR), and
Loans with objective evidence of impairment, commonly referred to as the NPL portfolio.
Under IAS 39, two methods were used to calculate write-offs (i.e., to create provisions):
Group (statistical) method, applied to:
performing loans, including those with incurred but unidentified losses (IBNR write-offs), and
loans with impairment indicators that were below the materiality threshold (often called the collective method).
Individual method, applied when:
the borrower’s exposure exceeded the materiality threshold, and
objective evidence of impairment was identified.
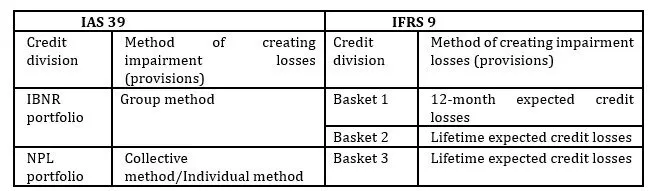
However, with the adoption of IFRS 9 Financial Instruments on 1 January 2018, the classification of loans changed significantly. The previous distinction between a healthy portfolio (IBNR) and an impaired portfolio (NPL) was replaced by a new model based on three stages (baskets) of credit risk.
Under IFRS 9, the former healthy IBNR portfolio was divided into two stages (baskets), while the third basket corresponds to the impaired/NPL portfolio. Conceptually, Stage 1 does not differ significantly from the previous IBNR portfolio. Stage 2, however, falls between Stages 1 and 3. It includes loans for which credit risk has increased substantially, but for which no objective evidence of impairment has yet been identified.
In accordance with IFRS 9, banks continue to apply both the group (collective) and individual methods when recognising impairment. However, the collective method has undergone a fundamental transformation because IFRS 9 introduces new definitions for the risk parameters used in the expected credit loss (ECL) model. Expected credit losses are now calculated either over the next 12 months or over the life of the loan, depending on the stage of the exposure.
The differences between IAS 39 and IFRS 9 with respect to loan classification and the methods of recognising impairment charges are presented in Table 1.
Table 1: The main differences between IAS 39 and IFRS 9
Source: Authors’ own study
It turns out, however, that the definition of NPL is neither universal nor as straightforward as it may initially seem. In addition to the accounting definition discussed earlier, there is also a prudential (supervisory) definition of non-performing loans. This prudential definition is generally broader than the accounting definition. Unfortunately, the two terms are often used interchangeably, leading to confusion and inconsistent interpretation.
Moreover, beyond these overarching frameworks, individual countries introduce their own specific regulations regarding the classification and recognition of NPLs. For example, the timing of impairment recognition may vary across jurisdictions. These discrepancies make it difficult to reliably compare asset quality across banks operating in different regulatory environments.
Therefore, when the term NPL is used in financial statements, it is essential that banks provide a clear and precise definition of the concept. Such transparency enables users of financial statements to properly understand and interpret the information presented.
Factors and Consequences of NPLs Growth
Banks are exposed to numerous risks during their operations. The most significant of these is credit risk, understood as the risk that a borrower will fail to repay the loan in the agreed amount and within the time specified in the loan contract (Bialas, 2022). In practice, this may result in a potential loss of the funds lent, arising from various causes—such as borrower default—which adversely affects the quality of the loan portfolio (Moudud-Ul-Huq, Akter, Biswas, 2020).
The quality of a bank’s overall loan portfolio may be influenced by a wide range of factors, which the literature groups in different ways. Macroeconomic factors can affect a bank’s loan portfolio, as noted by several authors (see, for example, Kjosevski et al., 2019; Karafolas & Ktenidou, 2019; Ahmed et al., 2021; Loang, Ahmad, Naveenan, 2023). Other classifications distinguish between internal and external factors (Dewi and Suhartono, 2021; Prastowo and Usman, 2021; Sovana, Hasanuddin and Rusliati, 2021) or between micro- and macroeconomic factors (Messai and Jouini, 2013; Leka et al., 2019). According to Klein (2013), macroeconomic factors tend to be more critical than bank-specific factors, likely because the overall economic environment directly affects borrowers’ financial condition and thus their ability to repay loans on time.
Several studies have examined the macroeconomic determinants of NPLs in Poland. Głogowski (2008) identified GDP dynamics, changes in the real interest rate, and the unemployment rate as key factors affecting NPLs between 1996 and 2006. Later research by Wdowiński (2014) demonstrated that the exchange rate also influenced NPL levels in Poland during 1997–2013.
Similarly, Louzis, Vouldis and Metaxas (2012), studying NPL determinants in Greece, found that between 2003 and 2009 the most influential factors were GDP dynamics, interest rates, unemployment, and public debt.
Research conducted by Erdinç and Abazi (2014) across 20 European countries for the period 2000–2011 identified GDP dynamics, inflation, and banking sector profitability as significant determinants of NPLs. Makri, Tsagkanos and Bellas (2014), analysing eurozone countries from 2000 to 2008, highlighted public debt, unemployment, and GDP dynamics as the most relevant factors. Other authors, such as Anastasiou, Louri and Tsionas (2016) and Tanasković and Jandrić (2015), confirmed the significance of these macroeconomic determinants.
Excessive growth in bank lending relative to deposits—often referred to as a credit boom—tends to increase the proportion of non-performing loans (NPLs) and frequently precedes banking crises. Moreover, rising NPL levels constitute a significant obstacle to economic recovery, as highlighted by Davis and Karim (2008), Demirgüç-Kunt and Detragiache (2005), and Borio and Lowe (2002).
A rapid increase in NPLs is detrimental not only to banks but also to society. As the volume of NPLs rises, banks’ financing costs increase, and they often seek to pass these costs on to firms and households. In extreme scenarios, a substantial surge in NPLs can lead to bank insolvency, resulting in systemic consequences for the entire banking sector.
According to Minsky’s financial instability hypothesis (1986), many banking crises stem from banks’ pursuit of higher profits, which leads them to loosen credit standards. Minsky argues that, at a particular stage, the only way for banks to continue expanding their assets is to accept a deterioration in asset quality. At this point, the banking system shifts from cash-flow-based lending, where credit decisions are grounded in the expected cash flow of the financed investment, to collateral-based lending, where loans are granted primarily based on collateral value—essentially turning the system into what Minsky likens to a pawnshop. In such circumstances, asset quality becomes highly vulnerable to declines in the market value of the underlying collateral.
Analysis of the Share of NPLs in Total Loans in Selected Countries
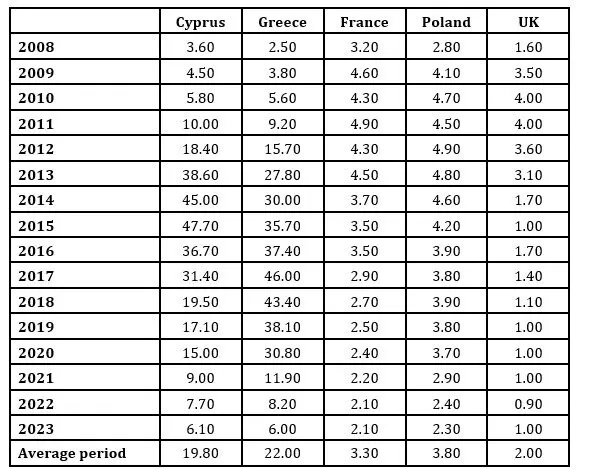
The study covered data from 5 countries, namely: Cyprus, France, Greece, Poland, and the United Kingdom. The years from 2008 to 2023 were analysed. As a first step, the analysis examined the share of NPLs in total loans in each of the selected countries. The results are presented in Table 2.
As can be seen from the above chart, for most of the analysed countries, the share of NPL loans in total loans in the years 2009-2023 was similar, i.e., within the range of 0.8% to 4.9% of total loans. Even this indicator for the United Kingdom was at a level comparable to those of other countries in 2009. Only the share of NPLs loans in total loans for Cyprus and Greece differed significantly from different countries.
Among the countries examined, we can distinguish two cases: Greece and Cyprus, which exhibit a high rate of NPLs, and the three other countries, France, the UK, and Poland, which show a low rate of NPLs. In the first two countries that suffered from the economic reconstruction program in the 2010s, the average NPLs ratio for the entire period is 22% and 19.8% respectively. In contrast, the corresponding average NPL ratio for the same period is 2.0% for the UK, 3.3% for France, and 3.8% for Poland (Table 2. For Greece and Cyprus, the NPLs ratio increases significantly in the 2010s and decreases drastically in the 2020s. As shown in Table 2, the increase in NPLs starts earlier in Cyprus, already at the beginning of the decade, reaching 38.6% in 2013, while it reaches its highest level in 2015, with 47.7% of NPLs in total loans. Correspondingly, however, the drastic reduction in NPLs occurs at the end of the decade, falling to 19.5% in 2018. In contrast, in Greece, the drastic increase in NPLs occurs in the middle of the decade, reaching 35.7% in 2015 and 46% in 2017. The drastic reduction shows a delay, falling to 11.9% in 2021 (Table 2); the decline is the consequence of economic improvement, but also of the sale of bad loans to the specialized Credit Servicing Firm (Karafolas et al., 2024). In the three other countries, the slight increase in NPLs occurred in 2009, with no noticeable increase until the early years of the 2010s. From 2012 onward, the percentage of NPLs in total loans in their banking system appears to have fallen. We therefore conclude that there is a differentiation between the two countries that were forced to resort to borrowing from the EU and the IMF by signing the Memorandum of Understanding, which imposed strict fiscal rules with severe economic consequences for these countries. Regarding the period of the COVID-19 pandemic, no differentiation is observed with a rise in NPLs, which means that businesses and households absorbed the crisis with public aid from the EU (for EU countries) and the British government for the UK (Wozniak and Karafolas, 2023).
Table 2: Bank non-performing loans (NPLs) to total gross loans (%)
Source: World Bank, 2025
As can be seen from the above chart, for most of the analysed countries, the share of NPL loans in total loans in the years 2009-2023 was similar, i.e., within the range of 0.8% to 4.9% of total loans. Even this indicator for the United Kingdom was at a level comparable to those of other countries in 2009. Only the share of NPL loans in total loans for Cyprus and Greece differed significantly from those of other countries.
Influence of the Macroeconomic Factors on the Evolution of NPLs
To identify the cause of the observed evolution, three main macroeconomic factors were analysed to illustrate the economic situation in each country: unemployment, government consumption, and GDP evolution. Data are provided by World Bank Development Indicators (World Bank, 2025). We considered the Pearson correlation coefficient (Turney, 2024). The results of the examined factor are as follows.
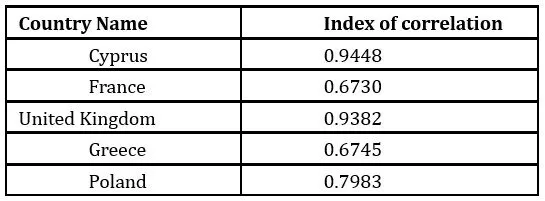
a/ The correlation between NPLs to total gross loans (%) and Unemployment (% of total labour force)
There is a strong correlation between NPLs and unemployment: the higher the unemployment rate, the higher the share of NPLs in total loans. This is evident in all analysed countries, with Pearson correlation coefficients above 0.9 observed in Cyprus and the United Kingdom. In Poland, this indicator was also high, reaching almost 0.8.
Table 3: The corelation between NPLs to total gross loans
(%) and index of unemployment (%)
Source: Authors’ own calculation
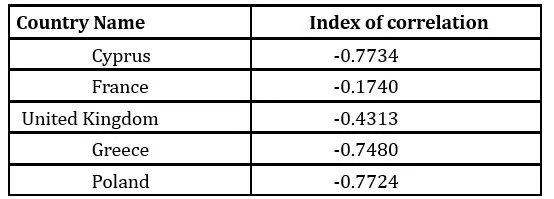
b/ The correlation between NPLs to total gross loans (%) and General government final consumption expenditure (current US$, in MUS$)
The Pearson coefficient indicates that the correlation between the share of NPLs in total loans granted and general government consumer spending is negative in all countries. This means that the higher the general government consumer spending, the lower the share of NPLs in total loans. This is particularly visible in Cyprus, Poland, and Greece (Pearson correlation coefficients above -0.7).
Table 4: The corelation between NPLs to total gross loans (%) and General government final consumption expenditure
Source: Authors’ own calculation
The importance of this factor is also determined by its contribution to each country’s GDP. For Greece, during the period 2008-2023, the average is 21.1%, for France 23.8%, Cyprus 17.6%, Poland 18.3% and the UK 20.4% (World Bank, 2025, authors’ calculations).
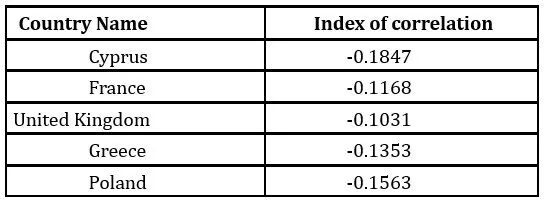
c/ The correlation between NPLs to total gross loans (%) and GDP growth (annual %)
Analysing the correlation between NPLs and GDP growth rates, no correlation is observed across the analysed countries. The Pearson correlation coefficient ranges from -0.18 to 0.14.
Table 5: The corelation between NPLs to total gross loans (%) and GDP growth (annual %)
Source: Authors’ own calculation
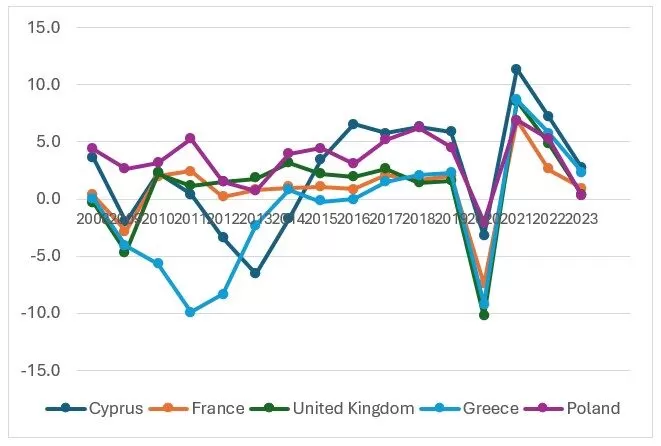
Nevertheless, Figure 1 shows that, especially for Greece and Cyprus, the early 2010s marked a significant drop in GDP, a harbinger of the substantial rise in NPLs. It also shows that the 2020 pandemic affected the economies.
Fig 1: GDP growth (annual %) for selected countries in the years 2008-2023
Source: World Bank 2025
Causes of the Greek and Cyprus Crisis
We can focus on Greece and Cyprus, which experienced very high NPL rates during the 2010s, and examine the reasons behind the crises in these two countries. In both cases, we find common characteristics that stem from the close economic and political relationship between the two countries.
In Greece, the global financial crisis turned into a national economic and social crisis in the 2010s. Greece presented a very high fiscal deficit and substantial public debt relative to its GDP. In 2008 and 2009, Greece’s budget deficit was 10.2% and 15.2%, respectively, while the Eurozone’s deficit was 2.2% and 6.3%, respectively. Regarding public debt to GDP, it was 109.4% in 2008 and 126.7% in 2009, while for the Eurozone it was 69.6% in 2008 and 80.2% in 2009 (Eurostat, 2016). Thus, the Greek government was unable to borrow from international markets, which preferred risk-free investments during the crisis. The result was the EU and IMF intervention in Greece’s public borrowing in 2010 (Karafolas, 2019a). The borrowing led to a strict economic program based on consolidating the central government’s finances, which would subsequently reduce Greece’s borrowing (Bank of Greece, 2014).
The consequences were multiple, including the reduction of government spending and, simultaneously, an increase in taxation. The reduction in state intervention was significant because the Greek economy relied heavily on state support; for example, government consumption accounted for over 20% of GDP. The main consequences were a reduction in GDP, an increase in unemployment, a decline in household income, and a decrease in business activity, particularly in construction and industry (Karafolas and Alexandrakis, 2015). Furthermore, Greek banks were the most exposed to Greek debt. Due to their exposure to Greek debt, they suffered a bond haircut in 2012, resulting in severe losses for the banks (Karafolas, 2017). For the banks, the results were severe on three levels: a significant increase in NPLs; b/ a considerable reduction in the capital adequacy ratio, which led many Greek banks to close. Of those rescued, the four most important ones for the economy that received assistance from the Financial Stability Fund (Karafolas, 2019a); c/ a contraction of the banking network on two levels, i/ a contraction of the network abroad with the sale of subsidiary banks and branches, (Karafolas, 2019b) ii/ acquisitions and mergers of banks with a particular feature being the acquisition by the 4 important banks of the large number of banks that were unable to meet the capital adequacy requirements (Karafolas, and Stergiou, 2023).
The case of Cyprus is primarily linked to Greece’s problems. Cyprus presented an excellent fiscal picture at the end of the 2000s. In 2007 and 2008, Cyprus presented budgetary surpluses of 3.2% and 0.9% of GDP, respectively. In 2009, it recorded a fiscal deficit of 5.5%, putting the country in a much better position than the Eurozone average. The public debt-to-GDP ratio was correspondingly much lower than the required entry threshold for the Eurozone, with figures of 54% in 2007, 45.6% in 2008, and 54.3% in 2009. The Cypriot economy did not suffer serious consequences from the global financial crisis. However, it suffered the consequences of its connection with the Greek economy, particularly the exposure of Cypriot banks to the Greek economy and of Greek banks to the Cypriot banking market. Cypriot banks had significant exposure to Greek bonds. When it became clear that the Greek government could not meet its obligations, Cypriot banks found themselves on the verge of bankruptcy. However, due to the significant share of the banking sector in Cyprus’s GDP and the resulting high systemic risk, the bankruptcy of any large bank in Cyprus would pose a threat to financial and economic stability. Thanks to the liberalization of trade and financial markets, Cyprus became an attractive place for investment (low corporate taxes, high tax-free amounts, and zero capital gains tax)—many entities invested in Cyprus (mainly Russians) by placing their capital in banks. As a result, the banks’ total balance sheet exceeded seven times annual GDP. At the same time, the banking system itself was concentrated in three banks with low capitalization (Bank of Cyprus, Popular Bank, Hellenic Bank). These banks invested their deposits in Greek government bonds and in loans to Greek companies. As a result, the crisis in Greece led to an increase in the outstanding loans held by Greek companies in Cypriot banks. It should also be noted that all Greek systematic banks, National Bank, Piraeus Bank, Alpha Bank, and Eurobank, as well as the Commercial Bank that was sold to Alpha Bank, had a significant presence in Cyprus (Karafolas, 2019b).
At the same time, Cypriot banks had a significant presence in Greece with the Bank of Cyprus and the Cyprus Popular Bank, which, due to problems, were purchased by Piraeus Bank (Karafolas, 2019a).
At the same time, Cyprus’s accession to the European Union in 2004 and to the Eurozone in 2008, combined with lower interest rates and easier access to credit, led to a credit boom. Credit growth led to higher prices in the real estate market and a sharp rise in private-sector debt (households and non-financial institutions).
Thus, excessive credit expansion and the banking sector’s participation in the banking economy exacerbated problems stemming from exposure to the Greek economy. This caused serious problems with the capital adequacy of Cypriot banks, which, on the one hand, compounded the problem of NPLs, and, on the other hand, NPLs exacerbated the issue of capital insufficiency. Particularly characteristic is the problem of cooperative banks (the most important cooperative banking system in Europe, proportionate to each country’s GDP). Cooperative banks, having on the one hand a significant share of NPLs on their balance sheets and, on the other, an inability to meet the required capital adequacy requirements, were forced to go bankrupt, resulting in the disappearance of the cooperative banking system in Cyprus (Karafolas and Kleanthous, 2019).
Conclusion
Non-performing loans lack a single, standard definition. They are treated differently by accounting rules (IFRS 9) and prudential standards issued by banking supervision in each country. One thing is certain: the increase in NPLs relative to the total amount of loans granted is unfavorable for the banking sector.
The literature review enabled us to identify the relationship between the rise in NPLs and the dynamics of public consumption, unemployment, and GDP.
The sample examined included Cyprus and Greece, two Eurozone countries that entered a public financing program as part of an economic reconstruction effort in the 2010s. The period studied was from 2008 to 2023, including the COVID-19 pandemic crisis. The cases of Greece and Cyprus were compared with those of three other EU countries. These included France (a Eurozone member), Poland (an EU member but not a Eurozone member), and the UK (which left the EU in 2020 and is not part of the Eurozone). The research aimed to examine whether countries in a continuous economic crisis in the 2010s had similar consequences on NPLs compared to countries with different memberships. The answer is that both Greece and Cyprus had the highest NPL ratios, reaching approximately half of the loans in the mid-2010s. In contrast, for the other countries, NPLs did not exceed the normal levels of 4% of total loans. The COVID-19 pandemic does not appear to have had a significant impact on the increase in the NPLs ratio in any of the five countries, as households and businesses benefited from public financing provided by the state and the EU.
The correlation analysis revealed that, across all countries, public consumption and unemployment were most closely linked to NPLs ratios. Decreases in public consumption and increases in unemployment, both of which restrict income, led to higher NPLs ratios. There was no similar correlation with changes in GDP.
This study focused on specific cases to highlight any differences found. Future studies could be expanded to include all EU countries and to consider additional macro- and microeconomic factors.
The research project was financed by the “Initiative of Excellence – Research University” program at AGH
References
Ahmed S., Majeed M.E., Thalassinos E., Thalassinos Y. (2021) ‘The impact of bank specific and macro-economic factors on non-performing loans in the banking sector: evidence from an emerging economy’, Journal of Risk and Financial Management, 14(5), p. 217.
Aluko O.A., Ajayi M.A. (2018) ‘Determinants of banking sector development: evidence from Sub-Saharan African countries’, Borsa Instanbul Review, 18(2), pp. 122–139.
Anastasiou D., Louri H., Tsionas M. (2016) ‘Determinants of non-performing loans: evidence from euro-area countries’, Finance Research Letters, 18, pp.116–119.
Asaah J.A., Yunfei S., Wadei K.A., Nkrumah K.F.A. (2019) ‘Cultural orientations and product innovation in the Ghanaian banking sector’, The Service Industries Journal, 40(7–8), pp. 518–541.
Bialas M. (2022) ‘Impact of the applied accounting principles on the possibility of limiting credit risk by creating special-purpose reserves for loans granted by banks operating in Poland in 2018–2021’ [in:] Entrepreneurship and risk in business activity / ed. Iwaszczuk, Kraków: AGH Publishing House, pp. 97–112. text: https://winntbg.bg.agh.edu.pl/skrypty4/0604/przedsiebiorczosc_097.pdf (accessed: 12 February 2025)
Billings M., Capie F. (2009) ‘Transparency and financial reporting in mid-20th century British banking’ In Accounting Forum, vol. 33, no. 1 Elsevier, pp. 38-53.
Borio C., Lowe P. (2002)‘Assessing the risk of banking crises’ BIS Quarterly Review Q4 pp. 43-54.
Carmona P., Climent F., Momparler A. (2019) ‘Predicting failure in the US banking sector: an extreme gradient boosting approach’, International Review of Economics & Finance, 61, pp. 304–323.
Cortavarria L., Dziobek C., Kanaya A., Song I. (2000) ‘Loan review, provisioning, and macroeconomic linkages’ IMF Working Paper 00/195.
Davis, E. Philip, Karim D. (2008) ‘Comparing early warning systems for banking crises’ Journal of Financial stability 4, No. 2 pp. 89-120.
Demirgüç-Kunt A., Detragiache E. (2005) ‘Cross-country empirical studies of systemic bank distress: a survey’ National Institute Economic Review 192, No. 1 pp. 68-83
Dewi A.T., Suhartono S. (2021) ‘The effect of internal and external factors of non-performing loan at national private commercial banks (go public) in Indonesia from 2016–2020’, Proceeding Book of The 3nd International Conference on Business and Banking Innovations (ICOBBI)
Dia M., Golmohammadi A., Takouda P.M. (2020) ‘Relative efficiency of Canadian banks: a three-stage network bootstrap DEA’, Journal of Risk and Financial Management, 13(4), pp. 1–25
Głogowski A. (2008), ‘Macroeconomic determinants of Polish banks’ loan losses – results of a panel data study’, NBP Working Papers, 53, pp. 1–26.
Higson Ch. (2012), ‘Financial Statements: Economic analysis and interpretation’, Rivington
Karafolas S., Bialas M., Ktenidou P. (2024) ‘IFRS 9, evolution of loans through the three stages: comparative examination using the case of main banks in Greece and Poland’, 16th“Economies of the Balkan and Eastern European Countries EBEEC 2024, 17-19, 2024, Vilnius, Lithuania
Karafolas S., Stergiou V. (2023). ‘Consequences of the Financial Crisis and Capital Adequacy in Greek Banks’, Journal of Financial Risk Management, 12, 4, DOI: 4236/jfrm.2023.124016
Karafolas S. (2019a) ‘Crisis consequences on the structure of the Greek banking system’, Financial Studies, 23(4), pp. 1-20
Karafolas S., Kleanthous A. (2019) ‘Crisis’ consequences on recapitalization and exposure for Cypriot and Greek cooperative banks’, CIRIECEspaña,Revista de Economía Pública, Social y Cooperativa, 96, pp. 5-27. DOI: 10.7203/CIRIEC-E. 96.12974
Karafolas S. (2019b) ‘Greek banks abroad: an historic examination’, in Sykainakis, N, et al. (ed.) “Economic and Financial Challenges for Eastern Europe, Proceedings of the 9th EBBEC Internatinal Confernnce”, Springer, doi.org/10.1007/978-3-030-12169-3
Karafolas S., Ktenidou P. (2019) ‘Non-performing loans in the Greek case: evolution and initiatives in the regulatory framework’, Journal Transition Studies Review 26 (3): pp. 29-41, DOI 10.14665/1614-4007-26-1-001
Karafolas, S. (2017) ‘Credit Risk Management: An Examination on the Basis of Exposures with Risk Weighting in Greek Banks’, Journal of Financial Risk Management, 6, pp. 101-118
Karafolas , Alexandrakis A. (2015) ‘Unemployment effects of the Greek crisis: a regional examination’, Procedia Economics and Finance, 19, pp. 82-90
Kjosevski J., Petkovski M., Naumovska E. (2019) ‘Bank-specific and macroeconomic determinants of non-performing loans in the Republic of Macedonia: comparative analysis of enterprise and household NPL’ Economic Research – Ekonomska istraživanja, 32(1), pp. 1185–1203.
Klein N. (2013) ‘Non-performing loans in CESEE: determinants and impact on macroeconomic performance’, Working Papers, WP/13/72, IMF.
Leka B., Bajrami E., Duci E. (2019) ‘Key macroeconomic drivers on reducing non performing loans in Albania’, Academic Journal of Interdisciplinary Studies, 8(2), p. 88.
Loang O.K., Ahmad Z., Naveenan R.V. (2023), ‘Non-performing loans, macroeconomic and bank-specific variables in Southeast Asia during COVID-19 pandemic’, The Singapore Economic Review, 68(03), pp. 941–961.
Louzis D.P., Vouldis A.T., Metaxas V.L. (2012) ‘Macroeconomic and bank-specific determinants of nonperforming loans in Greece: a comparative study of mortgage, business and consumer loan portfolios’, Journal of Banking and Finance, 36, pp. 1012–1027.
Makri V., Tsagkanos A., Bellas A. (2014) ‘Determinants of non-performing loans: the case of Eurozone’, Panoeconomicus, 61(2), pp. 193–206.
Messai A.S., Jouini F. (2013) ‘Micro and macro determinants of non-performing loans’, International Journal of Economics and Financial Issues, 3(4), pp. 852–860.
Minsky H.P. (1986) ‘Stabilizing the Unstable Economy. New Haven’ Yale University Press.
Moudud-Ul-Huq S., Akter R., Biswas T. (2020) ‘Impact of financial crisis on credit risk: pre- and post- financial crises in an emerging economy’, FIIB Business Review, 9(2), pp. 118–132.
Prastowo W.P.W., Usman H.U.H. (2021) ‘The influence of internal and external factors on NPF and NPL’, AFEBI Economic and Finance Review, 6(1), pp. 37–55.
Sovana A., Hasanuddin T., Rusliati E. (2021) ‘Internal and external factor on non-performing loans and its implications towards profitability’, Jurnal Riset Bisnis dan Manajemen, 14(1), pp. 38–45.
Tanasković S., Jandrić M. (2015) ‘Macroeconomic and institutional determinants of non-performing loans’, Journal of Central Banking Theory and Practice, 1, pp. 47–62.
Wdowiński P. (2014) ‘Makroekonomiczne czynniki ryzyka kredytowego w sektorze bankowym w Polsce’, Gospodarka Narodowa. The Polish Journal of Economics, 272(4), pp. 55–77.
Wozniak M., Karafolas S. (2023) ‘Effectiveness of fiscal stimuli during covid-19: comparative analysis of the USA, Germany, Greece and Poland’, in Bernat, Th., and J. Duda, Business Impacts of Covid-19, International Business, Crisis management and the Global Economy, Routledge, New York, pp. 28-40
Yuksel S., Zengin S. (2017) ‘Influencing factors of Net Interest Margin in Turkish banking sector’, International Journal of Economics and Financial Issues, 7(1), pp. 178–191.