The Bucharest University of Economic Studies, ASE Bucharest, Romania
Volume 2019,
Article ID 908286,
Journal of Administrative Sciences and Technology,
25 pages,
DOI: 10.5171/2019.908286
Received date: 27 March 2017; Accepted date: 12 December 2018; Published date: 30 January 2019
Academic Editor: Nicoleta Acomi
Cite this Article as:
Gabriel Jipa (2019), “The Value of Structured and Unstructured Content Analytics of Employees' Opinion Mining", Journal of Administrative Sciences and Technology, Vol. 2019 (2019), Article ID 908286, DOI: 10.5171/2019.908286
Employees and their knowledge are critical for a company’s success and were extensively covered by literature. Free form of knowledge, as opinions or feedback is analyzed in some companies in order to understand potential areas of improvement or satisfaction. This research focuses on analyzing free format opinions collected with a survey instrument from 586 employees of a bank. Various techniques as text analytics, word embedding, supervised and unsupervised learning were explored, extracting key concepts or entities. Attribution and relational similarity was explored using techniques as supervised text classification or unsupervised, by word vector representation and embedding using word2vdec. The aim was to explain overall satisfaction combining structured data (collected with closed questions survey, using 7 points Likert scale) enhanced with text classification of opinions, related to best and worst applications, along with explanations. The theoretical model used for ontology and taxonomy of text classification was based on Technology Acceptance Model, mapped into the main perceptual constructs, Perceived Ease of Use and Perceived Utility. The scope of research was the banks’ enterprise IT environment, not focused on a specific application. Various quantitative models, including linear models, decision trees and neural nets, were evaluated to capture potential causality of overall employee IT satisfaction level. The results suggest strong influence of perceptual constructs towards satisfaction, within all methods, while unstructured textual data provide additional insights on employees’ perception from concept associations.
Keywords: employee satisfaction, natural language processing, text analytics, unstructured data, technology acceptance model, machine learning, word embedding.
Introduction
This paper is the extended version of the Conference Proceeding paper “Employees opinion mining – value of structured and unstructured content analytics in a bank” (Jipa, 2017b) and introduces unsupervised learning methods to explore the text corpora, to complement supervised classification using text analytics and uses an exploratory approach.
Some organizations operate under strict industry regulatory and compliance requirements, dealing with private or confidential data, as the case for the current research paper. In order to fulfill their job, employees are required to follow strict processes and use mandatory systems (as transactional processing systems, customer management systems, claims) where information systems qualities as speed, performance, usability and user experience are critical for employee satisfaction using IT systems and ability to complete tasks. The conceptual framework of this paper is based on Technology Acceptance Model, also referred to as TAM (Davis, 1986; Venkatesh et al., 2003; Shumaila, Foxall and Pallister, 2010) to explain potential causality and factors that affect the behavioral intention to use or technology adoption. TAM (initial and subsequent versions) was adopted in a broad number of research papers and covered by literature reviews but faced also criticism due to its generalization approach (Hwang, Al-Arabiat and Shin, 2015).
This paper explores the use of natural language processing to classify concepts on predefined categories, based on TAM model as well as detecting concept similarity with unsupervised learning and relevant keywords extracted. Two different approaches were used:
Approach A: Supervised method for multi-class classification, based on predefined rules, functions and dictionary based natural language processing in SPSS TA. Specific dictionary was built for the project.
Approach B: Unsupervised method for similarity check, data driven natural language processing in Python and Gensim using word embedding (vector). Classification, while possible with different methods as Latent Dirichlet Allocation (Alghamdi and Alfalqi, 2015) using Gensim, was not performed as part of this research.
Approach A: TAM factors and modeling was done to derive the conceptual model for text classification using computer software, SPSS Modeler 17 with Text Analytics Module (IBM Knowledge Center – IBM SPSS Modeler V17.0.0 documentation, 2014). Individual sentences were classified in multiple applicable categories (or topics) and computer aided coding was performed using the same scale coding model used for the survey Likert, based on the positive or negative meaning.
Approach B: Alternatively, the free text input (corpus was created based on employees’ feedback) is converted into vectors using word2vec model (Mikolov et al., 2013). The technique creates a very sparse vector using “one-hot word encoding” (1 for the word and 0 for the rest) that feeds a shallow, 3 layers neural network that forces the output to a dimensionality reduction. That allows much efficient computations as well as the possibility to capture information from the word neighborhood. Despite the fact that the model is being applicable to large corpus or datasets, there is no minimum recommendation for corpus size in word embedding model. However giving the small dimension of corpus, limited dictionary and bias was expected. Graphic exploration was done using both plotted dimensionality reduced vector data and SPSS Text Analytics capability. These tools provide researchers with easy to use interfaces for training a model from own corpus or loading a pre-trained one using Python. Word embedding used vectors with 100 dimensions. Data Processing was done in Python 3.5 and NLTK libraries (Bird, Klein and Loper, 2009) . Exploration was done using visual plots or similarity detection using Euclidian or cosine distance. We explore the practical and managerial applications and implications of the modeling techniques using the analytical and machine learning tools. For identifying relationships between vectors we used similarity measurement approach (cosine or Euclidian distance) due to its widely usage and practical applicability (text classification, summarization, information retrieval based on mathematical calculation). Cosine distance measurement means measuring the cosine angle between two vectors and works in sparse vector space (Li and Han, 2013). Alternatively, Euclidian distance measurement is available using Gensim (Rehurek and Sojka, 2010) as root of square differences between the respective coordinates of v1 and v2, where v1 and v2 are vectors in the same space.
Literature Review and Hypothesis Development
A simple search in one of the research portals revealed more than 500.000 publications, papers, books or articles indexed that cover TAM, showing model efficiency and popularity despite the inherent criticism (Hwang, Al-Arabiat and Shin, 2015). TAM considers as critically important the evaluation of two constructs: “Perceived Utility” and “Perceived Ease of Use”. Nevertheless, since its introduction focused on traditional IT platforms, until nowadays, applicable also to m-commerce and e-commerce (Wei and Bin Ismail, 2009; Ha and Stoel, 2009; Heinhuis, 2013; Nikou and Economides, 2017), TAM presents a solid framework to understand complex interactions between technology qualities and utility through the lens of perception, attitude, behavioral factors, proposing high level interaction patterns that we aim to validate with empirical findings also in this paper. TAM originates from general behavioral and psychology research, inspired by TRA Theory of Reasoned Actions (Ajzen and Fishbein, 1980) and also TPB, Theory of Planned Behavior (Ajzen and Fishbein, 1980) and further revised (Ajzen et al., 2002). TAM was used in many papers and research studies and its current or future applicability is also important (Lee, Kozar and Larsen, 2003). Many TAM theory reviews and meta- analysis suggest that this theory is current and valid to use (Elie-Dit-Cosaque, Pallud and Kalika, 2012), presenting broad views on its usability (Marangunić and Granić, 2015). Some authors focused on analyzing the adoption of various specific services, as m-commerce trying to understand what mobilizes users to use or adopt technologies (Hew et al., 2015), e-commerce, banking services (Luarn and Lin, 2005), learning (Lee, 2010) or Internet usage (Shumaila, Foxall and Pallister, 2010). While not performing a critical literature review, the current paper uses a simplified version of TAM for a more generic IT environment, based on initial model to provide a taxonomy of factors, to define variables contributing to constructs as Perceived Easy of Use and Perceived Usefulness (Davis, Bagozzi and Warshaw, 1989a). It is known that banks’ employees cannot use alternative technologies, while operational performance cannot be improved if systems not used (Venkatesh, 2003). Technology brings functional advantages (Rogers, 1995) while in mandatory environments.
The initial model proposed by TAM (Davis, 1986) was followed by subsequent versions or studies, by adding or adapting the base model towards a specific usage and less generalization.
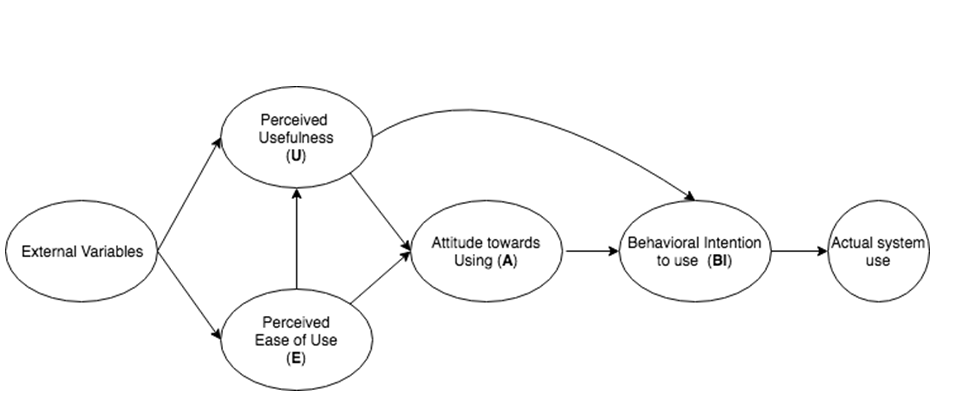
Figure 1: TAM Model, author drawing, adapted from TAM (Davis, Bagozzi and Warshaw, 1989b)
Per TAM, Attitude is directly influenced by Usefulness dimension as well as Easy of use and expressed by formula:
A= U + E; Adapted from (Davis, Bagozzi and Warshaw, 1989a)
Information Systems were examined in several theories (Rogers, 1995) that review the traditional communication theory, Information Diffusion Theory (DIT) about innovation adoption and the adoption process. Other theories as TRA and TPB (mentioned above) maintain contextual, dispositional factors as attitude, personal networks and self-efficiency in adoption and consequently usage of technologies. Key findings in TAM consist in influences or causal direction between perception of Utilitarian and Easiness, influenced by DIT with attitudinal, behavioral intention and behavior itself, influenced by TPB and TRA. Latest integrative theories based on TAM present a unified view (UTAUT) (Venkatesh et al., 2003) extending TAM with a series of elements for better explanation. UTAUT includes also the performance and effort expectancy element, related to individuals’ belief that technology will support self- efficiency towards completion of specific tasks (Venkatesh, 2003). Performance expectancy in IT implies that the user expects the task to be easier and self- efficiency improved (Venkatesh et al., 2003) suggesting the following hypotheses:
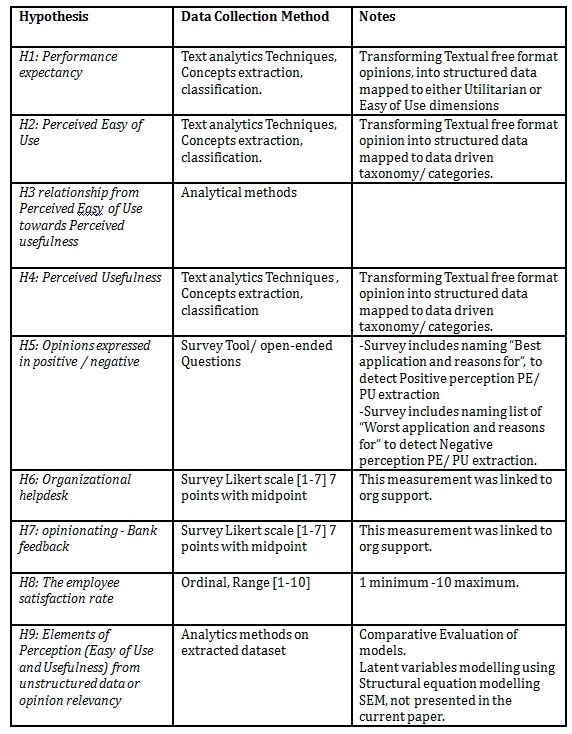
H1: Performance expectancy is influencing opinion (after system usage)
H2: Perceived Easy of Use is positively influencing opinions (after system usage)
H3: There is a relationship from Perceived Easy of Use towards Perceived usefulness
H4: Perceived Usefulness is positively influencing opinions (after system usage)
H5: Opinions expressed in positive / negative statements reflect a mixture of positive / negative Perception on the same analyzed subject.
H6: Organizational helpdesk is significantly contributing towards opinion formation.
H7: Employees trust that opinionating will improve status as a Bank feedback.
H8: The employee satisfaction towards using the entire IT environment can be expressed as a single rank that can be explained by the other factors.
H9: Elements of Perception (Ease of Use and Usefulness) are relevant from unstructured data or opinion narrative in both exploratory and quantitative analysis.
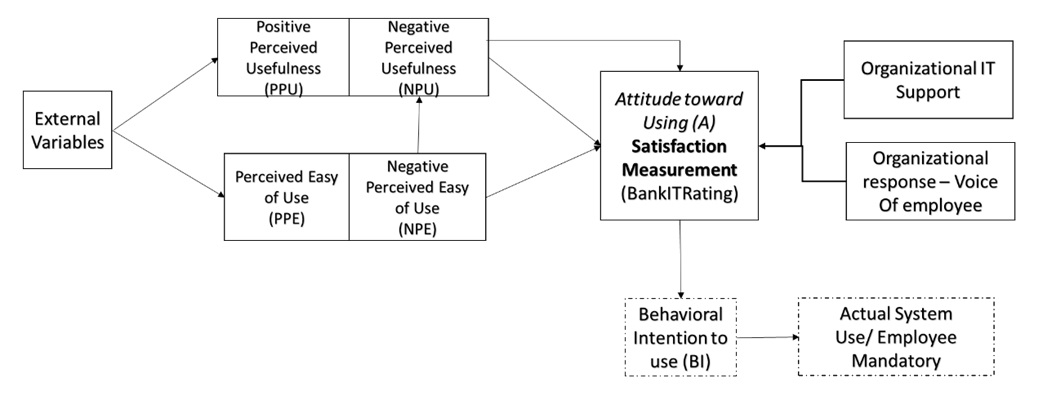
In this bank, usage of Informational systems was mandatory (Venkatesh and Davis, 2000); no manual operations were possible outside Information Systems, so measuring behavior or actual system use was not relevant (Venkatesh and Davis, 2000; Hwang, Al-Arabiat and Shin, 2015) from the research perspective, but attitudinal and employee satisfaction was important. Assumption: The system usage measurement for mandatory systems does not bring additional insight for the research focus. Therefore, a specific model was proposed after the exploratory research, considering both positive and negative conflicting statements stated by the same respondents (evaluation of one core application received from the same respondent during in depth interviews has shown a mixture of negative and positive opinions towards the subject, while improvements were suggested constantly). The main conclusion after exploratory research was hypothesized as Model Assumptions (MA1-MA2) and one Model Hypothesis MH4: MA1: Due to its complexity and interconnection, IT environment should be evaluated overall. MA2: Focusing on application level gives relevant information, applicable to general environment. MH4: The conclusions of analysis should converge, regardless of data collection method.
In other words, the proposed model extracts elements of positive and negative perception utilitarian and easiness evaluation of various IT elements that can be used to explain a generic rate awarded for Banks’ IT environment as a question to express the level of satisfaction (Sowmya and Panchanatham, 2011), along with organizational support (Locke, 1976; Eisenberger et al., 1997; Lee, Lee and Hwang, 2015). Employee satisfaction integration in TAM is a key element in this research (Wixom and Todd, 2005). While parallel research not covered by this paper was conducted only on analysis of data collected in survey format, the two studies are not covering the same quantitative analysis methodology or data set related to TAM constructs.
Figure 2: Proposed model- adaptation from TAM (Davis, Bagozzi and Warshaw, 1989b). Source: Reproduced with permissions from Jipa (2017b).
While a measurement of the influences between PE à PU would help, our goal in this paper is to explain the measured satisfaction rate, confirm and validate the methodology of extracting opinions expressed in free format as open ended answers, classify text data using natural language techniques into features describing Perceived TAM variables and evaluate applicable analytical models. The model evaluates Direct influences (hypothesized H1-H9) on Satisfaction Measurement.
Research Methodology
Qualitative research techniques were used, as described in the specific literature (Becker and Becker, 1996; Patten, 2007; Creswell, 2013). The Exploratory phase consisted in in-depth interviews with a randomly selected group of 30 Individuals. The interviews were conducted in 6 separate locations, with different branch sizes but similar job responsibilities. All interviews notes were transcribed and indexed. Qualitative research or Exploratory research was based on series of Techniques including Text Analysis / Unstructured data mining (Clark, Fox and Lappin, 2010). Consequently, there were considered two types of exploratory analysis, manual coding and text mining. In manual coding, indexing of key concepts was performed based on interview transcripts (Saunders, Lewis and Thornhill, 2008a). Concepts were mapped to categories representative to TAM and research focus, from existing literature, as Perceived expected value, Performance Expectancy (Venkatesh et al., 2003) and Effort Expectancy (Davis, Bagozzi and Warshaw, 1989b). That was used for constructing survey tool, including Organizational support construct. That was treated as a form of trust from the perspective of Attribution Theory (Kelley, 1973), that states that beliefs and person’s cognitive processes should be in agreement, as a result of causal attribution (Krueger, 2007). As such, it was expected that Organizational support construct would have a significant contribution to explaining the result, as formulated by hypothesis H7, H8. In interview transcript, mining approach performed as a parallel semi-automated text analytics approach, using software text classification, parts of speech (POS) identification, concept extraction and type classifications. That was exploratory, aimed to reveal the main factors in a deductive approach. The category classification formed a reduced taxonomy, for building factors influencing positive and negative perception. Interviews were broad, following a semi-structured format, allowing respondents to progressively accommodate with the interview team.
Quantitative Research. The tool for data collection to support quantitative research was survey instrument (Rook, 1985; Patten, 2007), aligned with qualitative research methodology (Creswell, 2013). Survey was broader in data collection, but this paper uses a small set of variables in structured format (related to Hypothesis H6, H7, H8, H9), four categorical variables and one ordinal (Employee satisfaction rate towards entire IT environment).
Target Population definition is critical for business and marketing research (Saunders, Lewis and Thornhill, 2008b). Target Population is defined as client facing individuals, bank’s employee with Teller & Seller Activities in Branch Network. Eligible employees in this Population count approximately 3000 out of 6000 total employees, covering Network Front Office employees in Sales and Service roles, a common pattern, regardless of job role was usage of many applications for job related tasks and direct face to face interaction with the Bank’s customers. Contractors or back-office employees are not part of the target population. Unit of analysis is the individual person and unit if observation is at individual level. Data Collection was performed using survey instrument, with a response rate of 20%. Initial expectancy of responses was about 10% of target population and survey tool (Hox, 2008) was available for two weeks to target population (Saunders, Lewis and Thornhill, 2008a).
Data Collection: Unstructured data used linguistic process resources (Weikum, 2002) adapted to paper research domain (Liddy et al., 2003). Thus, the survey construct included 4 open-ended questions, aiming to collect Best Application if exists and its associated reasons and three worst performing applications with individual reasoning. There was no imposed limitation in the survey tool software package and response was voluntary, however a large participation was registered (Partitioned as 401 valid Training set, machine readable and interpretable responses), representing 70% of survey respondents. Categorical data were collected from respondents regarding seniority, age and job profile to evaluate if any biased perception exists.
Table 1: Data collection method
Source: Reproduced with permissions from Jipa (2017b)
The opinions are often complex and subjective (Mcauley and Yang, 2016), but allow extraction of key concepts or entities, relationship and sentiment toward them (Socher, Perelygin and Wu, 2013). Opinion mining is difficult to perform due to the need of domain adaptation, and is exposed to bias but useful in review mining (Vu et al., 2015), (McAuley and Leskovec, 2013) while being able to offer large amount of information. The model’s initial taxonomy evaluation was created by similarity with qualitative methods, based on TAM; the relevant concepts were identified using extraction capability in SPSS 17.0 Text Analytics package, validated against research purpose in Approach A.
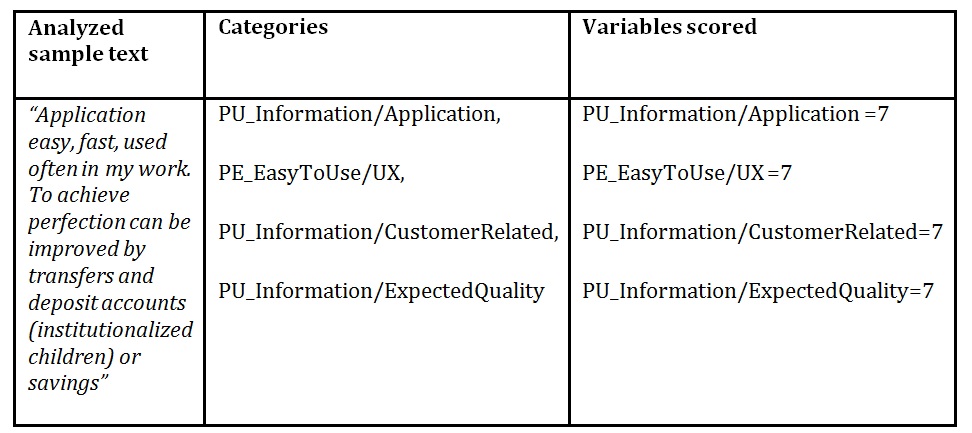
Approach A: SPSS Text Analytics Data Processing: extraction, preparation export in structured format. Software used SPSS Modeler Premium with Text Analytics (TA), SPSS Statistics and MS SharePoint Survey. A specific taxonomy was developed to capture and to map the concepts. Semiautomatic techniques of extracting key data from interview transcripts generated the support for taxonomy creation. A minimum of 50 cases / documents scored against on single potential predictor were looked for. Text extraction aimed to take individual parts of text and performed classification against a research fit categories taxonomy. Unstructured Data aggregation was performed and two linguistic models were prepared and applied as part of domain adaptation step: Negative and Positive views of each TAM constructs– Perceived Utility and Perceived Easy of Use, also presented in research model. The flow is summarized in the following sequence: Concept ExtractionàType Assignment- Category Building based on Typesà Scoring documents à Classifications Flags/ New Variables Creation. To be noticed that Organizational support dimension was identified as category but finally discarded due to the very small number of cases. As suggested by many authors, the way that TAM construct U (Perceived Usefulness) can be regarded as a form of total value a user perceives from technology, while focused on task accomplishments (Venkatesh et al., 2003), as driver for actual system use. After classification step using TA methodology, a set of variables was created specific to each factor. Classification works on a case text field named document and based on linguistic models apply best-fit categories. Thus, a case (phrase or sentence from respondent, one opinion) could explain multiple factors and is classified into multiple categories. As survey instrument included data represented on Liker 7 points scale with 4 as midpoint (Garland, 1991; Boone and Boone, 2012; Sullivan et al., 2013), the classification rule assigns 7 for positive classification and 1 for negative classification, with 4 as midpoint. Concepts extraction was performed for Positive Opinions, with 286 concepts and 28 types that supported Classification (Category extraction based on 80 descriptors) while Negative Opinion generated 674 concepts, 37 types. Technique named Text Link Analysis (TLA) generated a rich source of information of concepts dependencies, providing ontological support as evaluating reasons for scoring the app as “best” gives some insights on inference, but the paper does not focus on that aspect. That processing choice generates structured data that can be analyzed using quantitative techniques, with 586 valid cases (documents in SPSS Modeler TA).
Table 2: Text Classification example – Positive TA linguistic model
Source: Reproduced with permissions from Jipa (2017b)
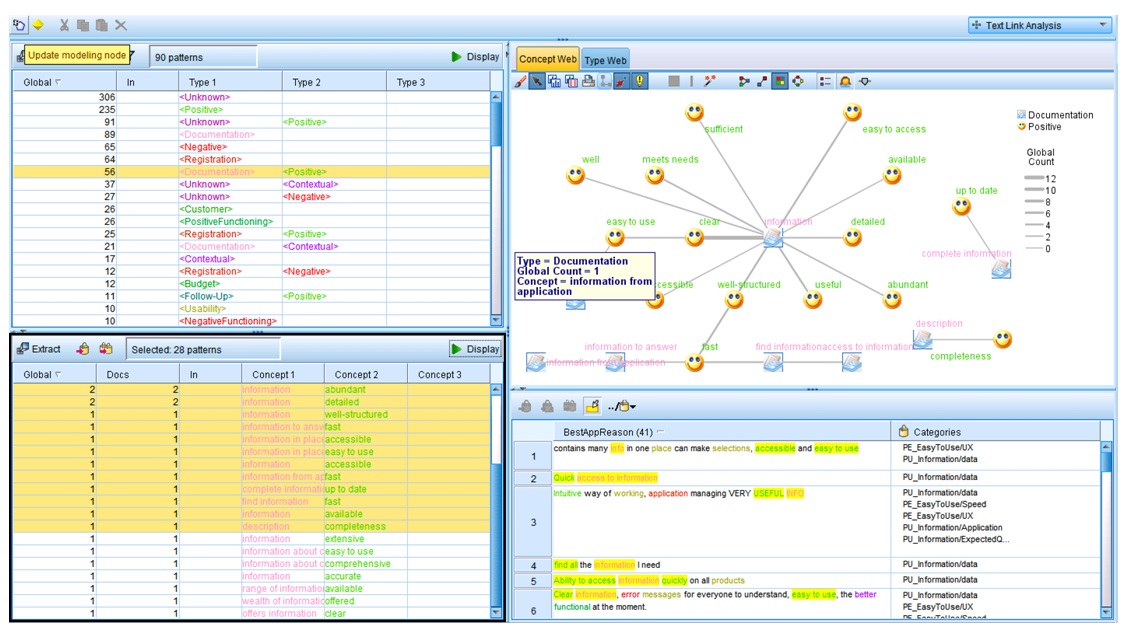
Figure 3: Exploratory Analysis Positive aspects of Concept “Documentation”, Using text analytics methods (Feldman and Sanger, 2007).
Author generated in Text Analytics SPSS, using Text Link Analysis (TLA).
Frequency and count distribution analysis is relevant for understanding the main topic in the corpus.
Fig. 4: Concept count and distribution of topics using supervised classification.
Source: Author generated in SPSS TA.
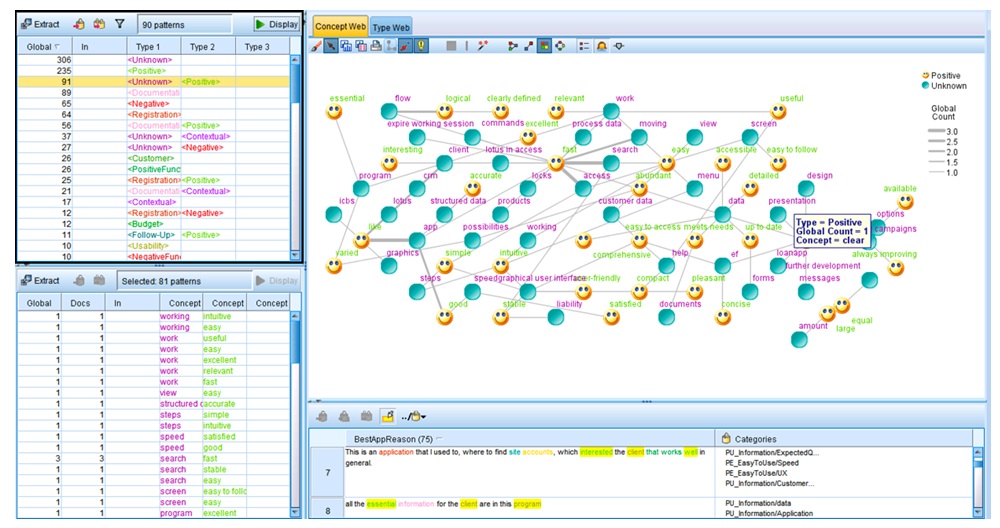
Opinion mining can reveal much useful information, reducing variability when focused on specific subject (Vu et al., 2015), as shown in unstructured data processing from reviews of products, extracting concepts relevant to subject (Chuttur, 2009; Kang and Park, 2014) and can be used to extract insight or perform sentiment analysis against a specific target (Kang and Park, 2014).
Figure 4: Exploratory Analysis of concept web,
Source: Author generated in Text Analytics SPSS, using Link Analysis (TLA).
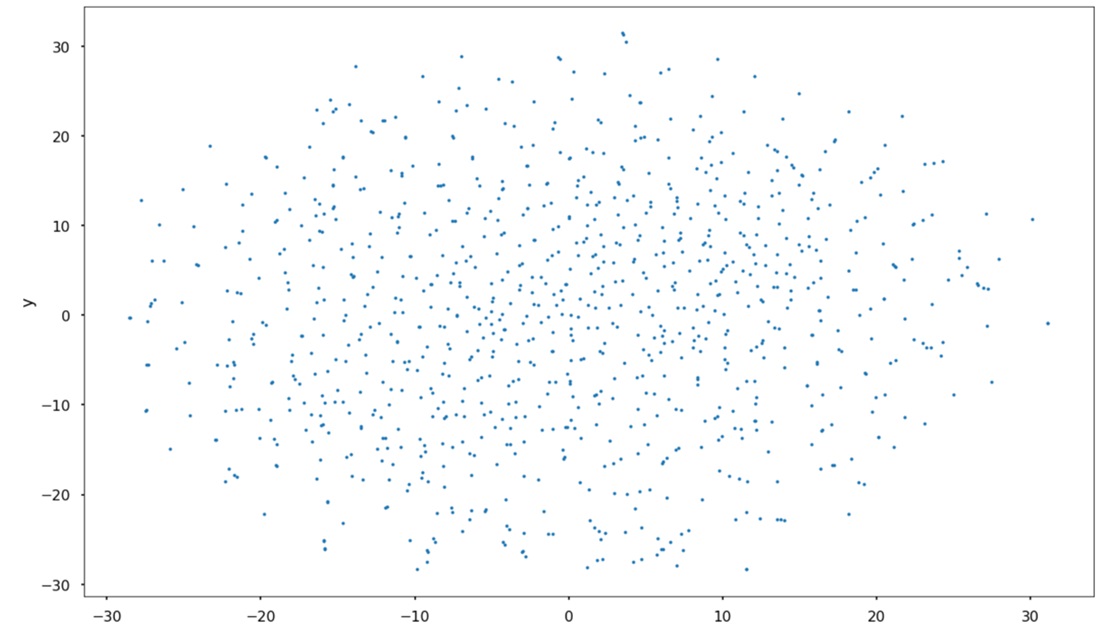
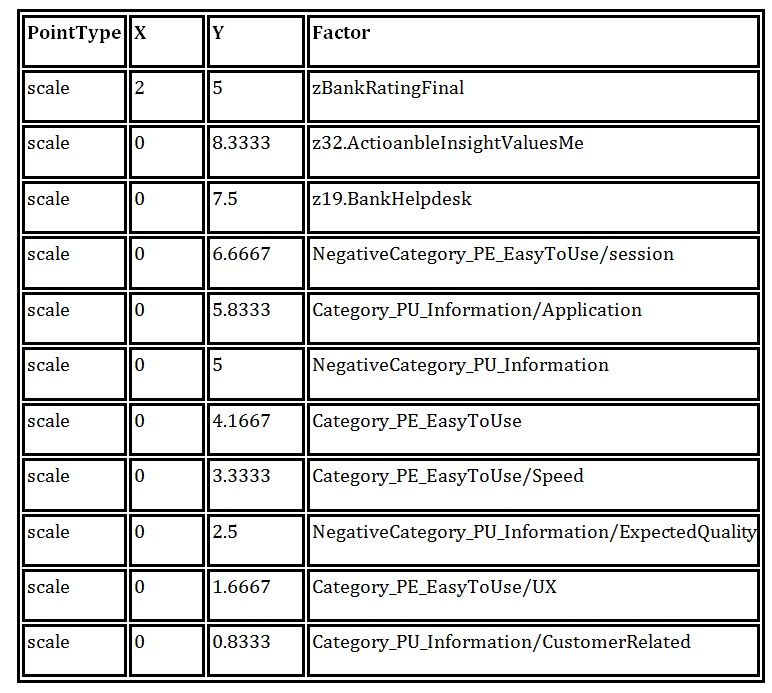
Approach B: Machine learning Text Data Cleaning: minimal manual correction was performed, without typos or spelling and analysis was performed in English language as part of pre-processing, programmatic removal of punctuation, non-English characters or spaces was performed, generating a corpus of 142129 characters and 22460 tokens. The generated word2vec model was trained from custom corpus in a space with dimensions 100. To avoid inclusion of less used words, a minimum word count 3 was selected (at least three occurrences, including the typos). In order to capture the words proximity, the skip-gram model was selected with a window size of 4. The generated word2vec vocabulary length is 956, being very small, and 40 epochs (iterations) of training were selected to improve the model, due to its size and sparse representation. The model was saved to disk for later usage and new data classification (model serving, an economical mode to use trained models in machine learning). Worth noting that a limitation of the word2vec model is that it fails to classify words not present into the corpus, so its generalization capability is reduced. As a result, the corpus is specific to the research problem. For easy visualization, 2-dimension reduction was performed, using TSNE algorithm highly used in visualizing high dimensional data, T-Distributed Stochastic Neighbor Embedding t-SNE (Maaten and Hinton, 2008), but comparable results are encountered using Principal component Analysis PCA methods. For example, the word “simple” is represented as (X = -18.155998, Y= -10.602283) allowing easy visualization.
Fig 5: Trained (sparse) corpus representation using TSNE reduction on XY coordinates space.
Source: Author generated using matplotlib.
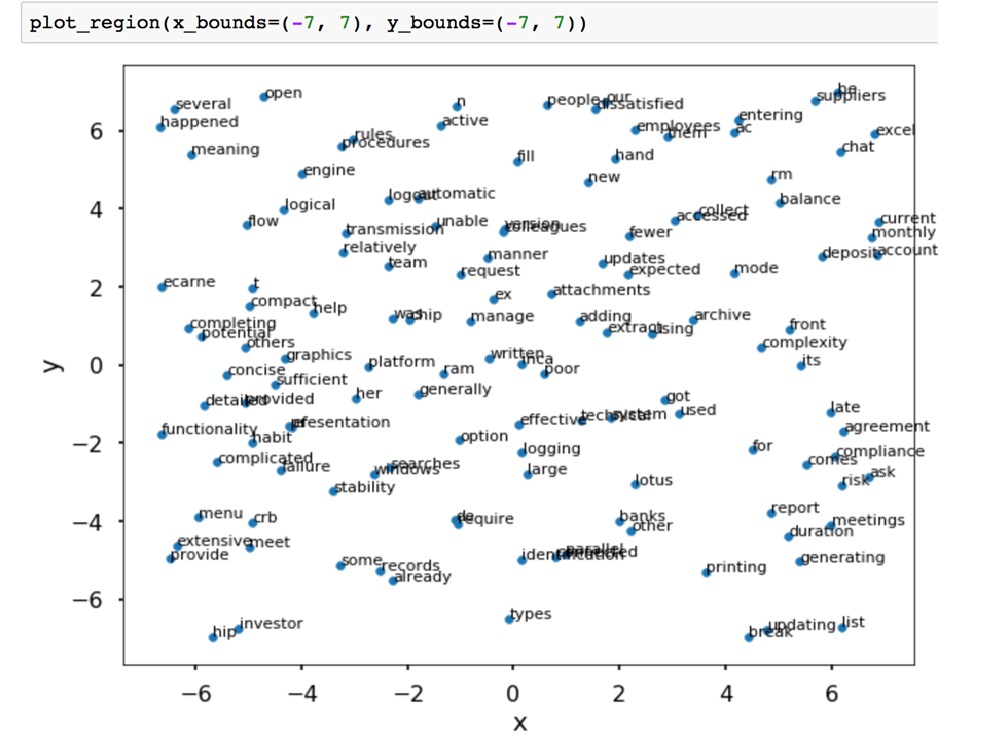
As mentioned, due to the skip-gram model, the word neighborhood is captured in the vector representation. Visual exploration of the corpus can suggest potential term’s relationships, as in Approach A, but without any effort in coding classification.
Fig 6: Zoom into the trained vector space corpus.
Source: Author Generated
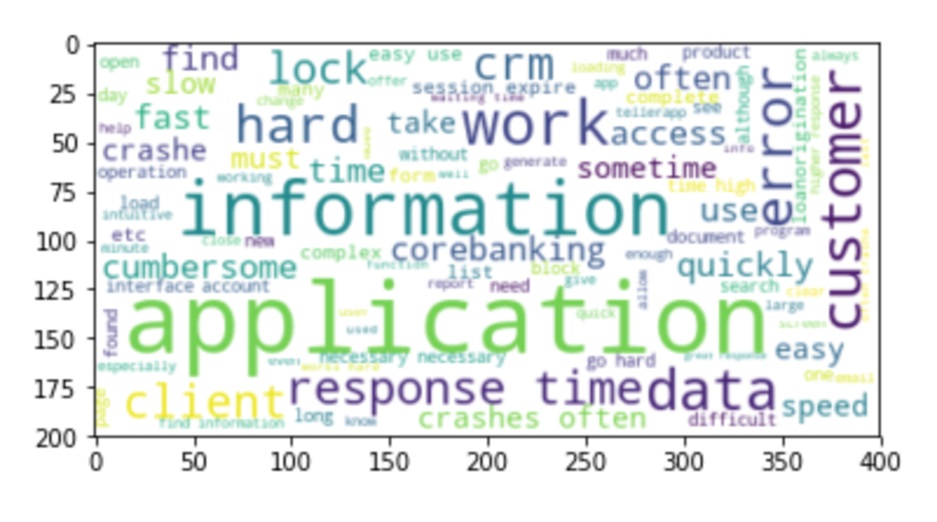
It is noted that terms as [“deposits”, “accounts”, “current” , “monthly”] are very close, while [“balance”] is remote. Similarly [“agreement”, “compliance”, “risk”] are close. The vector representation can be used to predict the next word in a sentence. Isolated grouping of [“some”, ”records”, ”already”] suggests it as well as [“logical”, ’flow”]. A “wordcloud” or tag cloud (Tag cloud, 2018) visualization model was performed, showing similar results with SPSS TA frequency count.
Fig 7: Graph generated from Corpus, showing the highest frequencies.
Source: Author generated in Python, using wordcloud library.
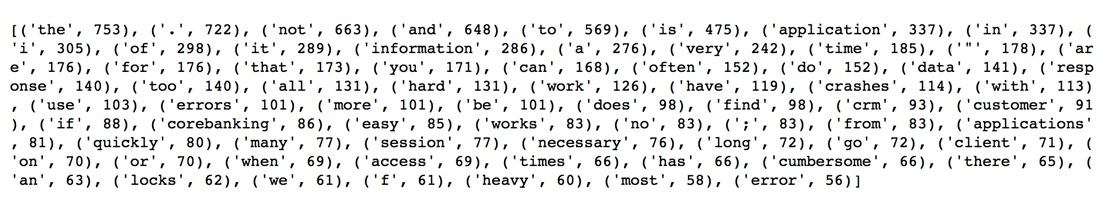
Performing a frequency count without stopwords removal gives comparable result with SPSS TA and Wordcloud method.
Fig 8: Frequency count – Top 70 positions from corpus.
Source: Author generated using python.
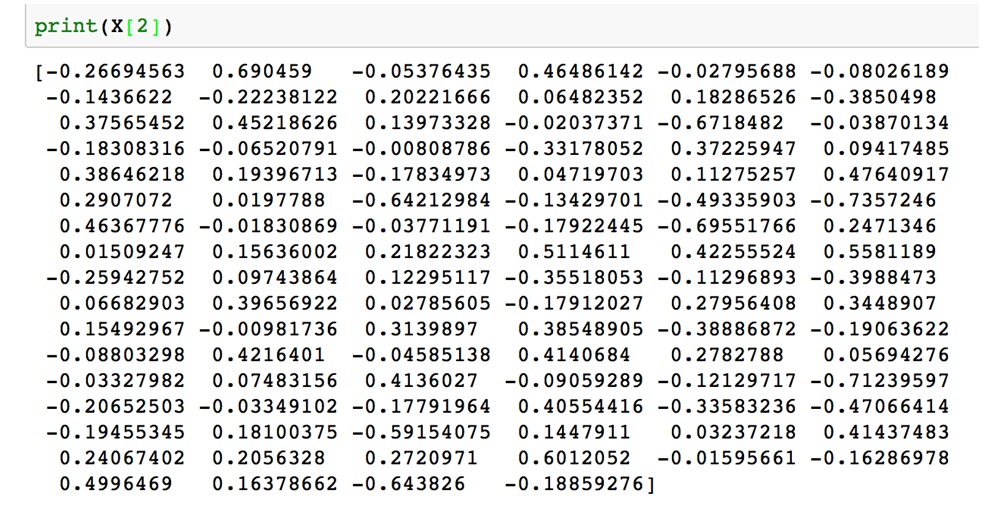
Access to corresponding vectors in the model is done by the use of vocabulary and index. Thus, words are indexed in a list format [‘simple’, ‘types’, ‘navigation’, ‘hand’, ‘them’, ‘da’, ‘transmit’, ‘little’, ’employees’, ‘delogheaza’, ‘weekends’, ‘cash’, ‘function’, ‘balances’, ‘where’, ‘late’, ‘appliance’, ‘manage’, ‘negatively’, ‘friendly’, ‘users’, ‘section’, ‘chapter’, ‘storage’, ‘fill’, ‘some’, ‘respond’, ‘re’, ‘completely’, ‘bushy’, ‘generation’, ‘even’, ‘signature’,….] and corresponding numerical representation is done by specific function based on position in the list. Word “navigation” at [2] index has a 2-dimension representation as (X=-16.755571,Y=-011.034788).
Fig 9: Full vector representation for “navigation” word.
Source: author generated.
Analytics Models evaluation of three analytical models was performed using GLM, Regression, Neural Net and CHAID. Given the linguistic analysis dependencies and limitations (Liddy et al., 2003), the paper aims to: a) Empirically evaluate TAM and formulated hypothesis, compare models based on Lift and gains curves but maintain theory driven approach and b) Evaluate Unstructured only model to explain the Satisfaction rate for Theory confirmation.
Results
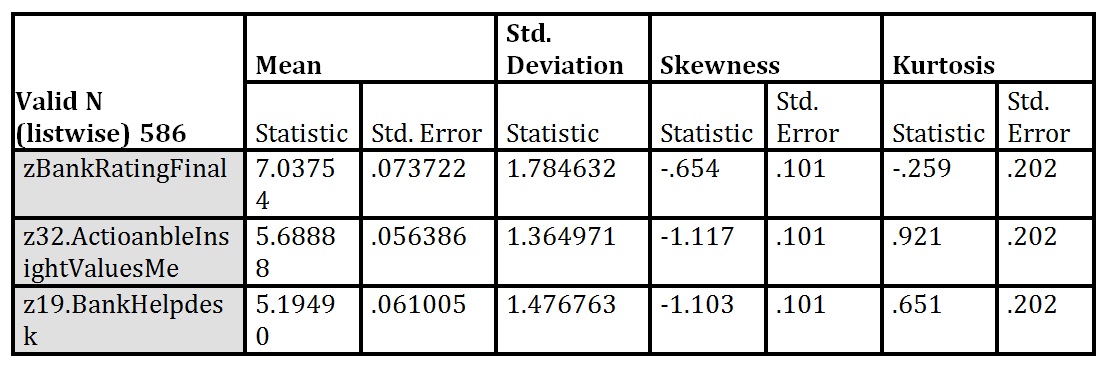
Approach A: The descriptive results of survey are summarized in the table below. It is interesting to note the generated values from unstructured data extraction. Partition was used with allocation 70% (401) labeled 1_Training and 30% (186) labeled 2_Testing, based on random selection from sample. Descriptive Statistics for both Structured data and extracted with Text Analytics table shows deviation and skewness, but this is expected due to positive / negative model generation:
Table 3: Structured variables collected using survey questionnaire
Source: Reproduced with permissions from Jipa (2017b)
Respondent profile: There was no significant variation between seniority, age or job profile collected as categorical data. However, it was noted that senior age employees might consider better ranting, but decision was not to consider that potential bias. Typical requirements of normal distribution of the data -skewness below 0 and kurtosis below 2.5, recommended -2/2 (Trochim and Donnelly, 2006)- are not necessarily met, in concordance with data extraction expectations.
Source: Reproduced with permissions from Jipa (2017b)
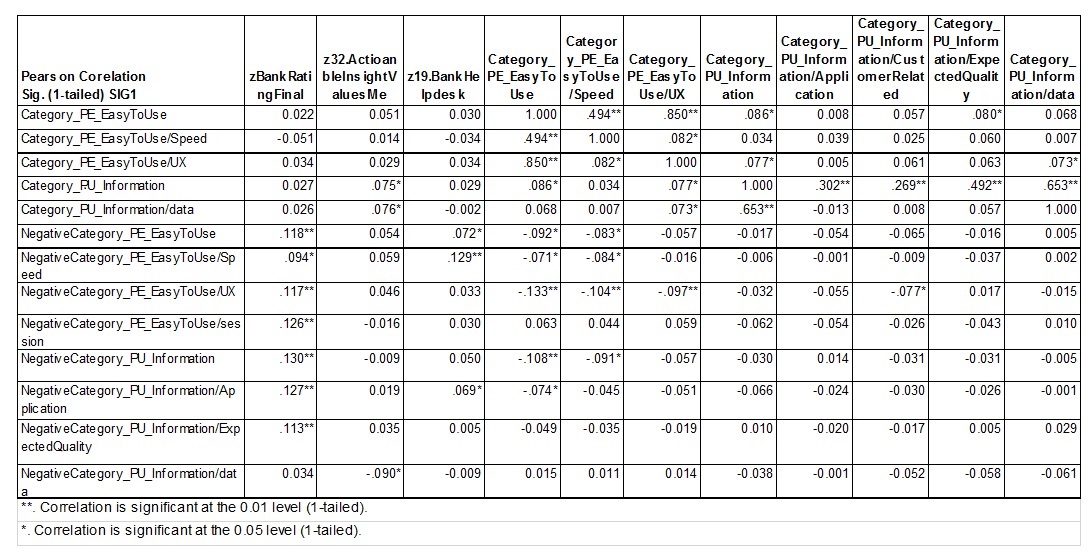
Correlation values show the inverse relationship that was also theoretically deduced from negative and positive opinions. While table extensive, there is potential for further investigating those values and could provide business additional insight relevant to the case.
Figure 4: Correlation (structured and structured-derived form opinion mining- partial screen capture.
Source: Reproduced with permissions from Jipa (2017b)
Target model was evaluated using three scenarios, based on structured and structured data extracted:
Scenario A: Structured Only variables applicable uses Model Target: zBankRatingFinal; Inputs: z32.ActioanbleInsightValuesMe, z19.BankHelpdesk; Applicable models can use Generalized Linear 1 (Correlation 0.412), Neural Net 1 (Correlation 0.409), CHAID 1 (Correlation 0.408)), Linear Regression (Correlation 0.407) and relative error between 0.834 and 0.839. However, this is not bringing real value but points us towards looking to more variables.
Scenario B: Unstructured Only variables applicable, while exploration could use regression or GLM for parameter estimation, CHAID offers a potential empirical confirmation to explain with a correlation of 0.204 and relative error 0.964 the Model Target: zBankRatingFinal. However, while we estimate that training gives a good performance at Percentile 20% (Lift is 1.126 while Best curve is 1.432) considering extracted data, testing performance is weaker at Percentile 20% (Lift is 1.056). Potential improvement could be obtained if we would have a larger data set of opinions or analyses of alternative sources (as Helpdesk communication). Findings are very valuable: we understand that the main segmentation criteria are based on the perception of perceived usefulness of the application where people that choose to award 1 to this perception – minimum (worst) will after that look for information quality issues. That is aligned with Link analysis findings that application is useful and data presented should be trusted. Specific opinions can be traced back in original file as “it loads slowly. most times it does not work at all. weekends app does not transfer data in lists or forms and clients are impatient and dissatisfied.” On the other hand, the Decision Tree analysis shows that 71.32% from training sample primary concerned with Perceived Value being more focused on Perceived Ease of Use factors as User Interface friendliness while remaining 28.68% are after focused on Information quality and Application usefulness.
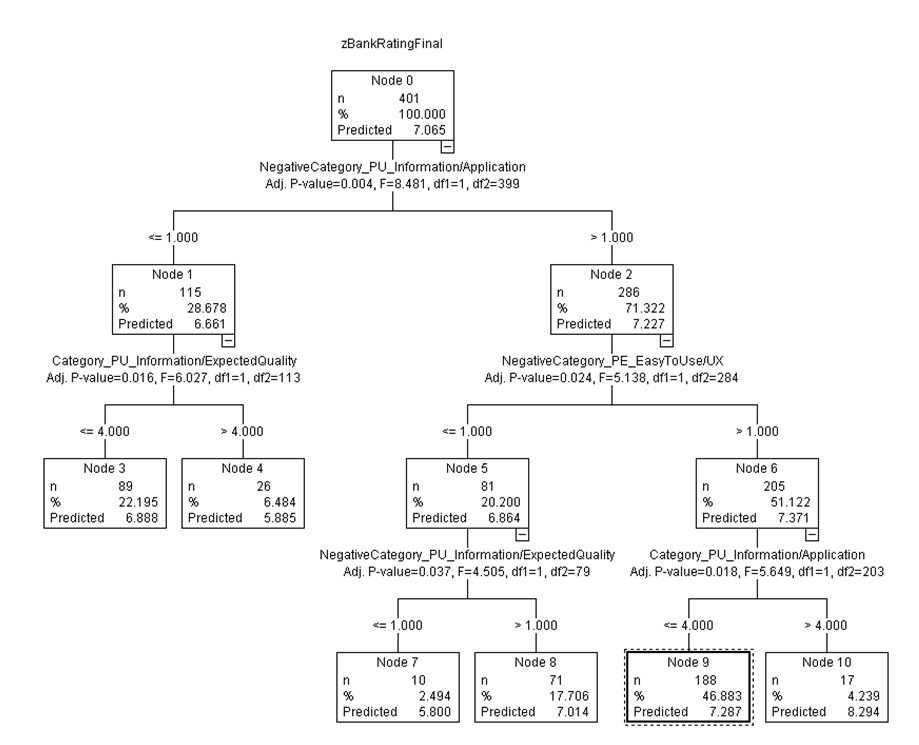
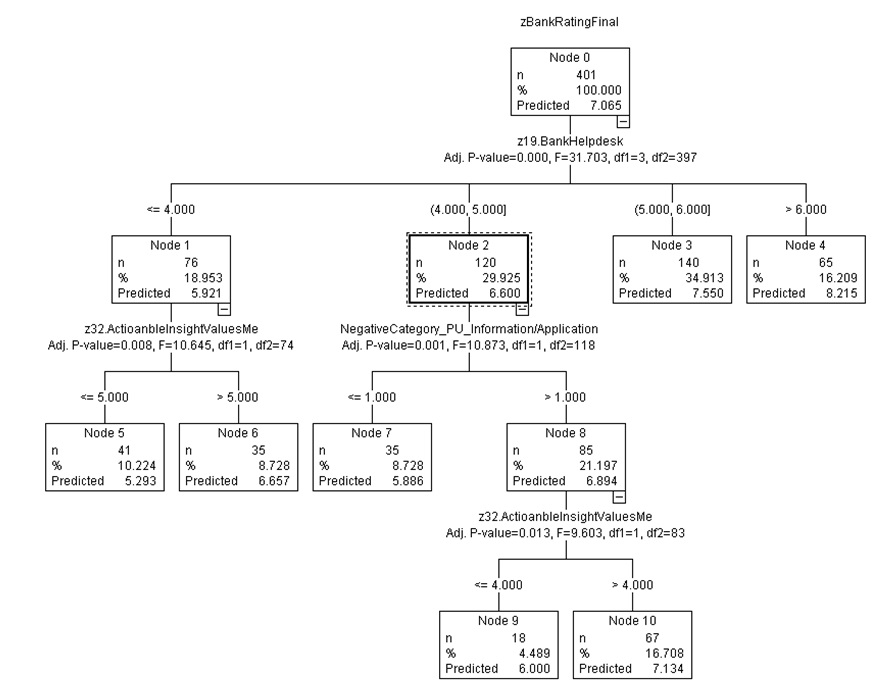
Figure 10: CHAID (Scenario B) representation of Unstructured (Opinion Mining) only modeling.
Source: Reproduced with permissions from Jipa (2017b)
Scenario C: Structured and unstructured variables evaluated applicable models combining both Scenario A and B predictors and the following models were identified as candidates: Regression 1 (18 parameters; Correlation 0.416; Relative Error 0.833); Generalized Linear 1 (18 parameters; Correlation 0.416; Relative Error 0.833); CHAID 1 (3 levels; Correlation 0.423;Relative Error 0.825); Neural Net 1 (18 parameters; Correlation 0.39; Relative Error 0.858), or Regression (Linear 1) with an accuracy of 24,2. Using Regression Linear Model on Training data only, we obtain the following equation, and Correlation: Training: 0.485/ Testing: 0.431
While the model intercept is 2.049, we see the positive contribution of Organizational Trust as contributing significantly with 0.322, Helpdesk contribution 0.414/ unit increase and the Negative contribution, that is expected (if the negative aspect decreases by moving from completely dissatisfied to dissatisfied there is unit increase corresponding to 0.267). It is interesting to note the contribution of these non-obvious TAM factors into result explanation.
A Decision Tree analysis using CHAID model (expanded on three levels) can bring more insights. Decision Tree’s level 1 is split into 4 branches, based on Node 1 values (Helpdesk perception), 4 intervals being identified in the data. Almost 18.9% employees that perceive negative the provided helpdesk support with ratings in the interval of [<4] are grouped into believers and non-believers, split in relative equal groups, based on measurement of attitude that Organization will implement changes based on their feedback, suggesting that there is no dominant a pessimistic and optimistic perception in this cluster. Other important Branch at Node 2 suggests the ambiguity of a group of respondents (120), more than 25% of Training Partition. They are in the interval between midpoint and 5, “somehow satisfied” with the organizational support they receive. This group is further affected by Information quality exposed – they express negative opinion in this regard. Interestingly, this group splits into strong Pessimists and other that might trust that the organization will actively listen to their voice (Node 8 split into Node 9 and 10). Other Level 1 categories of users under Node 3 and 4 will award higher rating, also seen in the descriptive statistics analysis. Decision Tree’s Linear Correlation is 0.505 for the Training partition and 0.423 for Test partition.
Figure 11: CHAID tree based on mixed model.
Source: Reproduced with permissions from Jipa (2017b)
Scenario C Neural Net (Multilayer Perceptron, 6 hidden layers to explain the results) model has accuracy of 24.2% and overfit prevention set of 30%. While in different model, it presents the same results.
Table 4: The Neural Net characteristics- partial extract
Source: Reproduced with permissions from Jipa (2017b)
The Neural network model was performed without partitioning due to the relative small number of cases but presents convergent results with result interpretation. As a guide for evaluation of applicable models, we considered the Gains and Lift curves for the selected model as well as relative error and correlation coefficient for each. As it can be observed, all models provide convergent results.
Approach B:
Full vector space exploration similarity was done using cosine distance measurement model. This aims to uncover potential relationships in the data using no rules, unsupervised learning and listing the closest 5 terms in the vector space we note that expressions as “easy to use ” cannot be constructed as in the case of SPSS TA. Some notes are included with some extracted terms.
• ‘ reason ‘, attribution similarity: Corpus Top5 [(‘ie’,0.696), (‘records’,0.679), (‘lost’,0.633), (’embarrassing’,0.622), (‘wasted’,0.621)]. Interesting link between motivation and lack of efficiency. • ‘ simple ‘, attribution similarity: Corpus Top5 [(‘rapidity’,0.637), (‘menu’,0.632), (‘navigation’,0.620), (‘concise’,0.620), (‘way’,0.614)]. Good indication for user experience. • ‘ dissatisfied ‘, attribution similarity: Corpus Top5 [(‘hangs’,0.772), (‘our’,0.761), (‘filled’,0.751), (‘meetings’,0.729), (‘lists’,0.718)]. Indicates problems with application stability. • ‘ clients ‘, attribution similarity: Corpus Top5 [(‘transfer’,0.710), (‘hangs’,0.709), (‘agencies’,0.706), (‘download’,0.685), (‘dissatisfied’,0.629)]. Interesting finding on client and dissatisfaction, as well as stability issues. • ‘ lock ‘, attribution similarity: Corpus Top5 [(‘exit’,0.677), (‘existing’,0.656), (‘gets’,0.654), (‘stand’,0.641), (‘disconnects’,0.590)] • ‘ app ‘, attribution similarity: Corpus Top5 [(‘ca’,0.682), (‘iar’,0.680), (‘uses’,0.627), (‘favorite’,0.624), (‘exit’,0.614)] • ‘ functionality ‘, attribution similarity: Corpus Top5 [(‘concise’,0.709), (‘design’,0.709), (‘habit’,0.703), (‘graphics’,0.700), (‘idem’,0.698)] • ‘ help ‘, attribution similarity: Corpus Top5 [(‘others’,0.615), (‘useless’,0.606), (‘sufficient’,0.602), (‘colleagues’,0.577), (‘manner’,0.571)] • ‘ value ‘, attribution similarity: Corpus Top5 [(‘added’,0.825), (‘interested’,0.795), (‘database’,0.785), (‘sales’,0.721), (‘ar’,0.720)] • ‘ hard ‘, attribution similarity: Corpus Top5 [(‘goes’,0.605), (‘slowly’,0.600), (‘awful’,0.597), (‘opens’,0.592), (‘pretty’,0.583)] • ‘ time ‘, attribution similarity: Corpus Top5 [(‘wealth’,0.573), (‘salt’,0.555), (‘great’,0.546), (‘waiting’,0.543), (‘listed’,0.543)] • ‘ user ‘, attribution similarity: Corpus Top5 [(‘guide’,0.641), (‘majority’,0.612), (‘searches’,0.593), (‘nafa’,0.591), (‘portal’,0.576)] • ‘ useful ‘, attribution similarity: Corpus Top5 [(‘windows’,0.726), (‘equally’,0.644), (‘written’,0.638), (‘would’,0.631), (‘stability’,0.624)] • ‘ block ‘, attribution similarity: Corpus Top5 [(‘dese’,0.647), (‘happens’,0.640), (‘rapidly’,0.619), (‘sold’,0.614), (‘ea’,0.601)]. Dese means “often”. Also “sold” indicated specific application. • ‘ hard ‘, attribution similarity: Corpus Top5 [(‘goes’,0.605), (‘slowly’,0.600), (‘awful’,0.597), (‘opens’,0.592), (‘pretty’,0.583)] • ‘ value ‘, attribution similarity: Corpus Top5 [(‘added’,0.825), (‘interested’,0.795), (‘database’,0.785), (‘sales’,0.721), (‘ar’,0.720)] • ‘ speed ‘, attribution similarity: Corpus Top5 [(‘low’,0.708), (‘reduced’,0.674), (‘reaction’,0.660), (‘previously’,0.655), (‘rate’,0.649)] • ‘ difficult ‘, attribution similarity: Corpus Top5 [(‘procedure’,0.633), (‘understand’,0.612), (‘learning’,0.581), (‘idem’,0.552), (‘stability’,0.543)] • ‘ cash ‘, attribution similarity: Corpus Top5 [(‘management’,0.799), (‘foreign’,0.731), (‘daily’,0.697), (‘filing’,0.696), (‘deposit’,0.691)] • ‘ cashier ‘, attribution similarity: Corpus Top5 [(‘function’,0.775), (‘exist’,0.774), (‘disconnects’,0.688), (‘provide’,0.686), (‘extensive’,0.676)] • ‘ crashes ‘, attribution similarity: Corpus Top5 [(‘often’,0.638), (‘erroneous’,0.605), (‘expiring’,0.573), (‘happens’,0.557), (‘transmit’,0.557)] • ‘ information ‘, attribution similarity: Corpus Top5 [(‘ef’,0.572), (‘provided’,0.559), (‘sufficient’,0.555), (‘desired’,0.530), (¬,0.522)]
Conclusions and Discussion
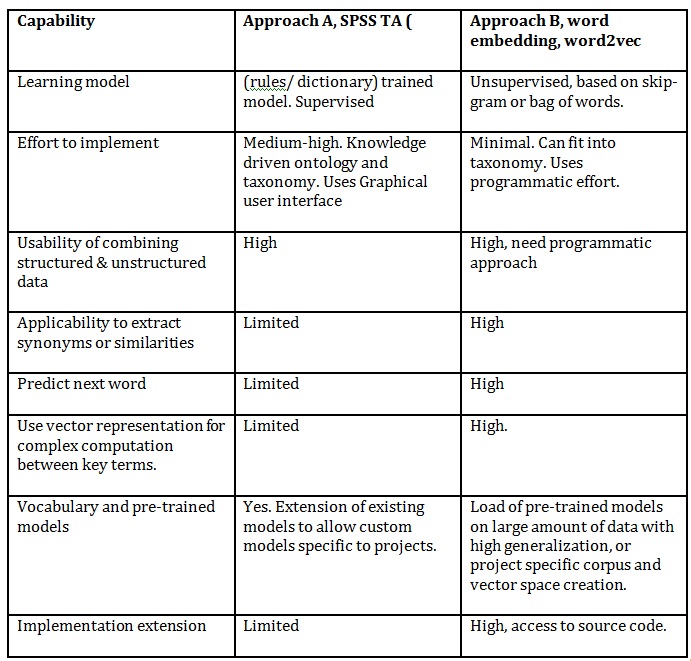
This paper aimed to provide an empirical validation of TAM and organizational factors that might be explained as beliefs in organizational support and feedback. We also acknowledge the effort required in SPSS TA for model building. Approach B in analyzing opinions shows alternate ways to explore opinions. Similar approach can be done to perform text classification, similar with Approach A. The table below summarizes the main findings:
Table 5: Comparison of methods to analyze opinions
As conclusion, both approaches generate structured data from textual data and could serve project specific goals. Similarity exploration gives the researcher the possibility to identify missing data, due to the limitation of survey as instrument (Saunders, Lewis and Thornhill, 2008b).
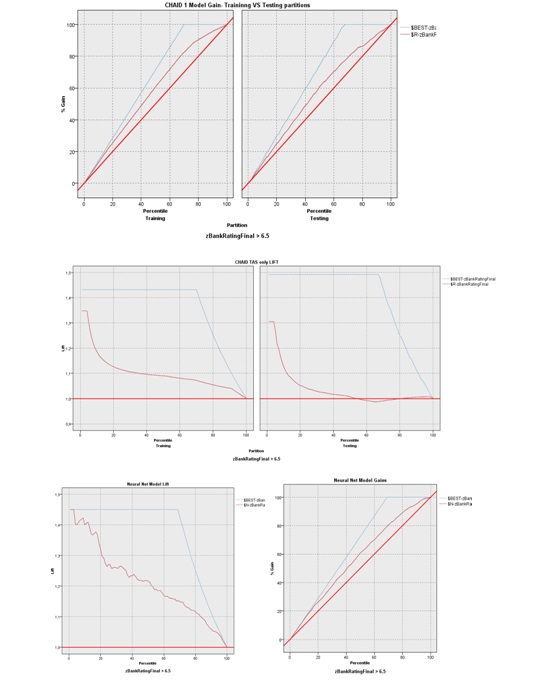
We noticed that in all models this is critically important and significant. In this context by results the entire set of research hypothesis H1-H9 was validated. While analyzing in Scenario C several different models, our aim was explanatory in its effort towards the value of using linguistic models in opinion mining. This source of information is abundant in organizations, and thus not exploited enough due to perceived difficulty in natural language processing and complexity to combine structured data with free format data. We note that people are naturally inclined to associate concepts, in positive or negative attitudinal constructs. It is important to note that full model was based on collecting data in three closed survey questions and 4 open-ended questions. Also, categorical information as job seniority, age or job role, while interesting, was not relevant to the study. That shows that the causal factor is persistent and perceived as such through the organization. Therefore, we appreciate that opinion mining presents a source of value in improving analytics models with proper linguistic models in place, but also brings more reasoning besides the starting hypothesis that can be used to validate also the potential bias induced by survey design and order of questions. Looking and Gains and Lift curves evaluation, we note that convergent scenarios are valuable and can be used for providing empirical validation.
Figure 12: Comparison of models Gain and Lift CHAID and Neural Net.
Source: Reproduced with permissions from Jipa (2017b)
The research results presented that data driven taxonomies, mapped to proven theories can help organizations to better understand problems and deal with disambiguation. In its nature, text analytics (appreciated by many authors) is not an exact science and the effort in domain adaptation could be significant. Additional value comes from potential use in other studies where a potential rating system is in place and feedback is given in the form of user reviews. By using gamification elements, the adoption of this data collection channel can be accelerated and can increase motivation and engagement, like Organizational support z32.ActioanbleInsightValuesMe. We appreciate that further research should use confirmatory analysis techniques for measuring latent variables specific to motivation to share opinion, and TAM constructs. All evaluated scenarios present acceptable values for Lift and Gain curves, for both Training and Test partitions. That suggests that while with larger data set for extraction the statistical significance should improve, this approach brings benefits. The current paper did not evaluate the value of link analysis and concept association in the form of ontologies. Therefore, we consider that Hypothesis H1 and H2 originating from TAM are validated. Correlation values between factors contributing to Perceived Easy of use towards Perceived Usefulness (Information as root category in our model) suggest that models are validated. Negative correlation between Positive and Negative suggests also that conceptual model is valid even if the strength is not as expected (as suggested by pair Category_PE_EasyToUse and NegativeCategory_PU_Information negative Pearson Correlation (direction) of -0.108* or pair Category_PE_EasyToUse and NegativeCategory_PU_Information/Application with negative Pearson Correlation -.074* significant at 0.05 level). H3, H4 and H5 are considered empirically validated based on results’ interpretation. H6, H7 and H8 prove the direct relationship between structured variables, seen in all models– except the TAS only model, which was deliberately excluded. H9 is evaluatively proved, showing that extracting from natural language key is valuable (Jipa, 2017a). We expected that model strength is lower than survey provided measurements but the paper provides empirical validation of relationships per TAM model while indicating ontological insight by link analysis into complex relationships between factors that contribute to perception constructs. Correlation values inside construct factors suggest that a confirmatory analysis can be performed in a future study. Model specific Hypothesis MH4 regarding the converge of conclusions of analysis, regardless of data collection method, is suggested valid by model fit and stability of results within the limit of the current paper and dataset.
Ajzen, I. and Fishbein, M., 1980. Theory Of Reasoned Action / Theory Of Planned Behavior. Social Psychology, 2007, pp.67–98.
Ajzen, I., Fishbein, M., Atomic, I., Agency, E., Federal, T. and Commission, T., 2002. Theory of Reasoned Action / Theory of Planned Behavior. In: Social Psychology. pp.67–98.
Alghamdi, R. and Alfalqi, K., 2015. A Survey of Topic Modeling in Text Mining. International Journal of Advanced Computer Science and Applications, [online] 6(1). Available at: [Accessed 11 Nov. 2018].
Anon 2014. IBM Knowledge Center – IBM SPSS Modeler V17.0.0 documentation. [online] Available at: [Accessed 8 Dec. 2018].
Anon 2018. Tag cloud. In: Wikipedia. [online] Available at: [Accessed 10 Dec. 2018].
Becker, H. and Becker, H.S., 1996. The epistemology of qualitative research. Ethnography and human development: Context and meaning in social inquiry, pp.53–71.
Bird, S., Klein, E. and Loper, E., 2009. Natural Language Processing with Python. [online] Available at: .
Boone, H.N.J. and Boone, D.A., 2012. Analyzing Likert data. Journal of Extension, 50(2), p.30.
Chuttur, M., 2009. Overview of the Technology Acceptance Model: Origins , Developments and Future Directions. Sprouts: Working Papers on Information Systems, 9(2009), pp.1–23.
Clark, A., Fox, C. and Lappin, S., 2010. The Handbook of Computational Linguistics and Natural Language Processing. Blackwell Handbooks in Linguistics, .
Creswell, J.W., 2013. Research Design: Qualitative, Quantitative, and Mixed Methods Approaches. Research design Qualitative quantitative and mixed methods approaches.
Davis, F.D., 1986. A technology acceptance model for empirically testing new end-user information systems: theory and results. Management Science, .
Davis, F.D., Bagozzi, R. and Warshaw, P., 1989a. User acceptance of computer technology: a comparison of two theoretical models. Management Science, 35, pp.181–192.
Davis, F.D., Bagozzi, R.P. and Warshaw, P.R., 1989b. User acceptance of computer technology: a comparison of two theoretical models. Management Science, .
Eisenberger, R., Cummings, J., Armeli, S. and Lynch, P., 1997. Perceived organizational support, discretionary treatment, and job satisfaction. The Journal of applied psychology, 82(5), pp.812–820.
Elie-Dit-Cosaque, C., Pallud, J. and Kalika, M., 2012. The Influence of Individual, Contextual, and Social Factors on Perceived Behavioral Control of Information Technology: A Field Theory Approach. Journal of Management Information Systems, 28(3), pp.201–234.
Feldman, R. and Sanger, J., 2007. The Text Mining Handbook. Imagine.
Garland, R., 1991. The mid-point on a rating scale: Is it desirable? Marketing Bulletin, 2, pp.66–70.
Ha, S. and Stoel, L., 2009. Consumer e-shopping acceptance: Antecedents in a technology acceptance model. Journal of Business Research, 62(5), pp.565–571.
Heinhuis, D., 2013. Title Modeling customer behavior in multichannel service distribution: A rational approach.
Hew, J.-J., Lee, V.-H., Ooi, K.-B. and Wei, J., 2015. What catalyses mobile apps usage intention: an empirical analysis. Industrial Management & Data Systems, 115(7), pp.1269–1291.
Hox, J.J., 2008. International Handbook of Survey Methodology. International Handbook of Survey Methodology, pp.387–402.
Hwang, Y., Al-Arabiat, M. and Shin, D.-H., 2015. Understanding technology acceptance in a mandatory environment: A literature review. Information Development, 31(3), pp.1–18.
Jipa, G., 2017a. Employee It Satisfaction Latent Factors Evaluation Using Technology Acceptance Model in Mandatory. In: V. Dinu, ed., Basiq International Conference: New Trends in Sustainable Business and Consumption 2017. Bucuresti: Editura Ase, pp.354–362.
Jipa, G., 2017b. Employees Opinion Mining: Value of Structured and Unstructured Content Analytics in a Bank. Proceedings of the 29th International Business Information Management Association Conference. Vienna-Austria: Int Business Information Management Assoc-Ibima. ISBN: 978-0-9860419-7-6
Kang, D. and Park, Y., 2014. Review-based measurement of customer satisfaction in mobile service: Sentiment analysis and VIKOR approach. Expert Systems with Applications, 41(4 PART 1), pp.1041–1050.
Kelley, H.H., 1973. The process of causal attribution. American Psychologist, 28(2), pp.107–128.
Krueger, J.I., 2007. Attribution theory. In: Encyclopedia of Social Psychology.
Lee, M.C., 2010. Explaining and predicting users’ continuance intention toward e-learning: An extension of the expectation-confirmation model. Computers and Education, 54(2), pp.506–516.
Lee, Y., Kozar, K. and Larsen, K., 2003. The technology acceptance model: past, present, and future. Communications of the Association for Information System, 12(50), pp.752–780.
Lee, Y., Lee, J. and Hwang, Y., 2015. Relating motivation to information and communication technology acceptance: Self-determination theory perspective. Computers in Human Behavior, 51(PA), pp.418–428.
Li, B. and Han, L., 2013. Distance Weighted Cosine Similarity Measure for Text Classification. In: Proceedings of the 14th International Conference on Intelligent Data Engineering and Automated Learning — IDEAL 2013 – Volume 8206, IDEAL 2013. [online] New York, NY, USA: Springer-Verlag New York, Inc., pp.611–618. Available at: [Accessed 21 Nov. 2018].
Liddy, E.D., Hovy, E., Lin, J., Prager, J., Radev, D., Vanderwende, L. and Weischedel., R., 2003. Natural Language Processing. Encyclopedia of Library and Information Science, pp.2126–2136.
Locke, E.A., 1976. The nature and causes of job satisfaction. In: Handbook of Industrial and Organizational Psychology. pp.1297–1349.
Luarn, P. and Lin, H.-H., 2005. Toward an understanding of the behavioral intention to use mobile banking. Computers in Human Behavior, 21(6), pp.873–891.
Maaten, L. van der and Hinton, G., 2008. Visualizing Data using t-SNE. Journal of Machine Learning Research, 9(Nov), pp.2579–2605.
Marangunić, N. and Granić, A., 2015. Technology acceptance model: a literature review from 1986 to 2013. Universal Access in the Information Society, 14(1), pp.81–95.
McAuley, J. and Leskovec, J., 2013. Hidden factors and hidden topics: understanding rating dimensions with review text. Proceedings of the 7th ACM conference on Recommender systems – RecSys ’13, pp.165–172.
Mcauley, J. and Yang, A., 2016. Addressing Complex and Subjective Product-Related Queries with Customer Reviews. Www, pp.625–635.
Mikolov, T., Chen, K., Corrado, G. and Dean, J., 2013. Efficient Estimation of Word Representations in Vector Space. arXiv:1301.3781 [cs]. [online] Available at: [Accessed 17 Nov. 2018].
Nikou, S.A. and Economides, A.A., 2017. Mobile-Based Assessment: Integrating acceptance and motivational factors into a combined model of Self-Determination Theory and Technology Acceptance. Computers in Human Behavior, 68, pp.83–95.
Patten, M.L., 2007. Qualitative versus Quantitative Research. Understanding research methods: an overview of the essentials, pp.21–23.
Rehurek, R. and Sojka, P., 2010. Software Framework for Topic Modelling with Large Corpora.
Rogers, E.M., 1995. Diffusion of innovations. Macmillian Publishing Co.
Saunders, M., Lewis, P. and Thornhill, A., 2008a. Research Methods for Business Students. Research methods for business students.
Saunders, M., Lewis, P. and Thornhill, A., 2008b. Research Methods for Business Students.
Shumaila, Y., Foxall, G.R. and Pallister, J.G., 2010. Explaining internet banking behavior: Theory of reasoned action, theory of planned behavior, or technology acceptance model? Journal of Applied Social Psychology, 40(5), pp.1172–1202.
Socher, R., Perelygin, A. and Wu, J., 2013. Recursive deep models for semantic compositionality over a sentiment treebank. Proceedings of the …, pp.1631–1642.
Sowmya, K.R. and Panchanatham, N., 2011. Factors influencing job satisfaction of banking sector employees in Chennai, India. Journal of Law and Conflict Resolution, 3(5), pp.76–79.
Sullivan, G.M., Artino, a R., Clason, D.L., Dormody, T.J., Losby, J., Wetmore, A., Boone, H.N.J., Boone, D. a., Lantz, B., University, S.A., Uebersax, J. and Brown, J.D., 2013. Likert scales: dispelling the confusion. Electronic Journal of Business Research Methods, 11(4), pp.1–2.
Trochim, W.M.K. and Donnelly, J.P., 2006. The Research Methods Knowledge Base. WebRef, .
Venkatesh, V., 2003. User Acceptance of Information Technology: Toward a Unified View. MIS Qarterly, 27(3), pp.425–478.
Venkatesh, V. and Davis, 2000. A Theoretical Extension of the Technology Acceptance Model: Four Longitudinal Field Studies. Management Science, 46(2), pp.186–204.
Venkatesh, V., Morris, M., Davis, G. and Davis, F., 2003. User Acceptance of Information Technology: Toward a Unified View. MIS Quarterly, 27(3), pp.425–478.
Vu, P.M., Nguyen, T.T., Pham, H.V. and Nguyen, T.T., 2015. Mining User Opinions in Mobile App Reviews: A Keyword-based Approach.
Wei, O.J. and Bin Ismail, H., 2009. Adoption of Technology among Businesses: The Strategic Adoption. Creating Global Economies through Innovation and Knowledge Management Theory Practice Vols 13, 1(1), pp.27–34.
Weikum, G., 2002. Foundations of statistical natural language processing. ACM SIGMOD Record, 31(3), p.37.
Wixom, B. and Todd, P., 2005. A theoretical integration of user satisfaction and technology acceptance. Information Systems Research, 16(1), pp.85–102.