Mihail BĂRĂNESCU1, Ionel-Sorinel VASILCA2, Madalina TABARCIA3, Nadia CIOCOIU4 and Madlena NEN5
1,2,3,4The Bucharest University of Economic Studies, Bucharest, România
5The Bucharest Military Technical Academy “Ferdinand I” Bucharest, România
Volume 2021,
Article ID 471463,
Journal of Administrative Sciences and Technology,
26 pages,
DOI: 10.5171/2021.471463
Received date: 19 November 2020; Accepted date: 22 January 2021; Published date: 25 May 2021
Academic Editor: Raluca Ignat
Cite this Article as:
Mihail BĂRĂNESCU, Ionel-Sorinel VASILCA, Madalina TABARCIA, Nadia CIOCOIU And Madlena NEN(2021), “ Analysis of Abusive 112 Emergency Calls in Romania ", Journal of Administrative Sciences and Technology, Vol. 2021 (2021), Article ID 471463, DOI: 10.5171/2021.471463
The abusive calls subdivision of the non-emergency calls made to the 112-emergency system represent a concern for the administrators of other such services worldwide, since they generate suboptimal use or even waste of resources. Preventing this scenario requires countermeasures to limit the impact of such calls on the operational performance of handling genuine emergency cases. In this article, the authors intend to propose recommendations for improving the operational performance of the 112-emergency system in Romania. To this purpose, a study focused on the abusive calls generated specifically by adults has been conducted. The study solely included aspects of quantitative analysis, while those arising from qualitative methods will form the subject of a separate article. In the first stage, an analysis of the calls directed to 112 between January 2017 and May 2018 was performed, so as to detect whether there existed any spatial pattern of distribution across the different administrative jurisdictions of Romania. A more detailed analysis of call distribution across months, days and hours was also conducted. Based on this, the analysis was focused on the class of abusive calls generated by adults, with the purpose of subdividing it further into lesser categories such as frivolous, malicious and prank calls. Taking the above steps allowed the administrator of the 112-emergency system to target the right audience in order to reduce the number of abusive calls.
Emergency call numbers such as 911 in America, 112 in Europe and parts of Asia, or 111 in Australia and New Zeeland, are implemented worldwide so as to provide citizens with a single point of contact for reaching first responder agencies (e.g. the Police, Fire Rescue or Medical Emergency Services) whenever they need state authority support related to their personal lives, premises or even their environment.
Having a single number to be dialed in any emergency situation is very convenient and comfortable for a caller under duress because it shortens the intervention time and reduces the impact of crime and other critical matters through a faster emergency service.
The International Telecommunications Union recommends that member states, selecting a primary or secondary emergency number, choose either 911 or 112 or both (ITU, 2008). The 112 systems operated throughout the European Union are managed and financed by each of the member states, who also decide on their implementation models and on the organizational architecture of the emergency call centers. Candidates for EU accession and members of the European Economic Area agreement have also adopted the 112 emergency number.
In Romania, the Special Telecommunications Service is the administrator of the 112 Single National Emergency Call System, as appointed by Government Emergency Ordinance no. 34/2008. At the present time, the 112 system has been running across Romania for approximately 16 years. Throughout its operation, one of the areas consistently marked for improvement by the system administrator has been a reduction in the number of non-emergency calls, which would result in a tangible improvement in the overall quality of the service it delivers to citizens dialing 112.
All emergency services across the world are affected by such false or non-emergency calls. Every time someone dials an emergency number in an unsubstantiated manner – whether deliberately or not – the timely intervention of life-saving services, for those who are in real need, will undoubtedly be affected. In addition to the effect that toll erroneous calls have on the victims of true emergencies, they also cause an important financial burden as well. Every time emergency services respond with an intervention to a false alarm, they are expending valuable tangible and financial resources (Boyle, 2012).
Non-emergency calls made to the 112 system directly contribute to the depreciation of its quality of service and represent a considerable waste of resources. The administrator of the 112 emergency system therefore aims to decrease the volume of non-emergency calls made every year by analyzing their characteristics, such as the callers’ age range, as well as geographical and time distribution.
This research paper aims to discuss a specific category of non-emergency calls, namely those generated by adults in comparison to those generated by children, by exploiting a large volume of data recorded within the emergency system’s archive.
In the first stage, the non-emergency calls addressed to the 112 emergency system between January 2017 and May 2018 were analyzed, in an attempt at identifying any geographical similarities between their patterns of origin.
In the next step, the study was narrowed down to detect if any preferred period of time existed for such incoming calls, focusing the analysis on the period from December 2017 until May 2018. Those six months were selected in such a way as to cover both the winter and spring seasons, which host holidays such as Christmas and New Year’s Eve, as well as the school spring break. Furthermore, that particular period was also chosen in order to cover the naturally higher tonus and willingness to work felt by citizens during the more accommodating spring temperatures. The aim was to detect whether any correlation existed between the abusive calls and their distribution over time, across months, days of the week or even hours of the day. If successful, such an analysis could calibrate the media awareness messages about the scope of the 112 service to reach their intended audience in a more efficient way.
Following that, the authors of this paper went further in their analysis and considered the abusive calls a subclass of non-emergency calls, analyzing its main categories of frivolous, malicious and prank calls. The aim was to better understand their proportion within the larger volume of abusive calls, along with their associated financial impact, so as to devise better countermeasures for reducing the number and duration of these abusive calls.
LiteratureReview
Currently, there exists no standard or uniform definition of what constitutes a false or abusive call, which makes it difficult to compare or aggregate different studies on this matter.
The larger category of false emergency calls includes unintentional false emergency calls (misdials, pocket calls, inappropriate judgement of emergencies, etc.) as well as deliberate emergency calls.
According to Sampson (2004), the problem of misuse and abuse of the 911 emergency number has been broken down into unintentional calls, misdials, hang-up calls, and prank calls. Their study differentiated between the “misuse” and “abuse” of 911, categorizing accidental dialing or multiple reports of the same event differently than those calls that were intentional.
A representative study on false emergency calls was conducted by the European Emergency Number Association (EENA), which included a definition of this type of calls and proposed measures and procedures to deal with such situations.
According to EENA (2011, p. 5), an abusive call represents the event in which a person deliberately contacts the emergency services in a rude or insulting manner toward the public-safety answering point (PSAP) call-taker, without actually reporting an emergency incident.
The concept of false emergency and abusive calls is not always the same across the emergency services employed by European countries (EENA, 2011).
False emergency calls that are made intentionally form the most pressing concern for authorities. There are many instances when citizens call simply as a joke, to be abusive to dispatchers, or simply to ask for information regarding unrelated concerns. Children have been known to call as well while playing with the phone and emergency phone numbers, thinking it is all a matter of fun and games.
In Romania, by false emergency calls, we understand abusive calls, unintentional calls, information calls and silent calls (EENA, 2011, p. 14).
It is worth noting that a search conducted throughout the Web of Science and Scopus databases using keywords such as false emergency calls, single national emergency call system, prank calls, abusive calls, and misuse calls led to an extremely small number of existing publications that corresponded with the scope of the present study.
A similar literature search carried out on Google Scholar using the same keywords also failed to produce multiple results.
Various studies were conducted to analyze how citizens use emergency medical services and to characterize the frequent users of emergency department services (Pines at el., 2011). Other authors tried to identify the factors and reasons that play an important role in the non-urgent use of this type of service (Lee et al., 2000) and to explore socioeconomic and geographical determinants of the inappropriate use of emergency departments (Noura et al., 2019)
Many researches focused on the resources allocated to dealing with non-emergency situations (Rudman, Clarke and Metzl, 2003; Blackstone, Buck, and Hakim, 2007, Honigman et al., 2013), on the characteristics of non-urgent emergency callers (Honigman et al., 2013; Lehm, Andresen and Riddervold, 2016) or the characteristics of frequent users of emergency departments (Afilalo et al., 2004; Milbrett and Halm, 2009).
The study coordinated by Rudman, Clarke and Metzl (2003), under the auspices of the Council of Foreign Relations of the United States of America (USA), showed that responding to false calls made to police, firefighting, and ambulance services formed a significant part of the resource consumption registered by the said departments.
Blackstone, Buck and Hakim (2007) have studied the economics of the emergency response in the USA. Based on previous studies, the authors concluded that false alarms formed 10 to 20% of all calls made to police services, while 94–99% of police responses were to false calls. In terms of costs, the average cost to the police ranges from $60 to $100 per call. Non-valid fire responses represent 58% of all responses at an average cost of $365–$1050 per call, and false ambulance responses comprise 25% of all calls at an average cost of $100 per call (Blackstone, Buck and Hakim, 2007).
Even though globally, there has been a decrease in the number of false calls made to emergency systems throughout the previous years, the issue continues to attract the attention of practitioners and researchers.
The widespread nature of the mobile phone technology has made important contributions to the development of emergency service call centers. Dispatchers believe that the number of calls is on the rise mostly because of the accessibility of the said mobile technology. It has become increasingly easier to dial 911 on a cell phone, and so pocket dials abound. Nowadays, mobile networks are also available almost everywhere to help citizens initiate an emergency call and maintain communication in emergency situations (Landoni, Biselli, Maj and Zangrillo, 2007).
Among the researchers’ concerns is the issue of finding the most efficient measures for reducing the number of these false calls. Legislation dedicated to the fight against abuse in emergency services has thus made no significant contributions so far, so the concern of the specialists in the field has steadily moved toward investigating means of increasing population awareness and employing technical preventive measures.
A more recent study by Blushtein, Siman-Tov and Magnezi (2019) measured the effect of a call tracking technology, developed and implemented by the Israeli emergency system since 2005 for the diminution of harassment calls. The authors performed a statistical analysis based on a retrospective interventional study of all emergency calls made to Israel’s national Emergency Medical Service (EMS) during the years 2012–2016. Their study demonstrated that abusive calls were gradually minimized, and even almost eliminated altogether, without increasing the number of human resources. The above conclusion also provided a confirmation of the fact stipulated by any criminology course on the subject: it is not the value of the penalty fees that discourages abusive calls but rather the probability of having one’s call traced by location and being apprehended by the authorities.
Gomes et al. (2019) analyzed a real data set from an emergency call center from a Brazilian city, in order to evaluate the impact of failures on an emergency call system. They considered service-level metrics such as the number of affected calls per failure and the time an emergency service took until it recovered from a failure. From the authors’ contribution, the cost analysis regarding how different data center architectures can improve the availability of emergency services could be highlighted.
Regarding the most universally used research methods, either the statistical methods or the analysis of conclusions from interviews with dispatchers or patients were noticed.
Naouri et al. (2019) applied a multilevel logistic regression model of determinants of the inappropriate use of emergency departments throughout France.
The conclusions of the study developed by Blushtein, Siman-Tov and Magnezi (2019) were based on a series of statistical calculations made on a large data sample.
Lehm, Andersen and Riddervold (2017) use descriptive statistics on the characteristics of level-E (i.e. not serious) patients who called the emergency medical communication center in the Central Denmark Region from August 2013 to July 2014. This study brought to light new knowledge regarding non-urgent 112 callers and included the capability of following a patient’s course by using their unique civil registration number, as well as other routinely and prospectively collected data.
Honigman, Wiler, Rooks and Ginde (2013) performed a cross-sectional statistical analysis of the 2006-2009 National Hospital Ambulatory Medical Care Survey in the USA and analyzed resource utilization, including diagnostic testing, treatment, and hospitalization within five acuity categories representing immediate, emergent, urgent, semi-urgent, or non-urgent events, based on a triage nurse’s judgment about the patient’s need for immediate evaluation, stabilization, and/or treatment.
The scholars and practitioners mentioned diverse measures for reducing false emergency service calls.
One of the best ways of reducing false emergency calls is to educate citizens on the proper use of emergency numbers and the tremendous cost resulting from those times when emergency calls are made in error. Serious sanctions applied to those who abuse emergency phone numbers, the charging of heavy penalties and following through with prosecution could also be included in the legislation (EENA, 2011).
School-based education, public service announcements and a greater degree of care for each call that is received by dispatchers can also contribute to reducing false emergency calls (EENA, 2011; https://www.emergencymentors.com/false-emergency-services-calls/).
In addition to automatic call sorting systems – depending on the characteristics of the respondents – numerous other technical measures were mentioned: an automatic greeting that will screen erroneous calls before they are patched through to dispatchers, warnings, callbacks, etc.
Weinlich et al. (2018) researched the use of smartphone geolocation data and a worldwide emergency call support system for improving the intervention in cases of disorientation and language barriers.
Even if, from a technological point of view, many solutions can lead to a reduction in the number of abusive calls, a thorough study performed on the characteristics of the calls and callers can provide valuable insights for designing more appropriate measures to deal with this unfortunate phenomenon.
Data collection and Research Methodology
Data Collection on Non-Emergency Calls
Spatial Distribution of Non-Emergency Calls
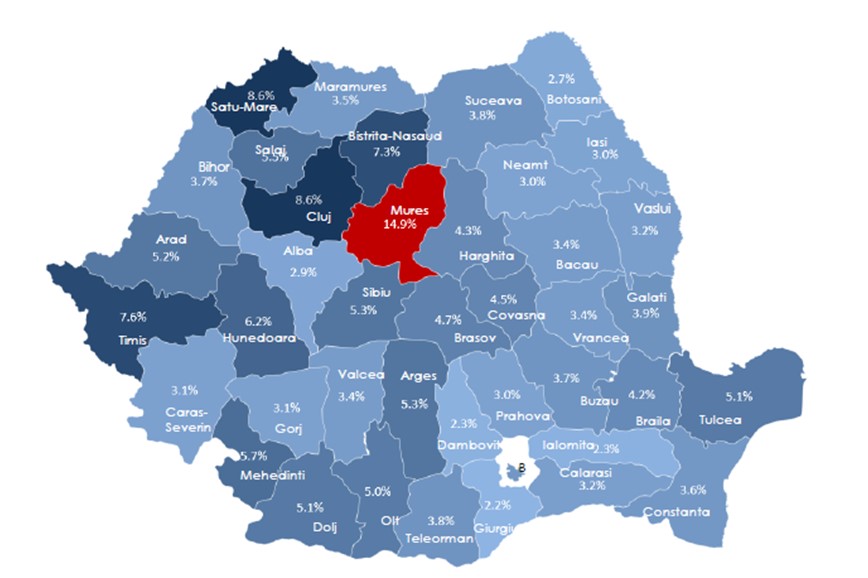
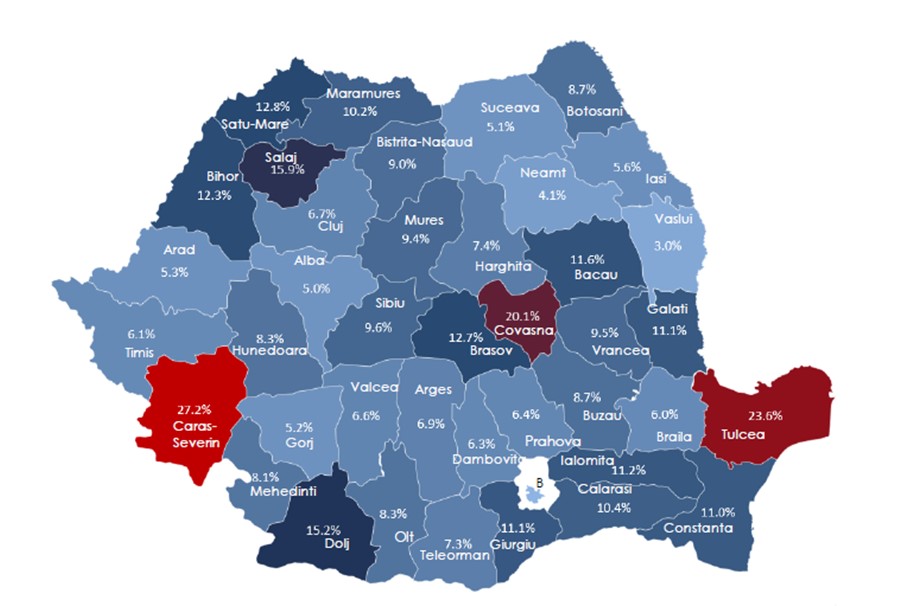
Romania has a surface area of 238,397 km2 and a population of 20,121,641 (according to the census of 2011), thus resulting in a population density of 84.4 people per km2.
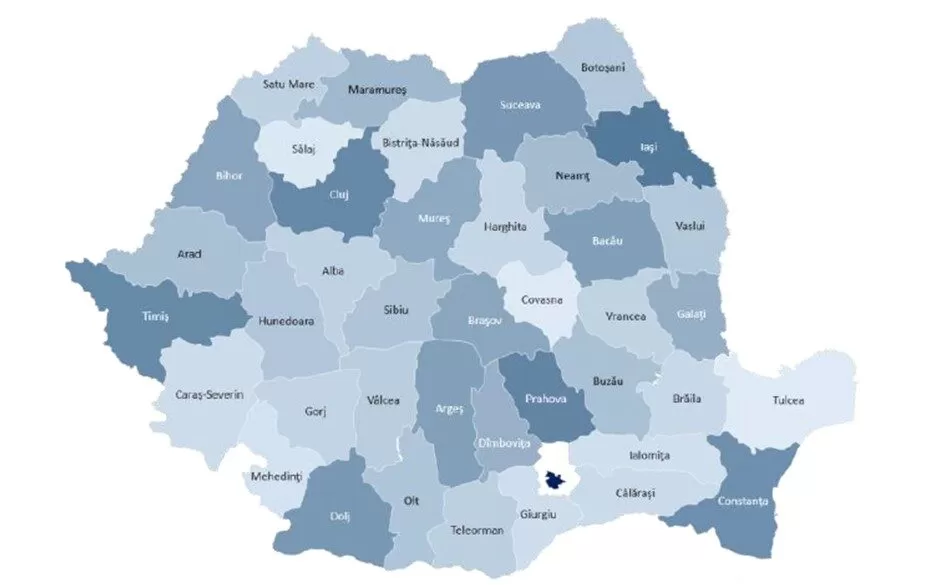
The country is administratively split into 41 local jurisdictions, as depicted hereunder. In each county, there is a Public Safety Answering Point (PSAP) receiving the 112 calls generated by the inhabitants or visitors of the county. Figure 1 represents the population density for each county (darker shades of blue representing higher ratio values).
Fig. 1: Population density per county (population per km2)
Source: the authors
The incoming calls received by each PSAP from December 2017 to May 2018 were automatically collected, meaning a total of 5,956,240 calls. From that large volume of records, genuine emergency cases represented only 45.
The collected data has been processed and represented in graphs, by using Microsoft Excel features and the ESRI GIS Desktop application.
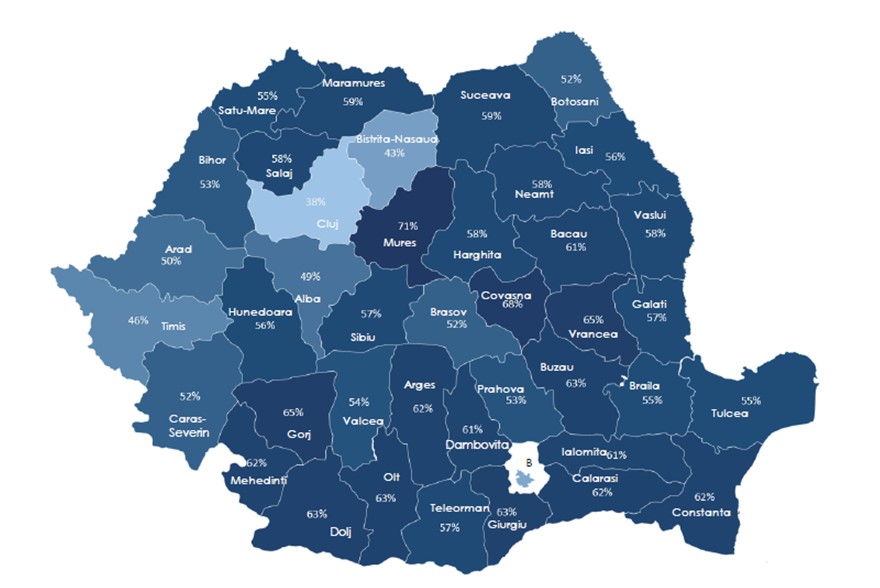
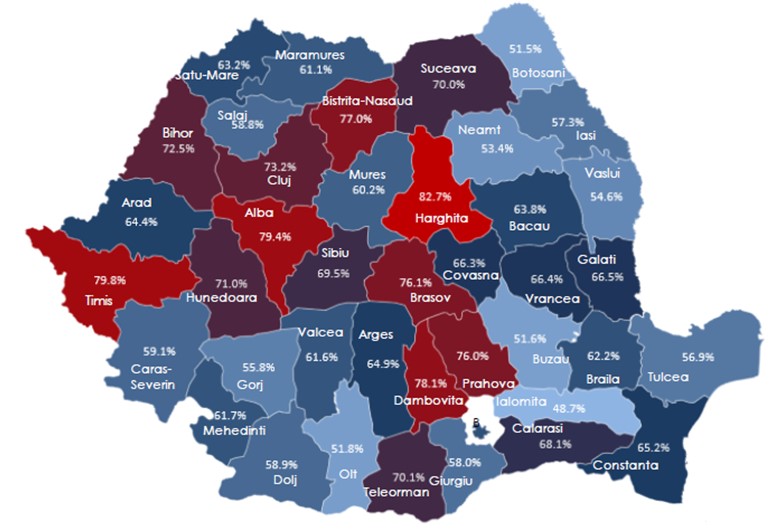
The incidence of non-emergency calls expressed as a ratio from the total number of calls received per counties is represented in Figure 2 below. One could easily observe that the ratio of non-emergency calls per counties vary reported to the total volume of calls per counties,, and the calculated values do not reveal a correlation to the number of their inhabitants, but rather tied with the citizen’s personal awareness and their attitude and behavior toward the 112 emergency service. This particular representation can aid the 112 system administrators in focusing their awareness campaign on the most troublesome counties.
It must be noted that the white color surrounding Bucharest is actually the county of Ilfov. Bucharest and Ilfov have a metropolitan PSAP that receives all calls generated from their regions, and that is why this white color will always be seen around Bucharest when referring to calls.
Fig. 2. Non-emergency calls per county (Jan 2017 – May 2018)
Source: the authors
It is indeed worth noting that in 35 counties, the number of non-emergency calls represents more than 50% of the total calls made. Such figures must definitely be corrected, or the emergency services might not be able to bring any actual value to the safety and security of people.
The highest percentages of non-emergency calls are recorded in Mureș (71%), Covasna (68%), Vrancea and Gorj (65%), while the lowest percentages were recorded in Cluj (38%), Bistrița-Năsăud (43%) and Timiș (46%). In the Capital of Romania, Bucharest, 41% of the calls made to the 112-emergency number proved to be non-emergencies.
This geographical representation shows us at a glance which counties must be first approached in terms of a communications campaign meant to increase the awareness of people on the scope and role of the 112-emergency system.
Types of non-emergency calls
Call’s timestamp and their pattern
From December 2017 until May 2018, a specific field was inserted into the file case screen of the 112 call takers, so as to allow them to differentiate between the different types of non-emergency calls.
The classes added to the newly created field in the interface comprised of a choice between informative, unintentional, associated, abusive, and other type of calls, but not genuine emergency calls.
Calls were diverted to the informative category if the callers asked questions unrelated to their safety and security of life, premises or environment, thereby giving the operators the opinion that the actual scope of the 112-emergency system was not known by enough people.
Unintentional calls were recorded by the 112 call takers whenever they faced pocket dialing or dialing by mistake, with no intention from the caller of actually reporting an emergency.
Associative calls refer to those calls reporting a real emergency that was already attended to, for instance repeated calls for the same fire or car crash reported by different individuals. Such calls border on the precipice between real emergency and non-emergency calls. Still, the authors ultimately chose to list them as non-emergency calls due to the fact that the real emergency was already known and in progress of being attended to by first responders by the time they were first reported.
The abusive call class was selected by 112 call takers if the received call had been intentional and of a frivolous, malicious or prank nature.
The “other calls” class included those calls generated by technicians, conference calls between 112 call takers and others such as test and supportive calls.
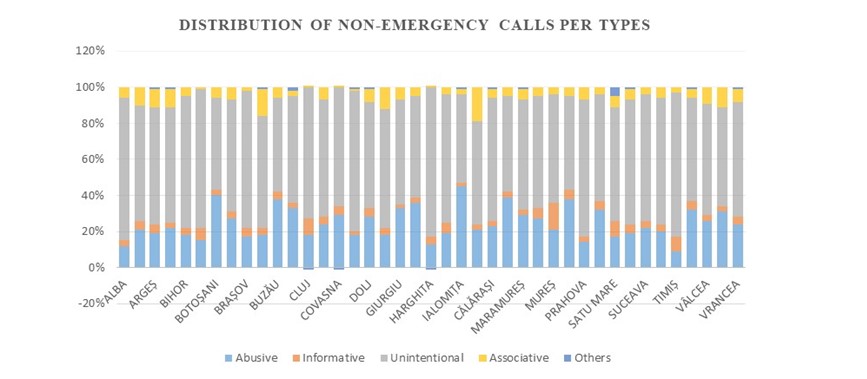
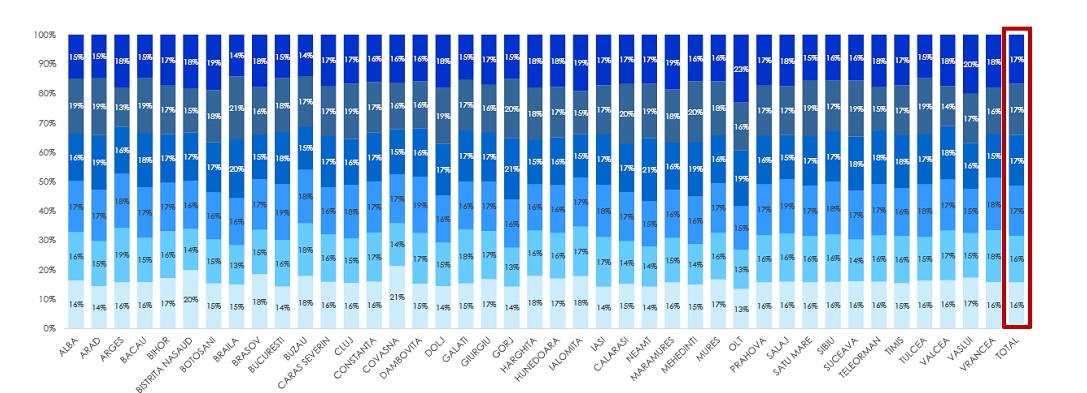
The distribution of these categories of calls in the six months period, beginning in December 2017, is depicted hereunder:
Fig. 3. Types of non-emergency calls per county (Dec 2017 – May 2018). From bottom to upper side: abusive, informative, unintentional, associated, others.
Source: the authors
Data collected throughout this period revealed 3,275,932 non-emergency calls, cumulating a total wasted time of 10,967 operator hours. A number of 661 call takers responded to these non-emergencies and the incoming calls had been generated by 1,008,140 callers.
On average, the 112-system recorded 18,000 non-emergency calls per day, representing 60 hours of discussion between 5,500 callers and 380 operators. Moreover, a significant percentage (66%) of calls were pocket dials (11,510 daily calls) and 35 hours were therefore wasted by 112 call takers listening to these unintentional calls.
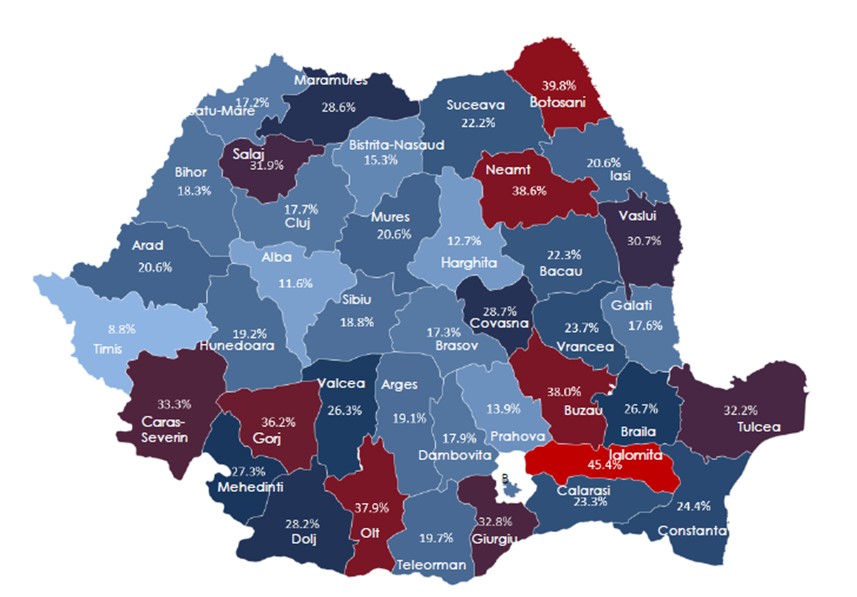
The geographical distribution of informative calls (expressed as a ratio reported to the total number of non-emergency calls) highlighted those counties with a lack of knowledge about the scope of the 112-emergency service. These counties are to be approached immediately with a targeted public communications campaign.
Mureș county is above all other counties, based on this criteria, followed by some other neighboring counties, mostly located in Transylvania.
Fig. 4. Informative calls per county (Dec 2017 – May 2018)
Source: the authors
For unintentional calls, the map in Figure 5 shows a dispersion of those calls all over Romania.
Pocket and unintentional dialing form common causes of generating 112 calls in all of the other EU member states, across different types of phone and smartphone terminals. It is worth mentioning that some hardware configurations and software patches that automatically started dialing PSAPs for unknown reasons upon reboot were encountered. These phone types have been reported by the administrator to the National Regulatory Agency for further investigations and hopefully, less and less of such calls to 112 will be detected as a result.
Fig. 5: Unintentional calls per county (Dec 2017 – May 2018)
Source: the authors
The abusive call distribution shows a more dispersed ratio for this type of calls, which required more research work to be performed in order to obtain a more accurate picture.
Fig. 6: Abusive calls per county (Dec 2017 – May 2018)
Source: the authors
When further analyzing abusive calls, the first action the authors undertook had been to set up a new field to be completed by the call takers so that they could differentiate between children and adult initiators. This age flag was particularly easy for the operators to set, after performing a quick analysis of the caller’s voice by tone and the vocabulary used.
For this analysis, the authors considered adults as those callers above the ages of 16-18. This means that teenagers whose voices had changed were considered adults for the purposes of this research.
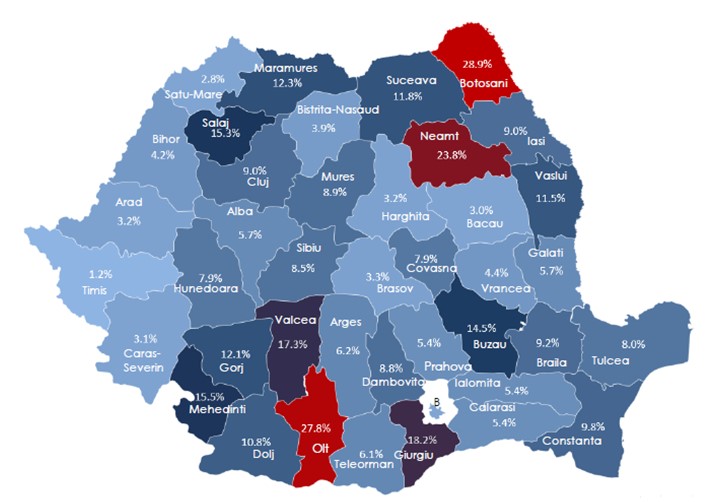
The representation of abusive calls distributed via age thematic maps shows different ratio as follows:
Fig. 7: Abusive adult calls per county (Dec 2017 – May 2018)
Source: the authors
Fig. 8: Abusive children call per county (Dec 2017 – May 2018)
Source: the authors
If the above spatial representation gave relevant information as to which county will be approached with the awareness campaign first, the time pattern indicated how the message should be shaped, to whom it should be addressed and at what time it would be more effective in reaching its audience.
The graph distribution per months showed no significant variance in volume across four months (dark blue – Dec 2017, lighter blue – May 2018):
Fig. 9. Abusive calls per months (Dec 2017 – May 2018)
Source: the authors
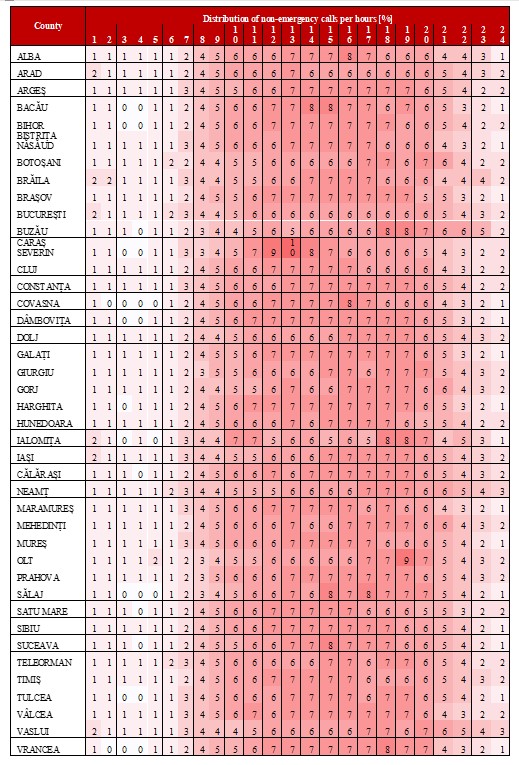
The distribution of non-emergency calls per hours revealed that the calls directed to the 112 PSAPs in a higher number were from 7 AM to 10 PM, referring to the active period of the day for both adults and children. People working night shifts and feeling lonely or those people needing to communicate with someone else during night time generated a much smaller percentage, as expected.
Fig. 10: Non-emergency calls per hours (Dec 2017 – May 2018).
Source: the authors
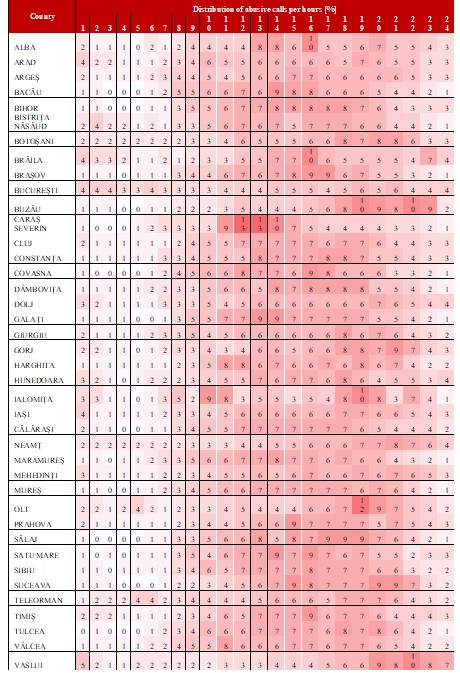
For the category of abusive calls, the authors registered a shift of 1-2 hours toward the right side of the time spectrum compared to the non-emergency calls depicted above in Figure 10.
Fig. 11: Abusive calls per hours (Dec 2017 – May 2018)
Source: the authors
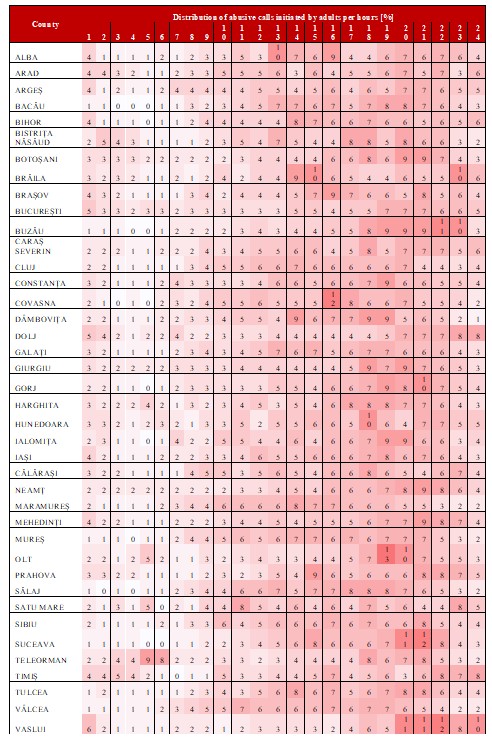
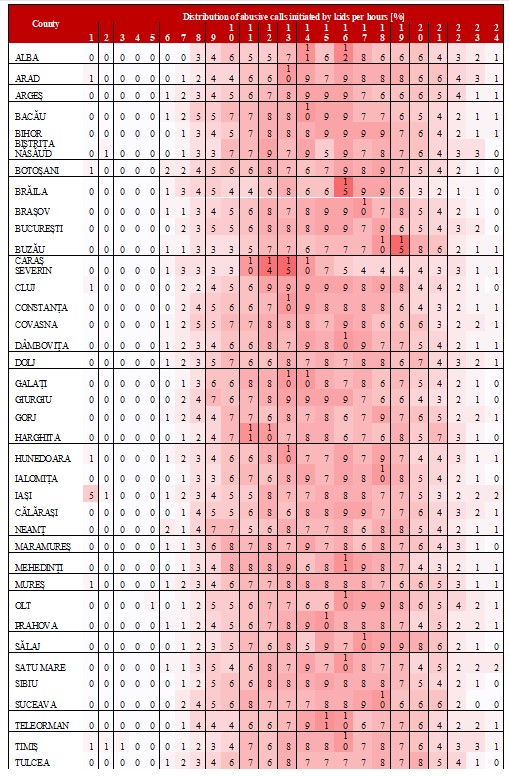
A very clear representation of time windows for adult abusive calls versus children abusive calls is shown in the figures below.
Most abusive calls generated by adults were registered in the afternoons or following the working hours (i.e. between 2 PM and 10 PM), while for children, the time window with heaviest numbers was between 12 AM and 4 PM, when they were mainly bereft of adult supervision.
Fig. 12. Abusive adult calls per hours (Dec 2017 – May 2018)
Source: the authors
Fig. 13: Abusive children calls per hours (Dec 2017 – May 2018)
Source: the authors
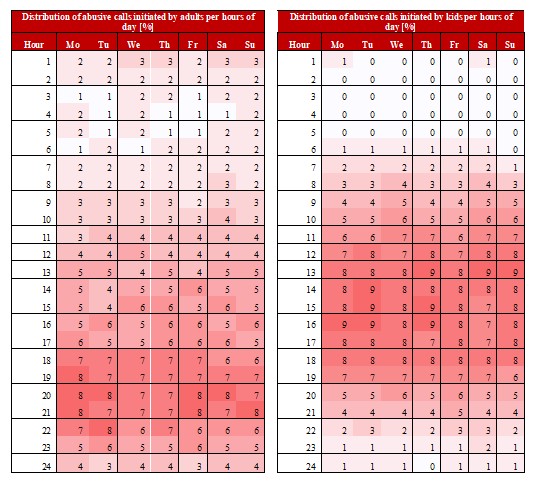
A comparative side-by-side view per days of the week can also be found below:
Fig. 14: Abusive calls per hour initiated by adults versus children (Dec 2017 – May 2018).
Source: the authors
For each category, the authors hardly observed a higher intensity of colors during the working days compared to the weekends.
Insights on abusive calls generated by adults, their distribution and main findings
After preliminary conclusions were formed based on the above spatial and time distribution on the class of non-emergency and abusive calls, the authors began rolling the awareness campaign in high-percent counties, primarily in schools, so as to target children during school hours. These campaigns resulted in a significant decrease in the national percentage of abusive calls generated by children.
Then the research was focused on the adult sub-category of abusive callers. For that reason, the authors appended three new predefined categories of calls, which could be selected by the call takers during their interview with the caller – either frivolous, malicious and prank calls. This research began by collecting data from 1st September 2018 until 31st December 2018 (i.e. the 4th quarter of 2018).
The differences between frivolous, malicious and prank calls are detailed below, as follows:
a) Frivolous Calls – when incoming calls are initiated either for fun, or by accident while playing with a phone’s keypad, or testing a phone’s various functionalities;
b) Malicious Calls – when incoming calls address the emergency service or the 112 operators using insults or gratuitous verbal attacks;
c) Prank Calls – when incoming calls are intentionally dialed for reporting false alerts that ask for the field intervention of 112 agencies (Police, Gendarmerie, Medical Emergency Services or Fire brigades).
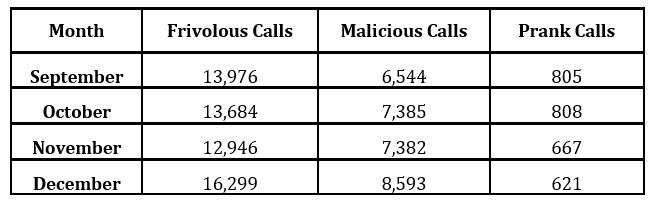
The distribution of abusive calls according to the matrix is presented in Table 1 below.
Table 1: Abusive Calls distribution per type of call (4th quarter of 2018)
Source: the authors
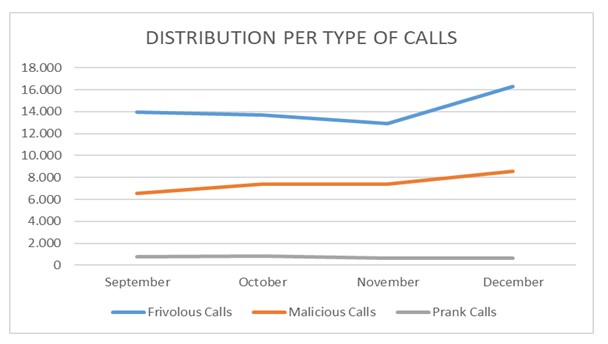
The total number of abusive calls generated by adults throughout the analyzed quarter was 89,710, having, systematically, the highest percentage of frivolous calls (about 65%), followed by malicious calls in the range of 32%, and the lowest percentage being the prank calls (approximately 3%).
It is noticeable that in December, the number of frivolous and malicious calls increased, but the number of prank calls decreased. It seemed that citizens did not like the idea of spending money to pay fines in December, but had, instead, a good appetite for jokes, or checking the functionality of their newly purchased phones compared to the rest of the year
Fig. 15. Time series for categories of abusive calls (4th quarter of 2018)
Source: the authors
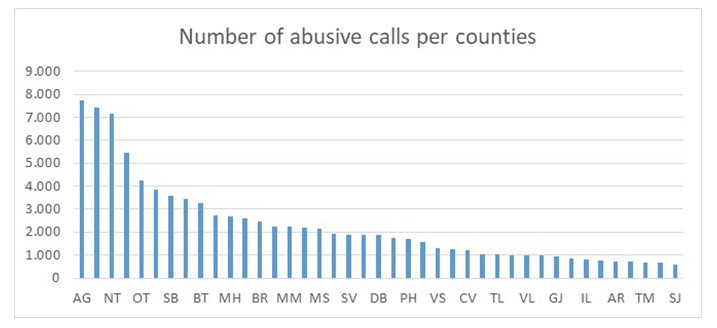
The split in the number of abusive calls directed to 112 by adults per each Romanian county is represented in Figure 15. The X-axis depicts the county codes, while the Y-axis represents the number of abusive calls.
Reducing the number of abusive calls is essential for the proper operation of PSAPs, particularly in times of widespread disasters, including the current COVID-19 pandemic, when 112 acts as a primary contact point for reporting illness. The representation below supports the administrator in prioritizing the launch of public awareness campaigns in the most affected counties.
Fig. 16. County distribution of abusive calls (4th quarter of 2018)
Source: the authors
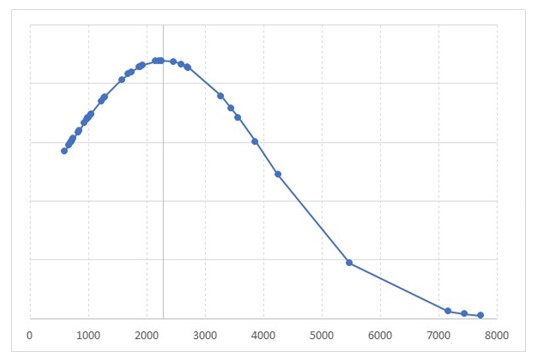
The normal distribution in the number of adult abusive calls across the counties in Romania is depicted in Figure 17 below.
Fig. 17: Normal distribution of the number of adult abusive calls per counties in Romania
Source: the authors
The calculated median value is 2,284 and the standard deviation σ is 1,817.6. In 28 out of the 41 counties, the observed numbers are below the mean, while only 13 counties range above this value, with notable numbers recorded for the capital and the adjacent Ilfov county that are treated as one metropolitan region. Nevertheless, it is important to note that the capital does not amount for the largest observed number of calls.
The impact of abusive calls on the operational performance and financial losses
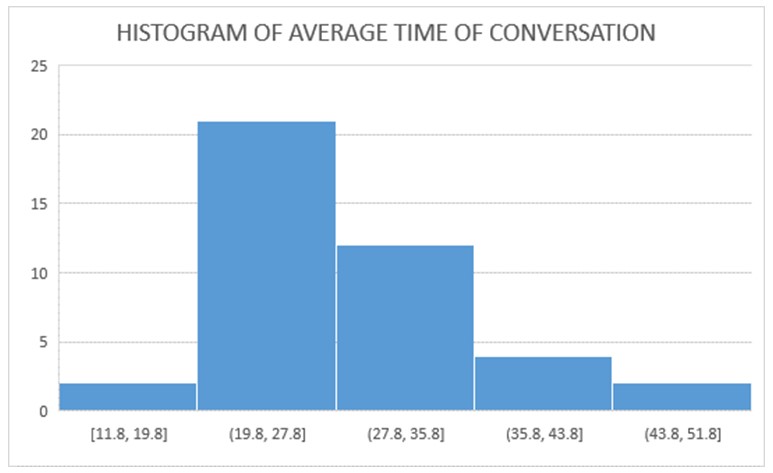
The histogram of the average time of non-emergency conversations shows large variations, ranging from 11 seconds to 50 seconds for dealing with such calls. Even at the national level, the operators have the same job description and receive the same instructions on how to handle this type of calls, so it is a must to reinitiate training courses with all call takers on that aspect, in order to achieve a similar way of handling the calls all over the country.
Furthermore, at the time of the analysis, the number of operators on duty per shift was the same, except for the Bucharest PSAP which employed a higher number of call takers.
Fig. 18: Distribution of the average time of conversation (clustered into seconds)
Source: the authors
The waiting time in the queue is an important parameter of any emergency call center’s performance, due to the fact that its value represents the duration of time someone in real need has to wait before he can report a genuine emergency. Considering that emergency calls are still coming in between those large numbers of non-emergency calls, it becomes mandatory that the 112 administrator takes operational and technical actions in order to decrease call waiting times as much as possible.
The number of abusive calls made to the 112 system in the 4th quarter of 2018 collectively amounted to a total call duration of about 1 entire month. This time was essentially wasted by the operators having to deal with such non-substantiated calls.
One month of non-valuable conversation time per quarter could occupy a shift of 5 call takers, since each quarter (25) of the total conversation time to 112 is wasted on answering abusive calls generated by adults.
In financial terms, considering that frivolous and malicious calls are not transferred to first responder agencies, the direct cost of non-emergency calls is actually represented by the call takers’ salaries. It was estimated that the authorities are paying one shift of 5 operators to deal just with those categories of calls for 1 month per quarter. If their salaries cost around 5,000 EUR per month in each quarter, then losses of up to 20,000 EUR per year can be incurred only to answer frivolous and malicious calls. The opportunity costs associated with those categories of calls are much higher in reality, because non-emergency calls render call takers unavailable to handle real emergencies of people in need.
However, the most important direct financial losses are incurred because of prank calls made to the 112 systems. First responders are generally mobilized due to this particular type of calls, as they usually request the dispatch of resources to the place of the reported incident (e.g. officers, medical staff, firefighters equipped with specific tools and devices, automobiles, motorcycles and even helicopters). If a figure of 2,900 prank calls was made per quarter, in Q4 of 2018, the estimated cost of unnecessary intervention could be easily approximated to 500 EUR per call, resulting in total losses of 1.45 million EUR per quarter and approximately 5.8 million EUR per year.
It is worth noting that the authors’ particular calculation is still likely optimistic, considering that in the case of long-range or heavy conditions interventions requiring the cooperation between more than one first responder agency, the costs could rise up to even thousands of euros per call.
Recommendations
The most significant volume of non-emergency calls remains that generated by pocket dialing. This could be addressed both from a technological perspective (via countermeasures or actions to be addressed by mobile networks/device manufacturers allowing emergency calls to be initiated even when the terminals are locked), but also through an awareness campaign informing people to lock their phones when not in use.
Abusive calls represent the second most important source of unjustified calls – and the most costly ones. The cases encountered are varied, but most stem from a lack of civic responsibility and information on behalf of the callers. Both of these facets are addressable through targeted awareness campaigns. Upon investigating the archive of emergency calls, situations with people who had called 970 times over a period of 6 months were found. For such isolated cases, an education campaign would likely have no effect, but a fine might be more effective in diminishing the numbers of calls.
One recommendation that is likely to greatly bolster the responsibility of callers is the modification of the national legislation regarding the purchase of prepaid SIM cards. In this respect, the mandatory declaration of the purchaser’s identity at the shopping desk should be considered.
In order to decrease the number of abusive calls, the 112 service administrator in Romania will continue to run the media campaigns on the role and scope of the 112 emergency number. Considering the results of this research, it appears especially important to continue fine tuning these results in terms of message content, wording, representations and time spots to reach the right audience more effectively.
The quality of the service will be augmented by activating, either temporarily or permanently, a number of supplementary call centers to deal with the issue of special calls, such as the one for medical assistance and support for COVID-19, or for chronic issues that do not actually represent real emergencies.
Communication of the 112 service must be directed towards large audiences and adapted to the modern lifestyle of people via official websites, TV, digital media, social networks, search engines, etc.
Conclusions
In the present study, the authors collected data pertaining to incoming 112 emergency calls in Romania, conducting an analysis over an extended period of time, and then focusing on the specificity of non-emergency calls. Ultimately, they concentrated on studying the abusive calls generated by adults.
The scope of research was to identify the dominant characteristics of the abusive calls, which would in turn allow the 112 administrator to target the right audience, using the right channels at the right time.
By implementing the proposed solutions, the authors succeeded in decreasing the volume of non-emergency calls under the value of 50%, from 2019 until the time of writing. They will continue to increase the quality of services in terms of availability and the performance delivered by the Public Safety Answering Points as well.
The results showed that the most important number of abusive calls originated by adults were frivolous calls. It was also calculated that the time wasted by the operators taking abusive calls generated by adults amounts to about one month lost per quarter. To combat this type of calls, there is a need for a dedicated shift of 5 operators specifically tasked with taking only abusive calls.
All of these non-emergency calls incur costs, which turn into real financial losses for the national budget. These losses shall be presented to the citizens in an attempt at making them aware of the situation, as well as of the huge cost of involving first responders in prank calls.
Therefore, the steepest financial cost and impact on the public budget comes from the prank calls category, with a total estimated cost of at least 5.8 million EUR per year.
The information on the spatial distribution of non-emergency calls per county, weekdays and hours is useful for optimizing the process of allocating different numbers of operators per counties, so as to reduce the waiting time for emergency calls on a nationwide basis.
It would seem though that the authors’ findings and insights have already begun to bear fruit. According to the data collected by the PSAPs of the 112 emergency system, during the period January – November 2019, there were, in total, 10,437,328 calls made to 112, out of which, 5,404,650 (51.7%) reported real emergencies. Due to the efforts of the 112 administrator, it is for the first time in 16 years of operating the 112 system that we are above the 50% line of real emergency calls made to 112. The authors will of course continue to optimize their efforts so as to maintain this trend of decreasing non-emergency calls in the following years as well.
Acknowledgments
This paper is a result of the research performed within the Doctoral School of Management from The Bucharest University of Economic Studies.
References
Afilalo J, Marinovich A, Afilalo M, Colacone A, Léger R, Unger B, Giguère C.. (2004) Nonurgent emergency department patient characteristics and barriers to primary care. Academic Emergency Medicine, 11, 1302-1310.
Blushtein O., Siman-Tov M., Magnezi R. (2019). Identifying and minimizing abuse of emergency call center services through technology, American Journal of Emergency, https://doi.org/10.1016/j.ajem.2019.07.015
Erwin A. Blackstone, Andrew J. Buck, Simon Hakim (2005) Evaluation of alternative policies to combat false emergency calls elsevier.com/locate/evalprogplan
Gomes D., Guto Santos L., Rosendo D. et al. (2019). Measuring the impact of data center failures on a cloud-based emergency medical call system (2019). Concurrency and Computation: Practice and Experience, e5156, 1-21, https://doi.org/10.1002/cpe.5156
Government Emergency Ordinance no. 34/2008 regarding the organization and functioning of the unique national systems for emergency calls
Hakim, S., Blackstone, E. A. (1996). Keeping a watchful eye on the cost of response to false alarms. Security Dealer. August, pp. 102–108.
Honigman L. S., Wiler J. L., Rooks S., Ginde A. A. (2013). National Study of Non-urgent Emergency Department Visits and Associated Resource Utilization, Western Journal of Emergency Medicine: Integrating Emergency Care with Population Health, 14(6), 609-616, doi: 10.5811/westjem.2013.5.16112
ITU (2008). ITU-T E.161.1. Series E: Overall Network Operation, Telephone Service, Service Operation And Human Factors. International operation – Numbering plan of the international telephone service. Guidelines to select Emergency Number for public telecommunications networks, https://www.itu.int/rec/T-REC-E.161.1-200809-I
Landoni G, Biselli C, Maj G, Zangrillo A. (2007). Faster rings in the survival chain: Mobile phones could improve the response to the dedicated emergency call system. Resuscitation, 75(3):345-350.
Lehm K. K., Andersen M. S. & Riddervold I. S. (2017), Non-urgent Emergency Callers: Characteristics and Prognosis, Prehospital Emergency Care, 21 (2), 166-173, DOI: 10.1080/10903127.2016.1218981
Milbrett P., Halm M. (2009). Characteristics and predictors of frequent utilization of emergency services, Journal of Emergency Nursing, 35(3):191-8, doi: 10.1016/j.jen.2008.04.032
Naouri D., Ranchon G., Vuagnat A., Schmidt J., El Khoury C., Yordanov Y. (2019). Factors associated with inappropriate use of emergency departments: findings from a cross-sectional national study in France, BMJ Quality & Safety, Published Online First: 30 October 2019, doi: 10.1136/bmjqs-2019-009396
Rashford S, Isoardi K. (2010). Optimizing the appropriate use of the emergency call system, and dealing with hoax callers. Emergency Medicine Australasia 2010, 22(5), 366–7. https://doi.org/10.1111/j.1742-6723.2010.01325.x.
Rudman, W. B. Clarke R. A., Metzl J. F. (2003). Emergency responders: drastically under funded, dangerously unprepared. New York, NY: Council on Foreign Relations.
Weinlich M., Kurz P, Blau MB, Walcher F, Piatek S (2018). Significant acceleration of emergency response using smartphone geolocation data and a worldwide emergency call support system. PLoS ONE 13(5): e0196336, 1-10, https://doi.org/10.1371/journal.pone.0196336