Introduction
Tourism as a form of leisure led to the development of regions, independent of the form that it takes: business travel, leisure seaside or mountain tourism, or other forms. In the mountain of the North East Region of Development, tourism has a special role for people’s recovery and relaxation, through socio-cultural and hiking activities. From the economic point of view, tourism generates a significant increase in the localities budget, and creates new jobs. Mountain areas are targets for investors and tour operators through their various tourism opportunities. They are targeting their offer for different types of tourists, as employees, retired people or students.
Studies show that visitors have in mind more than a trip in to the mountains and they actually look for diversity, new cultural, educational experiences and other recreational forms of tourism (Bostan C-tin, Costachi Cristina, 2008).
The Neamţ area from the North East Region of Development has high tourism potential, and local authorities are trying to develop this source of development and investments, searching for the best solutions which can lead to economic benefits. Their challenge is to create new jobs from complementary activities which can enhance tourism, as the development factor of poor local tourism infrastructure. As Dobroţeanu and Lădaru (2010) said, the approach on long term development of any sector requires a periodical overlook of both the objectives and the methods leading to the accomplishment of these objectives.
One option of tourism in the region is rural tourism which takes a relatively small share among internal and external visitors. The services offered are acceptable, if we consider the balance quality/prices. In these areas, the promoting of rural tourism is made by ANTREC Neamţ, as part of The National Association of Rural, Eco and Cultural Tourism, which is a major operator and promoter of this type of tourism, offering tourism programs and events, accommodation and meals in boarding houses and agro-tourism in the region. This type of tourism is considered to be a true remedy for the busy city life, against noise and stress factors, Romanian villages offering numerous recreational opportunities and knowledge about traditions of the Romanian people (Romeo Creţu Cătălin, 2005). Most hostels are concentrated in Ceahlău-Durău, Filioara-Agapia, Vânători-Neamţ, Viişoara, Vaduri, Farcaşa, Piatra Neamţ, Almaş, Tg. Neamţ, Tupilaţi, and Bicazu Ardelean.
The Research Method
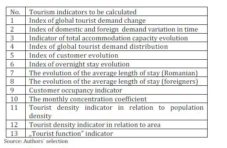
We selected the resort Durău from Neamţ County as the interest area of this paper. Besides region documents regarding marketing plans for integrated tourism development, we studied statistical data on tourist flows provided by The Romanian National Institute of Statistics, local statistic source and we surveyed local authorities’ opinions regarding regions’ development opportunities related to tourism and agro-tourism. We also evaluated the degree of capitalization of some representative pensions from the Durău resort. In this respect, intending to determinate the tourist traffic we calculated indicators as: Index of global tourist demand change, Index of domestic and foreign demand variation in time, Indicator of total accommodation capacity evolution, Index of global tourist demand distribution, Index of customer evolution, Index of overnight stay evolution, The evolution of the average length of stay, The evolution of the average length of stay, Customer occupancy indicator, The monthly concentration coefficient, Tourist density indicator in relation to population density, Tourist density indicator in relation to area and „Tourist function” indicator.
Results and Discussions
The Accommodation Structures in Neamţ County
Between 2007 and 2011 the total accommodation capacity in the Neamţ County has slightly increased from 111 to 122 units. In the 5 years of the study, the highest increase was recorded for the guesthouses, which confirms the orientation for small family tourism business (Table.1).
Table 1. The Evolution of Tourist Accommodation Establishments between 2007 and 2011 in Neamţ County

Most of the new tourism accommodation units were built in the Durău resort, where predominates the guesthouses, followed by villas and cottages (Table 2).
Table 2. Evolution of the Number of Tourist Accommodation Units in 2007-2011 Durău

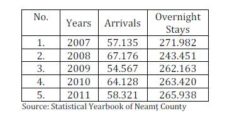
Between 2007 and 2011, the numbers of tourist arrival in Neamt County fluctuated; the highest number being recorded in 2007, when the average income has increased at national level, supporting the development of tourism sector.
Table 3. Evolution of the Number of Tourists and Overnight Stays between 2007 and 2011 in the Neamt County

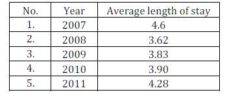
The average number of days spent in a tourist accommodation has the highest value in 2007, and the shortest period spent in average by tourists was recorded in 2008. The average stay, which was calculated as the ratio between the number of nights and the number of tourists, indicates that tourists chose to spend a period of 4-5 days in one of the resorts of Neamţ County.
Table 4. Average Length of Stay in Neamt County

Analysis of Tourist Traffic for Two Pensions in the Tourist Resort Durău
For the analysis of tourism evolution in two pensions from resort Durău, we considered the following set of indicators:
Table 5. Tourism Indicators

Study Case: Pension “House Bella”
The pension House Bella had a positive evolution in the last years, indicated by the increased number of nights spent by tourist in this location.
Table 6. Indicators of Tourist Traffic in Pension “House Bella”

Among the most relevant indicators of tourist traffic, we consider the following:
1). Index of Global Tourist Demand Change:
Ct = (No. Overnights current year / no. Overnights previous year) * 100
Ct in 2008 = (4762/4670) *100=101.97%
Ct in 2009 = (5042/4762) * 100=105.87%
Ct in 2010 = (5098/5042) * 100=101.11%
Ct in 2011 = (5632/5098) * 100=110.47%
We can see from the analysis that tourism demand grew and the highest growth was recorded in 2011. In 2009 was an increase of 5.87% compared to 2008. In 2010, tourism demand growth had a rate of 1.11%, while the increase of tourism demand in 2011 was 10.47% when the highest value was recorded.
2). Index of (Romanian and Foreign) Demand Variation in Time
Ict = (No. tourists Current year / no. Tourists previous year) * 100
Ict in 2008= (754/650)*100=116% (Romanian tourists)
Ict in 2008= (169/145)*100=116.55% (foreign tourists)
Ict in 2009= (986/754)*100=130.76% (Romanian tourists)
Ict in 2009= (190/169)*100=112.42% (foreign tourists)
Ict in 2010= (1078/986)*100=109.33% (Romanian tourists)
Ict in 2010= (139/190)*100=73.15% (foreign tourists)
Ict in 2011= (911/1078)*100=84.50% (Romanian tourists)
Ict in 2011= (148/139)*100=106.47% (foreign tourists)
Time variation index for Romanian tourists travel demand increased in 2009 compared to 2008. The index variation in time for demand decreased in the years 2009 and 2010 compared with 2008, and increased in 2011 by 33.32% compared to 2010.
3). Indicator of Total Accommodation Capacity Evolution:
Icc = (no. of places Current year / no. Places previous year) * 100
Icc in 2011= (28/28)*100=100%
Number of accommodation places remains constant at 28.
4). Index of Global Tourist Demand Distribution:
Irct = [no. tourists / (No. Romanian tourists + No. foreign tourists)] * 100
Irct in 2008= (754/923)*100=81.69% (Romanian);
Irct in 2008= (169/923)*100=18.30% (foreign tourists)
Irct in 2009= (986/1176)*100=83.84% (Romanian);
Irct in 2009= (190/1176)*100=16.15% (foreign tourists)
Irct in 2010= (1078/1217)*100=88.57% (Romanian);
Irct in 2010= (139/1217)*100=11.42% (foreign tourists)
Irct in 2011= (911/1059)*100=86.26% (Romanian);
Irct in 2011= (148/1059)*100=13.97 % (foreign tourists)
Analyzing global travel distribution index, we can see that the indicator is higher for the Romanian than for the foreign tourists. The conclusion might be possible that foreign tourists prefer larger hotels or complexes.
5). Index of Customer Evolution:
Iec = (No. Romanian tourists + No. Foreigner tourist’s current year) (No. Romanian tourists + No. Foreigner tourists last year) * 100
Ice in 2008= (923/795)*100=116.10%; Ice in 2009= (1176/923)*100=127.41%
Ice in 2010= (1217/1176)*100=103.48%; Ice in 2011= (1056/1217)*100=86.77%
Evolution of clients increased year by year, the highest value being recorded in 2009. A decrease of 50% occurred in 2011, and in 2010 was recorded a decrease of 24% compared to 2009.
6). Index of Overnight Stay Evolution:
Ios = (no. night’s Current year / no. Previous night’s year) * 100
Ios in 2008= (4672/4670)*100=100.04%; Ios in 2009= (5042/4762)*100=105.87%
Ios in 2010= (5098/5042)*100=101.11%; Ios in 2011= (5632/5098)*100=110.47%
Evolution index overnight stays in 2009 increased by 5.83% compared to 2008. In 2010, the index decreased by 4.76% compared to 2009, but there is an increase of 10.43% in 2011 compared to 2008.
7). The Evolution of the Average Length of Stay (Romanian)
Sm = (average stay Romanian current year / previous year average stay) * 100
Sm in 2008= (2.10/2.87)*100=73.17%; Sm in 2009= (2.15/2.10)*100=102.38%
Sm in 2010= (1.70/2.15)*100=79.06%; Sm in 2011= (1.81/1.70)*100=106.47%
The average length of stay for Romanian tourists increased with 29.21% in 2009 compared to 2008 and with 27.41% in 2011 compared to the year 2010.
8). The Evolution of the Average Length of Stay (Foreigners)
Sm = (current year stay foreigners environment / medium stay the previous year) * 100
Sm in 2008= (32.20/34.23)*100=94.06%; Sm in 2009= (35.25/32.20)*100=109.47%
Sm in 2010= (34.78/35.25)*100=98.66%; Sm in 2011= (34.05/34.78)*100=97.90%
We can see an increase in average length of stay for foreign tourists in 2009 compared to 2008 by 15.41%, and a decrease in 2010 and 2011 compared with 2009.
9). Customer Occupancy Indicator:
Go = [no. overnight / (no. places x no. days)] * 100
Go in 2007= [4670/ (28*365)]*100=45.69%; Go in 2008= [4762/ (28*365))]*100=46.59%
Go in 2009= [5042/ (28*365)]*100=49.33%; Go in 2010= [5098/ (28*365)]*100=49.88%
Go in 2011= [5632/ (28*365)]*100=55.10%;
We see an increase of 10.59% occupancy indicator in 2011 compared to 2007.
10). The Monthly Concentration Coefficient of 2011:
Cc = [no. tourists Month / (no. Romanian tourists + No. foreigners tourists)] * 100

Cc January = (130/1059)*100=12,27%; Cc February = (98/1059)*100=9.25%
Cc March = (59/1059)*100=5,57%; Cc April = (42/1059)*100=3.96%
Cc May = (59/1059)*100=5.58%; Cc June = (99/1059)*100=9.34%
Cc July = (101/1059)*100=9.53%; Cc August = (119/1059)*100=11.23%
Cc September = (53/1059)*100=5.00%; Cc October = (66/1059)*100=6.23%
Cc November = (88/1059)*100=8.30%; Cc December = (145/1059)*100=13.69%
11 a). Tourist Density Indicator in Relation to Population Density

Where: Ti-0 – total Romanian + foreigners tourists;
Pop – village population
Dt in 2007=795/1420 * 100=55.98%; Dt in 2008=963/1437 * 100=67.01%
Dt in 2009=1176/1456 * 100=80.76%; Dt in 2010=1217/1483 *100=82.06%
Dt in 2011=1059/1500 * 100=70.6%
The tourist density indicator shows a significant increase in 2010 compared with 2007, by 26.08%.
b). Tourist Density Indicator in Relation to Area

Where: Ti-0 – total Romanian tourists + Foreigners;
S – Villages area = 9500 km2
Dt in 2007=795/9500 * 100=8.36%; Dt in 2008=963/9500 * 100=10.13%
Dt in 2009=1176/9500 * 100=12.37%; Dt in 2010=1217/9500 * 100=12.81%
Dt in 2011=1059/9500 * 100=11.14%
The density of tourists, in relation with area recorded an increase in 2007 in comparison with 2010.
12). “Tourist Function” Indicator

Where: Nti-0 – No. Places;
Pop – village population.
Ft in 2007=28/1420 * 100=1.97%; Ft in 2008=28/1437 * 100=1.94%
Ft in 2009=28/1456 * 100=1.92%; Ft in 2010=28/1483 * 100=1.88%
Ft in 2011=28/1500 * 100=1.86%;
We can see that the indicator “tourist function” has lower values in 2011, compared to 2007.
Study Case: Pension “Gold”
Pension “Gold” from Durău is one of the most beautiful and interesting places in Romania, a place that has its own magic. Pension “Gold” is located in the center Durău.
Number and composition of tourists during the period 2009-2011 for the pension “Gold” shows the following values:
Table 7. Number and Composition of Tourists for 2009-2011 at Pension “Gold”

Average Realized Pension Stay “Gold” during 2009 -2011
Table 8. Average Stays for the Pension “Gold” in 2009-2011

The average stays per tourist were 1.86 days in 2009 and 2.33 days in 2011. Although the number of tourists decreased, the time spent by tourists in the house had increased.
Calculation of Indicators of Demand Tour and Travel Packages to Pension “Gold”
1). Index of Global Tourist Demand Change:
Ct = (No Overnights current year / no. Overnights previous year) * 100
Ct in 2010= (672/817)*100=82.25%
Ct in 2011= (835/672)*100=124.25%
Changing tourism demand grew by 42% in 2011 compared to Year 2010.
2). Index of (Romanian and Foreign) Demand Variation in Time):
Ict = (No. tourists Current year / no. Tourists previous year) * 100
Ict in 2010= (279/461)*100=60.52% (Romanian)
Ict in 2010= (153/73)*100=209.58% (foreigners)
Ict in 2011= (251/279)*100=89.96% (Romanian)
Ict in 2011= (199/153)*100=130.06% (foreigners)
There is an increase of Romanian tourists in 2011 compared with 2010 by 29.44%, and a decrease in foreign tourists in 2011 compared with 2010 by 79.52%.
3). Indicator of Total Accommodation Capacity Evolution:
Icc = (no. of places Current year / no. Places previous year) * 100
Icc in 2010= (24/24)*100=100%
Number of accommodation places remains constant at 24.
4). Index of Global Tourist Demand Distribution:
Irct = [no. tourists / (No. Romanian tourists + No. tourists Foreigners)] * 100
Irct in 2010= (279/432)*100=84.58% (Romanian);
Irct in 2010= (149/432)*100=34.49% (foreigners)
Irct in 2011= (256/460)*100=55.65% (Romanian);
Irct in 2011= (198/460)*100=43.04% (foreigners)
5). Index of Customer Evolution:
Iec = (No. Romanian tourists + No. Tourists Foreigners current year) / (No. Romanian Tourists + no. Tourists Foreigners previous year) * 100
Iec in 2010= (432/534)*100=80.89%
Iec in 2011= (460/432)*100=106.48%
Index of customer evolution grew in 2010 compared to 2011 by 25.59%.
6). Index of Overnight Stay Evolution:
Ios = (no. overnight Current year / no. Nights previous year) * 100
Ios in 2010= (672/817)*100=82.25%
Ios in 2011= (835/672)*100=124.25%
Evolution index of overnight stays increased from 2010 to 2011 by 42%.
7). The Evolution of the Average Length of Stay (Romanian)
Sm = (average stay Romanian current year / previous year average stay) * 100
Sm in 2010= (2.09/1.81)*100= 115.46%
Sm in 2011= (1.45 /2.09)*100= 69.37%
Evolution stay Indicator Average pension (Romanian) decreased in 2011 compared to Year 2010 by 46.09%.
8). The Evolution of the Average Length of Stay (Foreigners):
Sm = (average stay Foreigners current year / previous year average stay) * 100
Sm in 2010= (2.37/1.91)*100=124.08%
Sm in 2011= (3.21/2.37)*100=135.44%
The average length of stay for foreign tourists increased in 2011 compared to 2010 by 11.36%.
9). Customer Occupancy Indicator:
Co = [no. Overnights / (no. of places x no. Days)] * 100
Co in 2009 = (817/ (24*365))*100=9.32%
Co in 2010 = (672/ (24*365))*100=7.67%
Co in 2011 = (835/ (24*365))*100=9.53%
10). The Monthly Concentration Coefficient of 2011:
Cc = [no. tourists Month / (No. Romanian tourists + No. tourists Foreigners)] * 100

Cc January = (99/721)*100=13.73%; Cc February= (68/721)*100=9.43%
Cc in March= (38/721)*100=5.27%; Cc in April= (29/721)*100=4.02%
Cc in May= (38/721)*100=5.27%; Cc in June = (47/721)*100=6.51%
Cc in July= (74/721)*100=10.26%; Cc in August = (61/721)*100=8.46%
Cc in September = (43/721)*100=5.96%; Cc in October= (49/721)*100=6.79%
Cc in November = (78/721)*100=10.81%; Cc in December= (99/721)*100=13.73%
11 a). Tourist Density Indicator in Relation to Population Density

Where: Ti-0 – total Romanian tourists + Foreigners;
Pop – village population
Dt in 2009=534/1456 * 100=36.67%
Dt in 2010=432/1483 * 100=29.13%
Dt in 2011=460/1500 * 100=30.66%
This indicator shows a decrease in tourist density in 2010, and a slight increase in 2011.
b). Tourist Density Indicator in Relation to Area

Where: Ti-0 – total Romanian tourists + Foreigners;
S – Village area = 9500 km2
Dt in 2009=534/9500 * 100=5.62%
Dt in 2010=432/9500 * 100=4.54%
Dt in 2011=460/9500 * 100= 4.84%
We can see that tourism density indicator in relation to surface decreased from 2009 to 2011 with 0.78%.
12). “Tourist Function” Indicator

Where: Nti-0 – No. Places;
Pop – village population.
Ft in 2009=24/1456 * 100=1.64%
Ft in 2010=24/1483 * 100=1.61%
Ft in 2011=24/1500 * 100=1.60%
The “tourist function” indicator shows a decline from Year 2009 to Year 2011 by 0.04%.
Statistics have shown that most of the tourist attractions in the Neamt County are not fully known and promoted, even if one of the key objectives of local government is to transform Piatra Neamţ and surrounding areas in one of the most important tourist destinations in Romania.
The analysis of the 2 pensions, “Casa Bella” and “Gold “shows that these pensions do not value their potential, and they record different trends regarding Romanian and foreign tourists.
Acknowledgment
The results are part of the Project “Research On Actual Size Evaluation And The Perspective Of Sustainable Rural Development Through The Elaboration Of SWOT Analysis, As Method Of Strategic Planning For The North-East Region Of Romania”, under a financial scheme supported by Romanian National Council for Scientific Research in Higher Education: CNCSIS-UEFISCSU (Grant no 114/28.07.2010), Project manager: Silviu BECIU
References
Bostan C-tin & Costachi Cristina (2008). ‘Neamţ County: Travel Guide,’ Ed Action, Piatra Neamţ.
Cretu Romeo Catalin (2005). ‘Agro Resources,’ University Publishing House, Bucharest.
Dobroţeanu Camelia & Lădaru Raluca (2010). ‘Elements for a National Strategy on Agriculture and Rural Development,’Metalurgia International, vol. XV, 2010, Special Issue no 3, Pag. 137.
Google Scholar
Honţuş Adelaida C. (2005). ‘Geography of the Romanian Tourism and Agritourism,’ Ceres Publishing House, Bucharest.
Honţuş Adelaida C. (2005). ‘Spatial and Agrotouristic Territory,’ Ceres Publishing House, Bucharest.
The European Commission, Regional Operational Program (2007). CCI no: 2007RO161PO001, Decision number: C/2007/3470. Final approval date: 2007-07-12.
The European Union Council (2006). ‘Sustainable Development Strategy of the European Union,’ Revised Edition.
Vintu Raluca (2006). ‘Tourism Potential and Human Resources Neamţ County,’ Ed.Tehnopres, Iasi.
*** Hall Piatra Neamt, Urban Development Strategy 2008-2015 Piatra Neamţ.


