Ioana Cristina FLORESCU1, Silvia Elena CRISTACHE2, Simona APOSTU3 and Florica Georgeta ROTARU4
1,2,3 Bucharest University of Economic Studies, Bucharest, Romania
4National School of Political Science and Public Administration, Bucharest, Romania
Volume 2018,
Article ID 219618,
Journal of Eastern Europe Research in Business and Economics,
16 pages,
DOI: 10.5171/2018. 219618
Received date: 3 January 2018; Accepted date: 3 July 2018; Published date: 6 November 2018
Academic Editor: Georgiana Marin
Cite this Article as:
Ioana Cristina FLORESCU, Silvia Elena CRISTACHE, Simona APOSTU and Florica Georgeta ROTARU (2018)," Modeling Elements in the Passenger Transport in Romania", Journal of Eastern Europe Research in Business and Economics, Vol. 2018 (2018), Article ID 219618, DOI: 10.5171/2018.219618
The transport sector, having a share of about 7% in gross domestic product, represents the second category of services, after trade, of importance in the tertiary sector in Romania being at the same time an activity having a contribution to the economic growth equivalent to the agriculture. In Romania, defining for the transport activity, both in terms of volume of transport and as a contributor to adding value in this sector are the public and goods transportation. They provide the transport of 70% of passengers and 78.5% of goods transport, contributing with about 65% to the gross added value of transport. The article analyzes the current state of urban passenger transport based on statistical data processing using elementary methods such as graphical method, structural modification method, and so on. For a more complex analysis of the relationship and the interdependence between the macro-economic indicators characterizing the transport domain in Romania, econometric modeling methods made with database management and analysis programs were used (Excel, EViews). The stages of the econometric analysis used in the article taken into consideration were the following: establishing the correlation level and its intensity, identifying the function form of the data for the analyzed period, validating the obtained model, and so on. As a result of these methods of analysis, several results were obtained: the passenger urban transport is on an upward trend, based on the increased contribution of interurban and international road transport; even though road infrastructure in Romania leaves it desirable.
Keywords: Sustainable and durable transport, fluidity of traffic, multifactorial linear regression model, interurban and international passenger transport
Introduction
The strategy of the territorial, social and economic development of a city depends largely on the level of the public transport network. This exerts a great influence on the economic and social developments of the city and can be a factor for accelerating or ending its development. Mihalache and Păduraru (2015) state that together with the branches that are related to health care, education, retail, provision of electricity services, natural gases, water and other services, the passenger transport within the city is an area of first necessity in the social life of the inhabitants as well as for the city infrastructure working as a whole.
Therefore, the urban passenger transportation falls within the group of services rendered to the population where no economic goods are created and consists of the movement of persons from one place to another on variable distances, generally by using multiple means of transportation (terrestrial, underground, naval or aerial) in safe comfortable and convenient conditions. At present, the passenger transportation has become an indispensable element of life, as it offers people the opportunity to travel, communicate, perceive and assimilate, and so on. The importance and role of transports according to Gheorghe’s (2001) statements in Transport Management can be emphasized by the link between them and the economic, social and political activities of the members of the society. Thus, the development of transports through the emergence of new means of transportation eliminated the economic isolation and allowed specialization and the exchange of activities, the formation of the national market and the global market, and the sustainable development of domestic and international trade.
According to Mihalache and Păduraru (2015), the urban public transport is characterized by certain features, such as accessibility, the mass character, periodicity and the uniformity character. Through accessibility, we can understand that any person can benefit from public transportation services without the need to present any identity document. The second feature relates to the mass character of the transport, being intended for the movement of persons in group. The number of persons present in the vehicle is not important; the carrier is obliged to carry out the races according to the timetable approved by the local public administration. The third characteristic refers to the periodicity and is manifested by the permanent circulation at certain time intervals, according to a schedule approved in advance. Finally, the uniformity character of public transportation is expressed both by the specific transport arrangements and the contractual clauses which are the same for all passengers.
At the same time, the urban passenger transportation is based on a number of stimulating factors, such as the space distribution of the population, the economic and political cooperation between different countries, the free time of people, and so on. This is constituted in most cases, as a natural monopoly subordinated to the local authority and managed, usually, by a single company (administration) for all means of transportation.
In conclusion, as Brebbia and Miralles (2015) mentioned, 75% of the European Union population lives in urban areas, so urban transportation is an important part of the mobility demand. Being cheaper, the urban public transport is primarily intended, above all, to drive the low-income population, and for this purpose the local public authorities provide the socially vulnerable people, as appropriate, with public transport facilities in the form of free travel, nominative compensations, subscriptions at a reduced price, and so on. As an associate country and member of the EU since 2007, Romania has aligned itself with the European policies and began the process of gradual implementation of the community policies in the national transportation policies. Finally, the transportation, being considered a vital and essential area in the economic and social development of a country, it received most of the allocated funds, of €26 billion, through the “Connecting Europe” mechanism (the financing instrument to be used during the 2014-2020) for investment in transport, energy and ICT infrastructure.
Literature Review
The situation of transport of passengers by types of transport in Romania
The urban environment presents the greatest challenges to transport sustainability. Therefore, the public transportation needs to gain a larger share in the present than other means of transport to become easily accessible to all, to be perfectly integrated and to be carried out by non-motorized means. The use of integrated electronic tickets and smart cards may provide operators and public transport authorities with real-time statistical data on user behavior. By complying with the legislation regarding the protection of personal data, this information can be both used to optimize the planning of the service and to design market strategies aimed at increasing the use of public transport.
In a research study by the Ministry of Transport (2008), we can see that over the last 20 years, Romania has designed its public transportation policies which contretemps of the ones of the EU and of its own long-term interests. Romania currently has just over 500 kilometers of motorway in operation and about 250 kilometers of motorway under construction.
The overall transport objective in line with the Sustainable Transport Strategy for 2007-2013 and 2020-2030 developed by the Ministry of Transport (2008) is the balanced development of the national transport system in order to provide modern and sustainable transport infrastructure and services and the sustainable development of the economy and to improve the quality of life. The achievement of this general objective allows on one hand, for a sustainable development of the transport sector, the economy and the environment, and on the other hand it contributes to increase the degree of accessibility of Romania, ensure the inter-modality of the transport system, promote the balanced development of all the modes of transportation and improve the quality and efficiency of services.
The specific objectives which are to be taken into account for the achievement of the general objective according to the Strategy for sustainable transport developed by the Ministry of Transport can be classified as: modernizing and developing the transport network of European and national interest, increasing the safety conditions and the quality of the services, liberalization of the internal transport market, stimulating the development of the economy and competitiveness, strengthening social and territorial cohesion at regional and national level, and compatibility with the environment. Improving the public passenger transport services in Romania aims at achieving a minimum commercial speed of 60 km/h between origin and destination (with a maximum waiting time for 1 hour regarding transshipments) by 2020 and 65 km/h until 2030.
Currently, a new law project regarding the public passenger transport beginning in 2017 is publicly debated at the Ministry of Regional Development in Romania. The project classifies and defines the public passenger transport service according to the deployment area (local, metropolitan, by county), to the type of public transport (buses, trolleybuses, trams, subways, trains) and the used transport infrastructure (road, rail, naval). In order to streamline and facilitate the development of an integrated intermodal public transport service at the level of the metropolitan areas and urban agglomerations, the project proposes the establishment of intercommunity development associations having the public passenger transport service called metropolitan public transport associations as their object.
According to the National Statistics Institute of Romania (2012), the public passenger transport registered a decrease at the passenger transport indicators and their journey in 2011 compared to 2010 by 6%. Regarding the local public passenger transport, , the local and road public transport types registered a positive evolution both in the number of passengers transported and their journeys; according to the National Statistics Institute of Romania in 2013 compared to 2012. The number of passengers transported in international and interurban transport increased by 3.6% compared to 2012, and most passengers traveled by buses and minibuses in the local public transport. In 2014, the average passenger transport distance was higher than in 2013, registering a 4.3% increase in road transport.
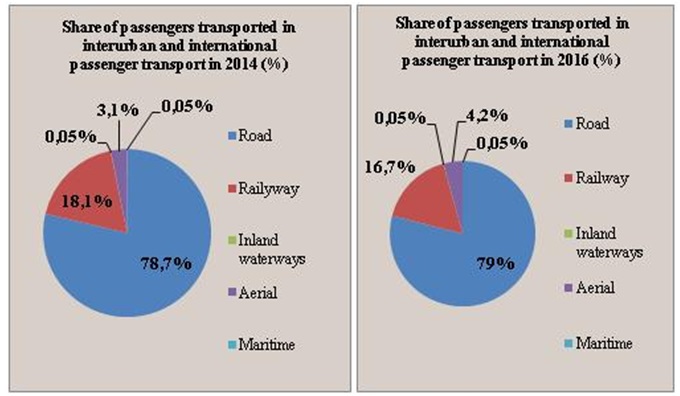
In the year 2015, a total of 355.5 million passengers were transported, of which 4.3% were registered in the international passenger transport (15.2 million passengers). The road transport of passengers accounts for the highest share (77.5%) followed by the rail transport (18.7%). At the same time, the average passenger transport distance in 2015 was higher than in 2014 regarding the rail transport. In conclusion, during the period of 2014-2016, the passenger transport registered an upward trend in the number of passenger transportation by modes of transport according to the Romanian National Institute of Statistics (2015) (see Figure 1). It is noticed that passenger road transport held the largest share of 78.7% and 20% respectively in 2014 and in 2016.
Although this is followed on the second position by the rail transport with shares ranging between 18.1% in 2014 and 16.7% in 2016, there is a decrease of 1.4% of passengers transported on this type of transport. Air transport registered an increase of 1.1% in the analyzed period as shown in Figure 1 due to the expansion of the spaces needed to increase mobility at the Otopeni International Airport as well as the diversification of the services provided by the air transport companies.
Fig.1: Share of passengers transported in interurban and
International transport in 2014 and 2016
Source: National Institute of Statistics (2015)
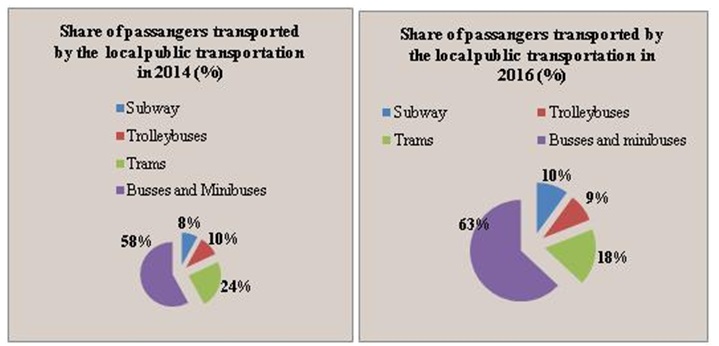
The share of the passengers transported with the subway as well as those carried by buses and minibuses in 2016 increased by 2% and 5% respectively compared to 2014 (see Figure 2). Regarding the international road freight transport in 2015, 92.2 % of all the unloaded goods came from the Member States of the European Union, while 91.6% of all the loaded goods were destined for the Member States of the European Union. The largest quantities of goods came from Germany (20.1%), from Italy (12.5%) and from Hungary (11.9%), while 19.2% of the cargo volume was destined for Germany, 13.7% for Italy and 11.4% for Hungary. This percentage of the international merchandise transport by 92.2% of the total goods unloaded in 2015 is lower than in 2014 by 93.6%. This decrease is due to the decrease in the weight of goods unloaded from Germany by 5.5% in 2015 compared to 2014. (National Institute of Statistics, 2016)
Fig.2: Share of passengers transported by local public transport in 2014 and 2016
Source: National Institute of Statistics (2015)
Romania correlates the objectives of European policy in the field with national policies that take into account the country’s development needs in all transport sectors – air, road, rail, naval and multimodal. The reflection of the national objectives is ensured by the Master Plan of Transport presented by AECOM (2015) which was agreed by the European Commission. Therefore, it can be assumed that a transportation model is a computerized representation of the movement of persons, goods (trips) and vehicles within the framework of the transportation system in accordance with the Master Plan of Transport of Romania. This aims to create an image of the way of how the travel behavior, the travel patterns and the requests will react, over time, to policy, infrastructure or service changes.
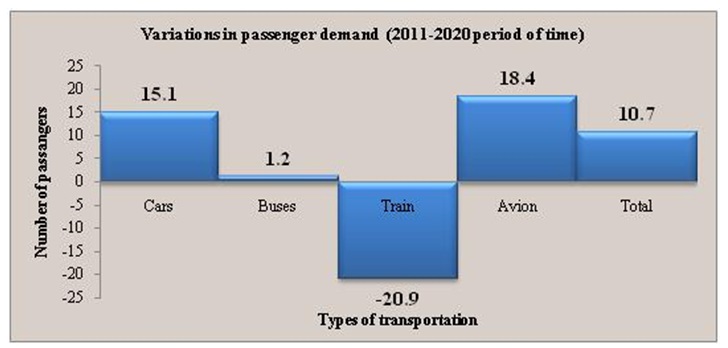
The National Transport Model in accordance with the Master Plan uses a series of economic and demographic factors from Romania and its neighbor countries as input for the forecasting scenarios, plus the conditions and the structure of the network. The main factors influencing the demand forecast are the GDP, the population, the employment, the active population and the degree of motorization. The results of the National Transport Model are of the form of the absolute travel requests and variations between the basic and the prospective years. Figures 3 and 4 presents the expected changes at the modal passengers’ demand level between the 2011 baseline and 2020 baseline scenario, both in terms of number of travels and passenger / merchandise kilometers.
Fig.3: The variation in passenger demand between 2011 and the 2020 Reference Scenario
Source: MNT AECOM (2015)
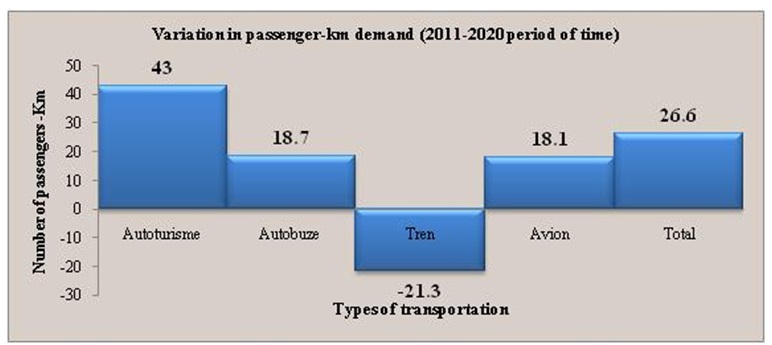
Fig.4: Change in demand for passenger transport between 2011 and the
2020 Reference Scenario
Source: MNT AECOM (2015)
The total increase in the number of daily journeys in the 2020 Reference Scenario is projected to be of 10.7% and the number of passengers-km is estimated to increase by 26.6%. We can appreciate that the Romanian motorization level is still at relatively low levels, which means it is expected to increase significantly in the future. In 2011, 19.3% of the population owned a car, a percentage which will increase to 23.7% in 2020. With the increase in motorization, the proportion of the “captive” population of public transport is decreasing. AECOM (2015) mentioned that this reduction in the captive market changes the dynamics of the public transport sector, which is in an increasingly intense competition with the road sector (private car transport) for the population with an available car.
Bus journeys are forecasted to increase slightly by 1.2%. At the same time, the bus sector will be negatively affected by the increase of the motorization degree but will benefit from significant investments in the development of the motorway network which leads to improved timescales way. Traveling with cars is projected to increase by 15.1%, reflecting the increase in motorization and the scale of investment in the road network.
In conclusion, we can state that the macroeconomic and sectoral analyzes of the National Development Plan 2007-2013 made by the Ministry of European Funds (2012) on one hand, stood at the basis for the forecast of Romania’s future economic development but also contributed to the estimation of traffic flows in different regions of the country on the other hand. All of these analyzes were also correlated with the Strategic Concept for the Integration of the 2007-2025 Territorial Development in the European Space Structures, as transport represents an important sector of the economy both in terms of its direct contribution to the creation of the internal gross product and in terms of its role in the movement of goods and implicitly in the realization of the gross added value of the other branches.
According to the Romanian statistics, the number of serious accidents decreased from 9,000 per year in 1990 to 6900 in 2003. However, recent data shows that the number of serious accidents increased by 5.3% between 2004 and 2005, and the number of people killed in road accidents increased by 8.2% over the same period.
The situation of passenger transport at U.E. level in accordance with the Europe 2020 Strategy U.E transport policy
At the heart of the transport policy of the European Union are the citizens of the Europe 2020 Strategy. In this regard, the European Commission aims to develop and promote efficient safe and sustainable transport policies, create the conditions for a competitive industry and generate jobs and prosperity. European transport policy is one of the first common European policies; its legal basis was established in 1957 by the Treaty of Rome. The main purpose of this policy was to liberalize the services and open up transport markets in order to facilitate the realization of the Internal Market. Thus, transportation contributes to the realization of the two fundamental freedoms of the European Internal Market, namely; the free movement of persons and goods. The third freedom; the one of the free movement of services, is also indispensable for the realization of a pan-European transport policy under the conditions of the competitive market access for all the transportation operators which are active in the EU.
A negative aspect, in terms of the transport activity at the European level is that even today the transport infrastructure is not evenly distributed in Europe. In many countries that have recently joined the European Union, there are no high-speed rail links. At the same time, on average, the motorway networks in these countries are much less developed than in other Member States. In addition to the need of building the missing links, much of the EU transport infrastructure needs to be expanded and improved as mentioned by the Ministry of Foreign Affairs (2016). This is why the need of establishing the Trans-European Transport Network (TEN-T) appeared; a long-term project, which has a purpose of modernizing and connecting national networks to create an interconnected network linking all European regions, using different means of transport most efficiently.
After the expansion of the E.U. (in 2004 and later in 2007), connecting with new Member States has become a priority objective at European level. In conclusion, TEN-T involves a single multimodal European transport network (covering all modes of transport: land, sea and air), provides international connections and allows goods and people to move quickly within the Internal Market. The creation of these networks, together with the interconnection of national networks, aims at the establishment of links between the peripheral points of the European Union and its central area.
A TEN-T review process started in 2008, materialized by the publication by the European Commission of the proposal for a Regulation regarding the new guidelines of the trans-European transport networks and of the proposal for a Regulation establishing a financial instrument Facility regarding the connection of the Europe. It is therefore necessary to rationalize the differences between the national transport policies in order to avoid the distortion of the competition and to remove the barriers which prevent the market access.
In 2011, the European Commission launched a new visionary exercise – The White Paper regarding the future of transport policy for the 2050 horizon, which focuses on sustainability (reducing the environmental impact as the transport consumes about 30% of the EU-generated energy) and further liberalization. This sets the following main objectives: reducing Europe’s dependence on oil imports, improving the environment, reducing the number of accidents and significantly reducing greenhouse gas emissions. These objectives as stated by Ministry of Foreign Affairs (2016), must be accommodated in the context of a continuous increase in demand for transport, differences in transport modalities, demographic change and the weakening of public investment capacity.
Another objective of EU transport policy according to the European Commission (2016) is to help and protect citizens when traveling. Therefore, the EU policy in the transportation domain aims, in line with this objective, to ensure that all travelers benefit from the same basic treatment standards wherever they travel within the EU. The travelers already enjoy a series of rights that cover various aspects such as travel information, reservations and ticket prices, prejudice to their baggage, delays and cancellations, or difficulties encountered with their holiday packages. In view of this, the EU legislates to protect passengers’ rights in the different types of transport.
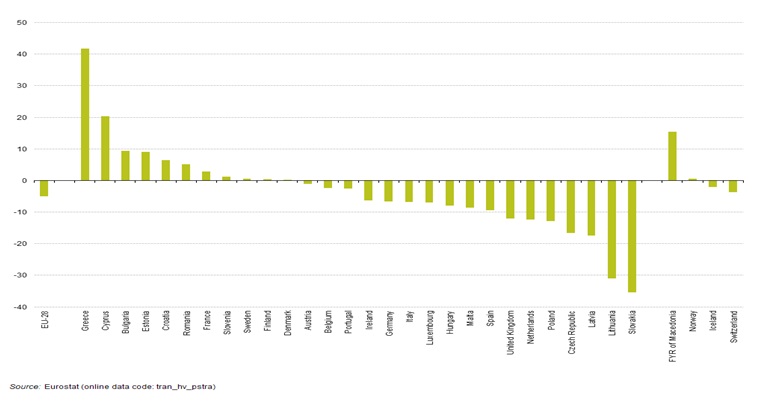
Every year, Eurostat presents the situation regarding the transport activity with the help of statistical data both at a European and a world level. Thus, in the article Statistics regarding the passenger transportation of 2017, they provide details on the most recent situation and the latest evolutions in the statistics on passenger transport within the European Union. This article provides information on the transport of passengers by means of transport. Of all of those, the main type of passenger transport according to Eurostat is the car, fueled by the desire to have more mobility and flexibility. Using mostly the car as a means of transportation by the travelers throughout the EU, has contributed to a high level of congestion and pollution in many urban areas and on many major transport corridors. In a small proportion of the EU Member States, the rate of change in GDP in constant prices was higher than the rate of change in domestic passenger transport over the period 2004-2014, leading to a decrease in the ratio between passenger and GDP- in constant prices (Figure 5).
Fig.5: Change in the domestic passenger transport index relative to GDP, 2004-2014, (%)
Source: Eurostat, 2017
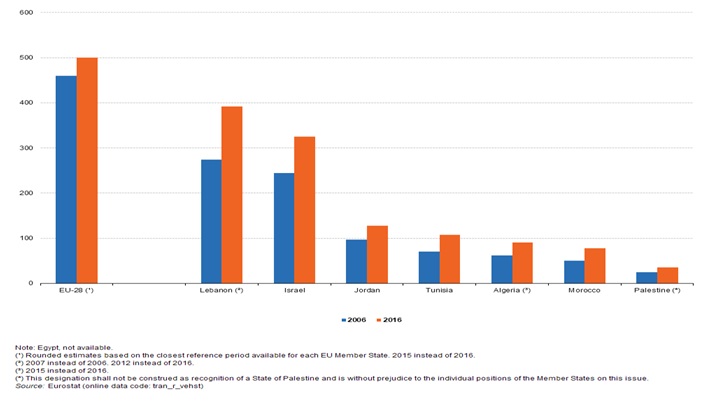
In contrast, the reverse situation was observed in 11 Member States, particularly in Greece and Cyprus and to a lesser extent, in Bulgaria and Estonia reflecting a strong increase in passenger transport and / or poor economic development. By contrast, the rate of change in GDP in constant prices was 35.4% higher than the one of the domestic passenger transport between 2004 and 2014 in Slovakia, while in Lithuania the difference was of 31.0%. Among the non-member countries shown in Figure 5, the index of domestic passenger transport relative to GDP increased significantly in the period studied in the former Yugoslav Republic of Macedonia and, to a much lesser extent, in Norway, while it has decreased in Iceland and Switzerland. In such regards the evolution of the motorization rate (number of cars reported to the size of the population) at the EU level in 2006 and 2016, according to Eurostat, is shown in Figure 6.
The motorization rate (Fig.6) shows the number of passenger cars relative to the size of the population. Lebanon had the highest motorization rate among the ENP-South countries for which the data are available, 391 per 100 000 inhabitants (2012 data). This was followed by Israel with a rate of 325 per 1 000 inhabitants in 2016, which was two and a half times as high as the next highest rate, 128 per 1 000 inhabitants in Jordan. The lowest motorization rate among the ENP-South countries was 35 per 1 000 inhabitants in Palestine as seen on Eurostat (2017) website.
In conclusion, with the help of TEN-T, EU intends in the future to form a primary network by 2030, completing the missing cross-border links to create a smarter network, setting clear deadlines so that all the projects will have priority in the transport field.
Fig.6. Motorization rate – number of passenger cars reported to the size of the
population, 2006 and 2016
(number per 1 000 inhabitants)
Source: Eurostat, 2017
That is why we must emphasize that the European Commission’s objectives (2014) (reducing the number of accidents, the energy efficiency of transport, increasing the rate of usage of trains and labor force, improving the quality of the workplace in the field of transportation, developing the infrastructure, and so on) which are contained in the White Paper of Transport – the future of transport policy, remain valid nowadays despite the efforts made by the Member States to meet them. In order to achieve these objectives, the access to quality transport infrastructure and services must be guaranteed, with the support of research, innovation and a long-term solid financing. “Intelligent, clean and integrated transport” is one of the main challenges targeted by the “Horizon 2020” research funding program for 2014-2020, which is essential for Europe to remain at the forefront of technological advances in the field.
Research Methodology
The process of knowing the evolution of the transport services in Romania in the context of sustainable development had in mind the organization and passing several distinct and successive stages that included data observation or data collection, systematization and processing operations, analysis and interpretation of results and formulating the conclusions. The statistical information for the macroeconomic indicators characterizing the transport sector in Romania (the number of transport employees, the net investment in transport activity, the gross earnings, passengers’ travel, and so on) was taken from the Statistical Yearbook of Romania published by the National Institute of Statistics, for a period of 17 years; respectively the interval of 2001-2017. At the same time, the taking of the data from the statistical publications allowed the use of simple (elementary) characterizing of the methods of transport in the first phase, such as: the graphic method and the structural modification method.
The analysis and the stochastic modeling that was used in the second part of the paper (the multiple regression and correlation, testing the validity of the regression model and measuring the intensity of the multiple correlations) were performed using Excel and EViews that are two database management and analysis softwares. According to Andrei, Stancu, Iacob et al (2008), these allowed the data transformation, the correlation testing, and the causality testing between the variables considered.
The multiple linear regression model used in the paper in order to study the dependence of a dependent / endogenous variable (the production of road transport means), Y and k-1 independent / exogenous variables x2, x3, …, xk (the gross average earnings in transport and storage activities, as well as a random variable e), was described by the following set of equations:
The phenomena in economy and society are complex and usually require more than one explanatory variable to be analyzed and understood. Therefore, in order to determine the effects on a dependent variable, one of the most common approaches is the multilinear regression model, which is also applied in this research as stated by Bager, Roman, Algelidh, Mohammed (2017).
In conclusion, we can say that in the future, the relationship between the macroeconomic indicators in the field of transportation included in the multiple regression model could also be re-established at the European level by
using more advanced econometric techniques as mentioned by Dumitru-Vlădulescu, Musat (2017), such as the data panel which integrates both numerous independent variables and different temporal and spatial variables.
Results and Discussions
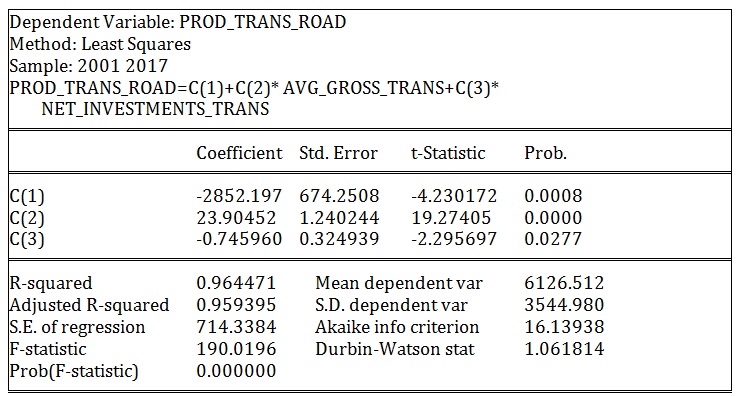
Analyzing the evolution of the production of the road transportation means as a dependency variable in the period 2001-2017 according to the causal variables; the monthly gross average earnings from transport and storage and the net real investment from transport and storage activities, there were obtained the following results of the function multiple regression using the multifactor linear regression model with the EViews software (see table 1).
The coefficient has a negative value of 2852.197. It does not have an economic significance. It represents the teaching personnel when the other factors do not have influence. Since t =-4.23 and p-value = 0.00<0.05 it means that the coefficient is valid for a significance level of 0.05.
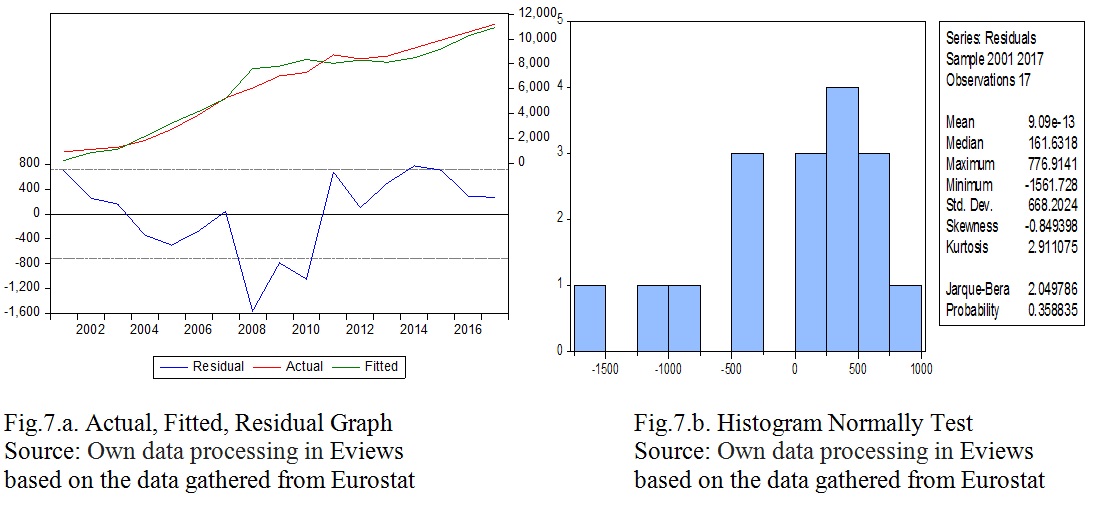
The regression coefficient β1 is 23.90, which means that with the increase by one euro/employee of the monthly gross average earnings from transportation and storage, the production will increase with 23.90 million Euros. The regression coefficient β2 has the negative value of 0.74, which means that with the increase of 1 million Euros of the investments made in transport and storage, the production will decrease by 0.74 million Euros. From the correlation chart, we can say that the points in the graph network (Fig. 7.a) are evenly distributed without any disparities between them; therefore, we can conclude that the linkage between the variables included in the linear multifactorial regression model that characterizes the transport domain is linear, direct and significant.
Table 1: The multiple correlation between the production of road transportation means as the dependent variable and the evolution of monthly average gross earnings from transport and storage, real net investment from transport and storage as independent variables in Romania
Source: Own data processing in Eviews based on the data gathered from Eurostat
By applying the statistical tests known to verify the significance of the parameters of the model, the significance of the model and the OLS assumptions, it was found that the estimation results and the model were statistically significant for a significance level of 5% for all the independent variables included in the model.
The OLS assumptions are verified for the same level of significance, including the hypothesis of autocorrelation error which was tested using the Durbin-Watson test. The DW statistics recorded a calculated value of DW = 1.06, which was compared with the critical statistical values for α = 0.05, p = 2 and n = 17; d1 = 1.13 and d2 = 1.38 suggests that the errors are positive autocorrelated. Using the EViews software to calculate the Jarque-Berra test (Fig.7.b.), it was found that χ and that p(JB) = 0.35 so it can be appreciated that the assumption of the normality of errors is rejected. The dependence of the variables included in the linear multifactorial model of regression was measured with the multiple correlation coefficient, equal to 0.98. It was appreciated that between the correlated variables there is a linear, direct, and meaningful dependency. The independent variables included in the linear multiple correlation model account for 96% of the change in the production of road transport vehicles, the difference of 4% being represented by the influence of other factors not included in the model, such as the average number of employees in the transport and warehousing sector, the number of passengers transported, the retail of motor fuels, and so on. The validity of the multifactorial linear regression model and the multiple correlation ratio (Ry/x1,x2) based on the Fisher criterion led to the following conclusion: Fcalc = 190.01> Fcritical = 3.74, so it can be assumed that the regression model and the multiple correlation ratio are true and correctly identified form a statistically viewpoint, characterizing a real link for a significance threshold of 0.05 and it can also be used to analyze the dependence between the variables included in the model.
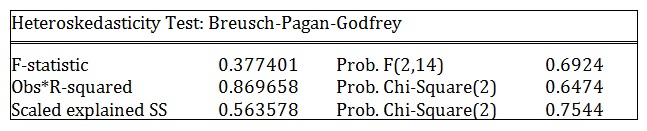
To determine the errors, autocorrelation empirical methods were used such as the Breusch-Godfrey test. With this test, the existence of the autocorrelation of order k, k 1 was analyzed. It was assumed that the error of the regression model is given by the equation:
By applying the statistical software (EViews), it was determined that the statistical probability F is 0.94 (high) and Fstatistic< Ftable (0.06< 3.80) meaning that the errors are homoscedastic (Table 2).
Table 2: Heteroskedasticity Test
Source: own computation based on the data gathered from Eurostat, 2018
Conclusion of the study: Given the fact that the main type of passenger transport, according to the analyzes made by Eurostat, is the car fueled by the desire to have more mobility and flexibility, the production of road transportation means was analyzed as a dependent variable. It was also taken into account the fact that the means of road transportation have more than 75% of the passenger transport in Romania, being the main way to ensure the mobility of the persons as mentioned previously in the paper. The linear multifactor regression model points out that the dependencies of the variables included in the model are significant and have an important role to play in implementing the EU transport policies. Because, according to the Europe 2020 Transport Strategy, in terms of transport, there are the citizens, so their living standards, the degree of satisfaction of their needs and their gross average salary are crucial in order to achieve this goal. At the same time, the interurban transport is very present in the urban environment and directly leads the evolution of the urban transport system and the city itself through: activities in the railway stations, ports and airports, access roads and belt lines, the metro in Bucharest and railway infrastructure. That is why there was considered the actual net investment in transport as a significant factor in building our linear multifactor regression model.
Conclusions
Achieving an integrated and sustainable urban transport system is the European Union’s main objective in line with the Europe 2020 Strategy. In this context, the interurban transport – urban transport link is essential for realizing a sustainable and durable transport. Thanks to the EU policy, the European transport sector has made considerable progress over the past 20 years, for example: increasing the safety of maritime, air and road transport, diversifying and modernizing transport for passengers and companies, reducing pollution, ensuring better working conditions for employees in the transport sector, and so on. Still very economically important are the grants from the state budget in the urban transport and the basic norms related to transport services which have a decisive influence on the development of transportation systems.
In Europe, an important factor is the aging of the population which will force the transport services to adapt to an elderly population. People who are 65 or over will account for 29% of the total population by 2050, up from 17% nowadays. Quality, reliability, security and affordability, especially for people with reduced mobility, as well as the safety of public transport will be essential for the greater use of public transport as mentioned by the European Commission (2009). For Romania, the objective of reducing the gaps and deficits in infrastructure over the rest of the EU remains a priority. As a country at the border of the Union, it is also relevant for Romania to develop transport links with the non-EU neighboring countries at European standards. In order to complete the internal market, it is essential to have suitable interconnected transport links between the 28 Member States which take part of the structure of the European Union. In this purpose, the missing links must be built and the numerous technical and administrative obstacles must be removed in order to ensure the fluidity of traffic and to facilitate trade, avoiding unnecessary bottlenecks in the European transport system.
Modernizing the urban transport systems and increasing their quality can be achieved by adopting an efficient management system on both the specific route and the whole system. The European Commission’s directives and action plans developed over the past few years have as primary goal the development of the Pan-European transport infrastructures with implications up to national and urban transport. In this context, the analysis of the possibility of alternative means of transportation in many administrations (public transport and private transport) and also the encouraging of bicycle transport are taken into account.
Regarding the current situation in the transport sector in Romania, it should be noted that about 90% of the national network is on the normal one-way standard road, which has an impact on travel time and safety. Compared with the rest of Europe, in Romania, the level of motorway supply is very low. Thus, recent European statistics comparing the level of motorway supply across all national / main roads, place Romania on 30th out of 31 (for countries with relevant data available). This aspect has a negative impact on the reliability of the road network for business and economy. At the same time, Romania faces a significant problem in terms of road accidents compared to other EU countries.
In Romania, transport policy pursues continuous alignment of the national transport system to the principles of the Community Transport Policy defined in the White Paper on Transport (with the related updates) and the sustainable development requirements of Romania. In this context, the fundamental problem facing Romanian transports is the relatively low infrastructure quality compared to the objectives of the White Paper and the European Sustainable Development Strategy, especially in terms of territory coverage with speed transport networks which will facilitate significantly the free movement of goods and services. The insufficient capacity of the infrastructure network in Romania has diminished the degree to take over the growth of freight and passenger traffic in some areas (especially the entries into big cities) at certain times of the year (especially summer and winter in the mountain area, weekends, and so on) or in the case of some accidental events (snow, storms, accidents). This situation led to an increased congestion with direct consequences on the risks of worsening the transport quality parameters and non-implementation of the objectives of the White Paper.
The access to Pan-European corridors is hampered and limited by traffic and low quality of certain elements of the transport infrastructure in Romania, being in a situation to disrupt the free movement of goods and persons and to diminish the international traffic of goods / passengers that transit through Romania.
The situation of the national transport network was the main factor which has led to diminishing the possibilities of developing the opportunities offered by Romania’s geo-political position, namely; its position at the intersection of roads connecting the eastern to western Europe and southern to northern Europe, as well as being the location of the transit axes which links Europe to Asia; having the Danube River and opening to the Black Sea. Finally, the road policies that the Romanian Government intends to promote are: the reconfiguration and the development of the public roads network and the reorganization of the national public roads administration.
Therefore, the originality of this study as also mentioned by Ionel et all (2017) is emphasized by the merging and correlation of elementary statistical methods with correlation and regression methods, which have the effect of simplifying the calculations and conclusions, knowing that it is very difficult to quantify the multitude of all causal factors acting on a phenomenon or economic –social-process.
AECOM (2015). Master PlanGeneral de transport al României. Variantă finală revizuită a Raportului privind Master Planul pe termen scurt, mediu și lung, Guvernul României și Ministerul Transporturilor.
Andrei, T., Stancu, S., Iacob, A.I., et al, (2008).Introducere in econometrie utilizand Eviews București: Economica Publishing house.
Brebbia C. A., Miralles J. L. (2015) Urban Transport XXI. Ashurst Lodge: WIT Press.
Bager,A.,Roman,M., Algelidh,M., Mohammed,B.,(2017). Addressing Multicollinearity in Regression Models: A ridge Regression Application. Social and Economic Statistics Journal, vol6, (1), 2017
Comisia Europeană (2009). Raportul din 2009 privind îmbătrânirea populaţiei: proiecţii economice și bugetare pentru statele membre ale UE-27 (2008-2060). [Online] [Retrieved February 14, 2018], http://ec.europa.eu/economy_finance/publications/publication14992_en.pdf.
Comisia Europeană (2014). Să înţelegem Politicile Uniunii Europene.Luxemburg: Oficiul pentru Publicații al Uniunii Europene. Retrieved on 14 February 2018, from https://europa.eu/european-union/topics/transport_ro
Comisia Europeană (2016). “Raport al Comisiei către Parlamentul European și Consiliu privind situaţia pieţei transportului rutier de mărfuri în Uniunea Europeană”. [Online] [Retrieved February 14, 2018], https://ec.europa.eu/transparency/regdoc/rep/1/2017/RO/COM-2017-282-F1-RO-MAIN-PART-1.PDF
Dumitru-Vlădulescu, C.M.,Musat, I., (2017).Efectele activităţii de transport asupra factorilor de mediu. Revista Română de Statistică – Supliment nr. 3 / 2017.
Eurostat (2017). Statistici privind transportul de călători. [Online], [Retrieved February 14, 2018], http://ec.europa.eu/eurostat/statisticsexplained/index.php?title=Passenger_transport_statistics/ro&oldid=352968.
Gheorghe, I., (2001). Managementul transporturilor : Partea a 3-a : Transportul public urban de pasageri, Eficient Publisher, București.
Ionel, D., Ciobotar, N.G., Cristache, S.E. Rotaru, F.G., (2017). The Effects of Smoking on the Health of the Urban Population. [Online] ASE Publisher House. [Accessed on February 12, 2018]. Available: http://www.etimm.ro/wp-content/uploads/ETIMM_2017_Abstract_Volume.pdf
Institutul Național de Statistică (2014). Transportul de pasageri și Mărfuri pe moduri de transport, în anul 2013, 8-10, București, Institutul National de Statistica Publishing House.
Institutul Național de Statistică (2015). Transportul de pasageri și Mărfuri pe moduri de transport, în anul 2014, 8-10, București, Ed. Institutul National de Statistica Publishing House.
Institutul Național de Statistică (2016). Transportul de pasageri și Mărfuri pe moduri de transport, în anul 2015, 8-10, București, Institutul National de Statistica Publishing House
Mihalache,I., Păduraru,I.,(2015). Caracteristicile transportului public urban de călători. AkademosJournal, 3(38) Chișinău, [Retrieved February 12, 2018]. Available: https://www.twirpx.com/file/2045672/
Ministerul Transporturilor (2008). Strategia pentru transport durabil pe perioada 2007-2013 şi 2020, 2030.Guvernul României. [Online] [Retrieved on February 12, 2018]
Ministerul Fondurilor Europene (2012). Planul Naţional de Dezvoltare 2007-2013. [Online] [Retrieved February 12, 2018] from http://old.fonduri-ue.ro/documente-programare/pnd-2007-2013
Ministerul Afacerilor Externe (2016). Politica europeană în domeniul transporturilor. [Online] Retrieved February 12, 2018] from https://www.mae.ro/node/12111
Politica Rutieră (2012). Strategia Naţională pentru siguranţă rutieră 2013 – 2020. [Online] [Retrieved February 12, 2018] https://legestart.ro/wp-content/uploads/2013/04/3_12-Anexa.pdf
Romania’s Statistical Yearbook (2016) edited by the National Institute of Statistics.