Introduction
From the early stage of the existence of an economic entity, studies show that it is susceptible to circumscribe its activites to either internal or external growth strategies (Gaughan 2010; DePamphilis 2010; Meier & Schier 2012). They can be built around short, medium or long-term goals, including: reaching certain levels of profitability, penetrating new markets, accessing new financial markets, etc. Mergers and acquisitions are external growth strategies that entities can use when they conclude that ongoing collaboration with another company (or more than one company) would lead to future increases in economic benefits or to savings on the cost of capital. The motivations behind the decision for which companies engage in such external growth operations differ from case to case. However, we retain the most invoked ones in the merger projects, as follows: increasing the power of domination and influence, acquiring specific resources, gaining a position on a new market, strengthening the position in mature sectors, adapting to technological developments, eliminating an inconvenient competitor, decreasing administrative expenses, expanding the activity due to economies of scale, the limitation of the possibility of entering a specific sector. As we can notice, some of the afore-mentioned motivations are related to an offensive strategy, others to a defensive one.
In most of the studies and scientific papers, the expression predominantly used, dedicated to these types of strategies, is mergers and acquisitions, the acronym being M&As. Although each of the two types of operations, taken separately, has its own characteristics, they are often presented together (Qudaiby & Khan 2013).
By far, the largest number of M&As took place in the US, followed by the countries from Europe. More recently, new geographic areas have become active concerning these operations, such as Brazil, Mexico and China. Regarding their time evolution, it is worth mentioning that we can talk about an evolution in the form of cyclic waves. Scientific research confirms that mergers and acquisitions take place in waves, and that they affect certain sectors of activity (Adolph 2009). If we take a closer look at the situation of the United States of America, researchers identified six such waves, the highest value being recorded in 2007, representing a number of 2,206 mergers, totaling 16.677 billion dollars.
In Europe, until 2016, researchers have identified only four waves of mergers and acquisitions. The first wave took place during the 1980s (1987-1991), the beginning being marked by the year 1986, the year when the Single European Act (SEA) was signed (February 17, 1986), which allowed the creation of the Internal Market of the European Union (January 1, 1993) (Sehleanu 2013). The peak of this wave was represented by 148 mergers with a total value of 7.861 billion euros. The second wave of M&As took place at the end of the 1990s (1997-2000), which, at a mere three years, was followed by a third wave that began in 2003 and ended in 2007, with the advent of the first signs of the financial crisis. The two cycles were roughly similar in size, representing 1.586 and, respectively, 1.781 mergers and acquisitions. As for the total values of these operations, they were quite close, 18,364 million euros in 2000 and 18,624 billion in 2007, respectively. The 2009-2013 period of time was marked by smaller oscillations. What we can notice, however, is that 2013 marked the beginning of the fourth wave. The data show steady increases until 2016, when the maximum threshold of 18.067 billion euros, from more than 1,000 mergers, has been reached. From the forecasts, we can not say with certainty that 2016 is the peak of this fourth wave. Although the situation in December 2017 shows a slight decrease in the number of mergers to 859 operations, with a total value of 14.523 billion euros, IMAA (2017) provides a growth forecast to 922 mergers, with a total value of 15.521 billion euros. We believe that this increase, registered in the period 2013-2016, was tempered by the Eurozone disturbances generated by the UK’s leaving the European Union, the first triggering Article 50 of the Treaty of Lisbon on March 29, 2017. This event led to a seism on financial markets in Europe, as well as to the relocation of financial giants from London to other European cities (JP Morgan, Deutsche Bank, Morgan Stanley, Goldman Sachs, Bank of America, Citigroup and many others). Considering the above-mentioned, related to the peak of the wave registered in 2016 in Europe, we consider relevant the analysis of M&As situation in Romania for the year.
Focusing only on merger operations, our research aims to analyze and identify a series of features of the most recent mergers in our country for the year 2016.
Research Design and Methodology
Through an empirical, descriptive research, we will study the merger operations in Romania, for the year 2016, aiming at identifying and presenting the characteristics of the studied phenomenon. The mergers involving unlisted companies on the Bucharest Stock Exchange will be analyzed, the merger projects being published in the Official Gazette of Romania, part IV. The sample analyzed for 2016 consists of 255 merger projects involving 591 companies. This number, relative to the total number of 105.982 active companies (NTRO, 2016), registered with the National Trade Register Office, represents a weight of 0,56%. In order to achieve the research objective, we will use the documentary analysis, especially of the accounting and legal documents (merger projects, financial statements, articles of incorporation, decisions of the General Meetings of Shareholders).
For the data collection, we used the observation method, considered useful to highlight the characteristics of the 591 participating companies and understand the motivation behind the mergers.
The Results of the Research
Considering the complexity of the mergers and in order to create the most complete picture regarding the approach of these strategies in Romania, we will take into account 14 criteria for the analysis of the merger projects, criteria that will help us draw some pertinent conclusions about the image of these strategies at the national level. To this end, we will consider grouping the above-mentioned criteria according to certain common features.
The Analysis of Mergers Based On Geographical Criteria
Starting January 1, 2007, Romania is a member of the European Union, which was an eveniment that has facilitated the economic development that followed. The opening to new markets allowed a part of the Romanian economic entities to expand their activity abroad, which led to the creation of merger opportunities with entities from other EU countries and beyond. However, the phenomenon did not show any particular magnitude, given the small number of such mergers. Thus, in the year 2016, of the total of 255 merger projects, 10 of them involved, as abidder or a target company, a non-resident company, the remaining 245 being domestic mergers. In this context, we note a 96,08% share of domestic mergers in the total merger projects drawn up in the year 2016.
Concerning merger projects involving non-resident companies, representing 3,92% of the total, we mention that these types of operations are recognized in the literature as cross-border mergers, which are considered to be an important phenomenon in the global economy (Neary 2007). The number of entities participating in such operations is 20, 10 of them being from Europe, i.e. from Ireland, Belgium, Hungary, Italy, Luxembourg, Spain, and Slovenia. In figure 1, following the direction of the arrows, it is possible to identify the country of origin of the bidder company, respectively of the target one.

Fig. 1: Countries of origin for the entities that participated in merger operations in Romania
Source: Own processing
We observe the interest of economic entities from Western Europe in the Romanian merger market, although the number of cross-border mergers involving resident companies is quite small. Taking into account the FTSE Country Classification, Romania is a frontier economy, where foreign direct investments provide an important and stable source of external financing for low-capital countries (FTSE Criteria, 2017). Taking into account their legal form, the Romanian entities involved in cross-border merger operations are mainly joint stock companies, respectively nine entities, and a limited liability company. Out of the nine companies, five were bidders and the rest were targets.
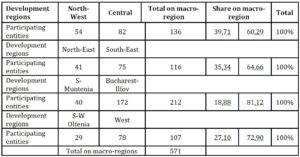
Returning to domestic mergers, we considered statistically useful to take into account the development regions. In this respect, we consider that a distribution of the merger operations according to the development region of the bidder, respectively of the target company, could be of interest in terms of distribution of operations by geographical area.
Table 1: Participating entities in merger operations on macro-regions
Source: Own processing
Table 1 confirms that most mergers take place in the Bucharest-Ilfov area, given that there is the largest urban agglomeration in Romania, with a GDP/capita, at 2016, of 22,878 euros (INSSE). This is followed, at a considerable difference, by the North-West-Central macro-region, with the fewest mergers taking place in the Oltenia region (29 projects). The conclusions also show that, out of the total of 245 merger operations carried out in Romania, involving 571 economic entities, 21 of these operations took place between entities from different development regions and only 15 projects involved entities from other macro-regions. In Table 1 we can see the number of entities that participated in merger operations, grouped by development regions, then by macro-regions. The share of merger projects in the same macro-region is 93,88%, while 6,12% represents mergers between entities localized in different macro-regions.
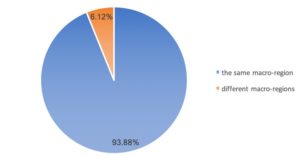
Fig. 2: Distribution of mergers by the macro-region of the bidder entities
Source: Own processing
Although the merger with an entity located in another development region or another macro-region can provide the bidder entity with access to other markets, increase of the market share, access to specific resources, etc., we consider that in Romania the number of this type of mergers is pretty small. A cause of this may be the absence/poor condition of road and rail infrastructure, which poses logistical and transportion problems between points of work. In addition, there is the public perception of different degrees of development, specific to each region.
The Analysis of Merger Projects from the Perspective Of The Typology Imposed In The Romanian Legislation
Analyzing domestic mergers, we identified two projects of merger by consolidation and 243 projects of merger by absorption during the period under review. In the first case, a number of 6 companies participated, resulting in two newly created entities, and, in the latter, 565 entities were involved. The total share of the two types of merger operations is represented graphically in figure3.
Fig. 3: Types of mergers
Source: Own processing
Regarding the total number of registered operations, the mergers by absorption hold 98.95% of the total number of mergers, which determines us to assess that the resident entities in Romania prefer the carrying out of such transactions, mergers by consolidation representing isolated cases (1,05%). Many mergers were based on administrative considerations during the period under review. Also, none of these transactions had a community dimension (the companies didn’t have to notify the European Commission, in order for the Regulation no. 139/2004 to be inforced), so they were applying the national regulation in the matter.
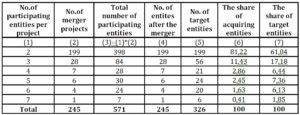
Next, we delimitate the participating entities in two groups as follows: entities subject to restructuring operations (bidder/acquiring entity and target/acquired entity), and entities resulting from restructuring operations (the acquiring entity, respectively the newly created entity), assuming that the merger can take place between at least two entities. In our research, we identified a single merger project with a number of seven participating entities. In Table 2, we present the number of entities involved in merger projects as well as the total number of entities which resulted from the operations carried out.
Table 2: Number and categories of entities paticipating to merger operations
Source: Own processing; the Romanian Official Gazette, part IV.
Taking into account the number of entities participating in merger operations, a dominant typology is emerging, that of mergers with two participating entities. Of the total of 245 operations, in 199 cases, the operation was carried out with the participation of two entities. In the case where three companies are involved in a merger project, we are talking about a bidder and two target entities. Thus, in 28 merger projects, the number of participating entities was 84 entities. Of these, we identified a number of two new entities, created as a result of merger operations. Thus, we can say that in the period under review, 26 entities are acquiring companies, which continue their activity according to the going-concern concept, and two are newly created companies.

Fig. 4: Representation of entities participating in merger operations
Source: Own processing
In figure 4, we can observe a distribution of the companies involved in the merger operations, according to their quality in the process (bidding/acquiring company, respectively target/acquired company).
The Analysis of Merger Projects by NCEA
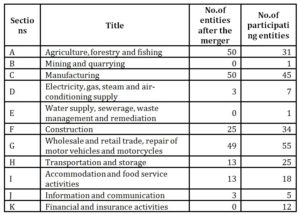
In view of the above, we consider it appropriate at this point to describe the mergers from the point of view of the core activites of the entities involved in merger. In our study we identified that merger operations took place both between entities with the same core activity, and between entities with different business activities. We consider relevant the presentation, in table 3, of the main sections in which the European Classification of Economic Activities (NACE Rev.2) codes are grouped, respectively the number of companies resulting from reorganization per section. We have to mention the fact that national classification is the same as the European one.
Table 3: European Classification of Economic Activities (NACE Rev.2) – main sections
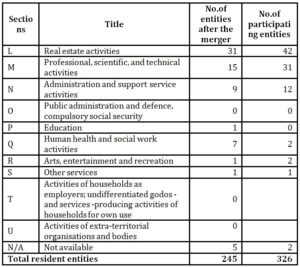
Source: Own processing; European Commission, NACE Rev. 2, Statistical classification of economic activities in the European Community, Eurostat Methodologies and Working papers, Luxembourg, 2008.
In figure 5, we can observe the distribution of the merger operations according to the core activity of the entities resulting from the restructuring operations, respectively 245 acquiring entities. The activities are presented using the sections from Table 3.
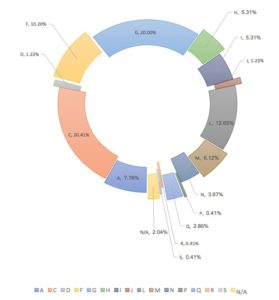
Fig. 5: Distribution of the mergers according to the core activity of the entities resulting from the restructuring operations
Source: Own processing
Thus, during the analyzed period, 119 acquiring entities merged with 143 target entities with the same NCAE code and 118 acquiring entities merged with 173 target entities having a different core activity. The survey shows that, during the analyzed period, most of the merged entities were active in the wholesale and retail trade (20%), manufacturing (20,41%), and real estate transactions (12,65%).
In figure 6, one can observe the core activity of the 326 target entities. In the collection process, we did not identify the business object of a number of 7 entities because it was not specified in the merger project, nor on the website of the Ministry of Public Finance
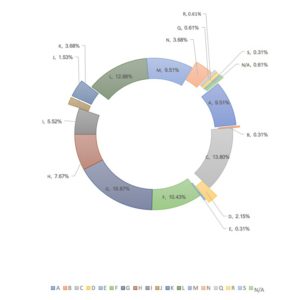
Fig. 6: Distribution of the mergers according to the core activity of the target entities
Source: Own processing
Figure 6 shows graphically the businesses in which the acquired entities were active and we can see that most of them are part of the sections: wholesale and retail trade (16,87%), manufacturing (13,80%), real estate (12,88%), constructions (10,43%) and, on equal shares, agriculture, forestry and fishing (9,51%), and professional, scientific, and technical activities (9,51%).
The Analysis of Merger Projects Taking Into Account the Form of Organization of the Participating Entities
When a company is formed, the owner(s) must choose its legal form. In Romania, the law regulating these issues is the Companies Act no. 31/1990, republished in 2004, which presents the following types of companies: General Partnership (GP), Limited Liability Company (LLC), Limited Partnership Company (LPC), Joint Stock Company (JSC), Limited Joint Stock Company (LJSC). In Romania, the limited liability companies are the most common forms of organizing businesses, because of simplified administrative procedures, high flexibility compared to other forms and low minimum capital, according to the law. Taking into account the aforementioned information, in figure 8 we identify that, during the analyzed period, 516 entities with the legal form of LLC and a number of 55 entities organized as JSC participated in merger operations. Of the total of limited liability companies, 220 entities are the acquiring companies, those that respect the going-concern principle, and 296 entities are those which cease to exist. In the case of the joint stock companies, out of a total of 55 entities, 25 are the bidder companies and 30 are the target ones. We have statisticaly presented these data without taking into account whether an acquiring limited liability company merged with a joint stock company or vice versa.
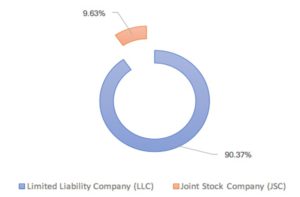
Fig. 7: The legal form of merging entities
Source: Own processing
In figure 8, the distribution of mergers according to the legal form of the participating entities is presented and we have taken into account the situations in which mergers between entities of the same legal form and those in which they may have different legal forms may take place. We note that the most significant share is held by the mergers between entities with the same legal form, LLC. Thus, we can say that, during the analyzed period, 480 limited liability companies participated in merger operations with entities of the same legal form of organization. In relative terms, we can say that 84,06% of the total of 571 entities that participated in mergers are LLCs.
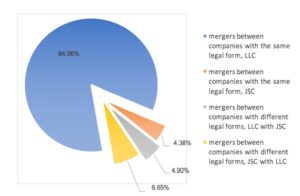
Fig. 8: Distribution of mergers according to the legal form of the participating entities
Source: Own processing
The merger operations between joint stock companies represent a share of 4,38%. Thus, during the analyzed period, 25 entities with the same form of organization (JSC) participated in merger operations. But art. 238, par. (3) of Law no. 31/1990 allows the merger operations to take place between entities with different forms of organization. Thus, we have identified 66 entities that merged with companies with different legal forms. Of these, we noticed a number of 28 merger projects, where the bidder company is organized as limited liability company and the target as joint stock company, respectively 38 cases where the acquiring company is JSC and the target company is LLC.
The Analysis of Merger Projects Based On Company Dimension
At this point of our research, we consider interesting an analysis of the merger projects in terms of the size of the entities involved, taking into account the provisions of the Romanian financial and accounting legislation regarding the non-listed entities (OMPF No. 1802/2014). Thus, the Romanian accounting legislation identifies three categories of reporting entities. The first category is that of micro-undertakings, which at the balance sheet date do not exceed the limits of at least two of the following criteria: net turnover lei 3.000.000, total assets 1.500.000 lei, average number of employees 10; small undertakings are those that do not exceed two of the following three criteria: net turnover of 35.000.000 lei, total assets of 17.500.000 and an average number of employees of 50; entities that exceed two of these limits fall within the category of medium-sized and large undertakings (art. 8, paragraph (2), OMPF No 470/2018). Of the total population of 571 entities participating in merger operations, we did not have data to qualify 119 entities in accordance with the presented criteria.
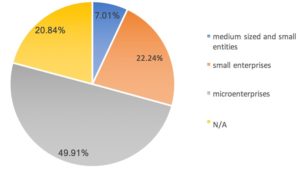
Fig. 9: Categories of entities participating in mergers by size
Source: Own processing
Figure 9 reflects the fact that most of the entities involved in mergers are micro-undertakings, with a number of 285. We also identified a number of 40 medium-sized and large undertakings and 127 small undertakings.
The Analysis of Merger Projects Considering the Relations between Bidding and Target Companies
Following the analysis of the merger projects for 2016, we noticed that in some cases this process was preceded by investments by one of the entities in the capital of the other, concluded in the possession of shares/long term investments.
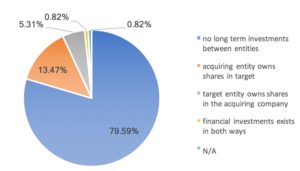
Fig. 10: Distribution of merger operations based on the existence of long term investments between merging entities
Source: Own processing
In figure 10, it can be seen that, for 195 of the merger operations, representing 79,59% of the total, there are no long-term investments between the entities involved in the merger. The situations in which the acquiring company holds shares in the target company account for 13,47% and 33 cases, respectively, the reversed situation corresponds to 5,31% of total, respectively 13 merger projects. The situations in which the financial investments exist in both ways are isolated cases, in our case 0,82%, respectively 2 merger projects. In the case of two merging entities, we did not have access to information, so we can not say whether or not there are shares held by one of the entities involved in the merger in the other’s capital.
The Analysis of Merger Projects Based On the Assessment of the Companies
Participating in merger operations requires the assessment of the entities involved in the process, and, for this purpose, two valuation methods are considered, one based on the information in the companies’ accounting system (by calculating their book value of equity), and the other based on independend appraisals made by authorized valuers. As for the first mentioned method, the Romanian merger regulations do not provide for the entity’s valuation taking into account possible synergy effects. However, in practice, the valuation of entities participating in merger operations over the period under review was unanimously based on the method which takes into account the book value of assets and liabilities, thus determining the book value of equity. According to art. 32 of the Law no. 227/2015 on the Fiscal Code, in order for the operation to benefit from fiscal neutrality, there are other obligations imposed on the acquiring company, the most important ones being the maintenance of the tax value of the assets received, keeping the depreciation method for transferred assets, maintaining provisions and reserves at their value before transfer, etc.
At this point in our approach, we consider it important to present the situation, taking into account the book value of equity of the entities involved in mergers in 2016. In figure 11, looking at the merger operations where only two entities participated, one can notice that we did not have access to data in the case of 19,60% of our sample.

Fig. 11: Distribution of mergers between two participating entities
according to the book value of equity
Source: Own processing
For the entities for which we had access to data, the largest share coresponds to the case of a positive book value of equity of both entities involved in the process, i.e. 42,71%. The weight of 24,12% corresponds to the situation where acquiring entities with positive book value of equity have absorbed entities with a similar negative indicator. In this case, we are of the opinion that there were long term investments between the two entities or there are investors/shareholders who hold shares in both entities involved in the process, thereby justifying the merger. Otherwise, the owners of the bidder company would be harmed by taking a negative contribution. It is difficult to explain the interest of an independent person in accepting to take over the debts that exceed the value of the transferred assets of a company. One possible justification could be that the merger would result in synergy effects that would generate added value that would allow, in a relatively short time, covering the losses incurred at the time of the merger.
Another important aspect in merger operations is the one on the exchange ratio. The mathematically calculated exchange ratio based on the book value of equity and the number of shares is the barometer measuring the economic potential of the merging entities. However, some merger operations are negotiation-based operations, in which case the mathematical calculations for determining the exchange ratio are purely indicative. There may be situations where the exchange ratio is based on reasons other than economic ones. In these situations, the exchange ratio may be a conventional one, a negotiated report or a 1:1 ratio, as specified in the merger project.

Fig. 12: Distribution of merger operations based on the
exchange ratio used in the transaction
Source: Own processing
Analyzing the merger operations based on the exchange ratio used in the transaction, according to figure 12, 172 merger projects took into account a mathematical report, accounting for 70,20% of the total.
The merger project, the fundamental document on which a merger is based, contains information on the merger premium. This is a supplement, an extra payment for the shareholder’s right in the merged entity.
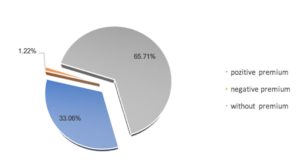
Fig. 13: Distribution of mergers based on the value of the premium
Source: Own processing
Figure 13 shows that 65,71% of the mergers resulted in a remuneration for the acquiree’s capital contribution at the par value of the shares of the acquiring company. We note that there is no obligation to calculate the merger premium unless there is a difference between the value of the capital contribution resulting from the merger and the value with which the share capital of the acquiring company has increased.
Conclusions
The importance of mergers and acquisitions in the economic world is unquestionable, and, in most cases, they are justified in terms of increasing the expected economic benefits (revenue increases or cost savings), capital cost savings, adaptation to technological developments or access to new markets, to mention some of the most common causes of the mergers that took place in Romania in 2016.
Analyzing the situation of the merger projects for 2016, taking into account the 14 criteria presented, we can conclude that Romania is quite conservative regarding these processes, in most cases preferring to use these strategies for cost reasons and looking for economic entities in the same region. Also, the Romanian companies were only slightly involved (3,92%) in cross-border mergers, which denotes insufficient openness to collaborations with firms from outside the borders.
(adsbygoogle = window.adsbygoogle || []).push({});
References
- Adolph, G. (2009), Merge Ahead, Tata McGraw-Hill Education.
- DePamphilis, D. (2010), Mergers and acquisitions basics: all you need to know, Academic Press.
- Gaughan, P.A. (2010), Mergers, acquisitions, and corporate restructurings, John Wiley & Sons.
- European Commission (2008), NACE Rev. 2, Statistical classification of economic activities in the European Community, Eurostat Methodologies and Working papers, Luxembourg.
- Law no. 227/2015 regarding the Fiscal Code, published in The Official Gazzete of Romania, Part I, nr.688/10.09.2015, with subsequent amendments.
- Law no. 31/1990 regarding companies, republished in The Official Gazzete of Romania no. 1066/17.11.2004, with subsequent amendments.
- Meier, O. & Schier, G. (2012), Fusions acquisitions-4e 2d.: Stratégie. Management, Dunod.
- Neary, J.P. (2007), Cross-border mergers as instruments of comparative advantage. The Review of Economic Studies, 74(4), 1229–1257.
- OMPF no. 897/2015 for the approval of the Methodological Norms regarding accounting of the main operations of merger, division, dissolution and liquidation of companies, as well as the withdrawal or exclusion of some companies’ associates, published in The Official Gazzete of Romania no. 711/22.09.2015.
- OMPF no. 470/2018 on the main aspects related to the preparation and the submission of the financial statements and the annual reports of the economic operators to the territorial units of the Ministery of Public Finance, as well as for the modification and completion of some accounting regulations, published in The Official Gazzete of Romania no. 66/23.01.2018.
- Qudaiby, B. Al & Khan, M. (2013), Financial Synergy in Mergers and Acquisitions in Saudi Arabia, Finance: Challenges of the Future, 15, 181-192.
- Sehleanu, M. (2013), Fuziuni și achizitii de întreprinderi – Particularități europene și naționale, Economica Publishing House, București.


