University of Pardubice, Studentka 95, Pardubice 53210, Czech Republic
Volume 2018,
Article ID 870203,
Journal of Eastern Europe Research in Business and Economics,
12 pages,
DOI: 10.5171/2018.870203
Received date: 5 September 2017; Accepted date: 12 December 2017; Published date: 15 October 2018
Academic Editor: Ioan Bogdan Robu
Cite this Article as:
Toseafa Evelyn (2018)," Using Meta Learning Methods to Forecast Sub-Sovereign Credit Ratings ", Journal of Eastern Europe Research in Business and Economics, Vol. 2018 (2018), Article ID 870203, DOI: 10.5171/2018.870203
This paper mainly analyses the forecasting of sub-sovereign credit ratings using machine learning methods in the non-US, Europe and other regional and sub-sovereign ratings. Specific focus is based on developing an accurate forecasting model based on machine learning. The forecasting accuracy was examined on two forecasting horizons, one and two years ahead. The study was designed to determine the cost sensitivity of various machine learning methods and to develop an accurate decision-support system that minimizes the cost of credit rating classification for sub-sovereign entities across countries and world regions. Each side of the economic, financial and debt and budget, revenues and expenditures were considered to provide sufficient inputs for the machine learning models. The analyses is to consider the ordinal character of the rating classes, classification cost (cost-sensitivity) which is used as objective function, in assessing credit ratings and evaluating of bonds i.e. regional credit rating modeling. This paper has been able to demonstrate that machine learning models based on current available financial and economic data present accurate classifications of credit ratings. Also the sub-sovereign credit rating forecast signified that the Random Forest and SMO algorithm performed significantly better than the statistical methods. Some practical implications were also provided.
Recently, credit rating agencies worldwide have gained higher rate of criticism for their influence on the economic crisis that started in 2007. Credit ratings are significant in the financial market especially, when it comes to redistribution
of funds by firms, government and other institutions. This is because deposit and non-deposit financiers prefer to give firms whose nonpayment rate is very low and, even with that, the interest rate that they expect the firms to pay on the funds might be low as compare to firms with a very high default rate. When firms are able to raise funds at a lower interest rate, the cost of funding of that particular firm will be low, and when the cost of funding of a bank is low it leads to better performance especially in terms of returns. Reinhart and Rogoff (2004) recorded that, capital flows to poor nations from the rich nations are mostly influenced by the sovereign’s credit track records.
These rating agencies are often criticized for their perceived inaccurate ratings and slow reactions to new information (Reinhart, 2001; Paudyn, 2013; Kim and Park, 2016). The role of these credit rating agencies is very influential on the financial markets in the production of credit risk information of issuer’s and its allocation to market participants. The credit rating can be defined as the degree of a ability of a firm to meet its debt servicing obligations in time, and it gives a way to quantify how close the entity is to avoidance. Credit rating reviews the solvency of an entity or a particular debt obligation in a single ordinal class. The main property of ratings is to translate credit risk into a single class to make them very attractive to the market participants (Hájek and Olej, 2011). Credit ratings boost borrowing conditions by the cost of credit and the availability of the credit. For example, a lower bond rating would increase the risk quality demanded by the market and therefore the cost of borrowing; a lower rating could also result in the reduction of the potential market for the downgraded debt, since some investors are either incapable or not ready to hold debt below a certain rating (Cheung, 1996). In a municipal and regional setting (sub-sovereign), credit ratings are usually used to express the general financial performance. This rather difficult evaluation is based on diverse criteria than the financial performance of firms (Beck et al., 2017). Regional financial performance is influenced by various socio-economic determinants.
Over the years, sovereign credit rating has been accorded great attention in the global financial markets since it became a common way of measuring a country’s risk. Sovereign credit rating is the assessments of governments’ capability and readiness to service the debts of the nation. The globalization of markets has brought about the bridge between countries and the sectors within the country, making them more reliant on one another (Berglund and Fransson, 2012).
In recent years, the demand for sovereign (country) and sub-sovereign ratings has improved mainly due to the unpredictable globalization of markets (Liu and Tan, 2009). Investors and mainly managed funds are gradually based on international change. A change in these ratings can be a major input in the re-weighing of international portfolios. However, previous literature has been concentrated on sovereign (Bennell et al., 2006) and municipal ratings (Hajek, 2011), except for the vast amount of literature on corporate credit ratings (see e.g. Huang et al., 2004; Hajek and Michalak, 2013). The study by Cantor and Packer (1994, 1996) explored the determinants and effect of sovereign rating assigned by the two leading agencies, Moody’s and Standard and Poor’s using a sample of 49 countries at a specific point in time. They measured eight economic variables to evaluate the determinants of ratings using the ordinary least square method. The cross-sectional analysis suggests that sovereign ratings are generally consistent with the macroeconomic fundamentals, which the two agencies appear to weigh equally.
Reinsen and Von Maltzan (1999) studied the links between sovereign credit ratings and dollar bond yields spread over the years 1989 to 1997 so as to judge whether the three rating agencies, namely, Moody’s, Standard and Poor’s, and Fitch IBCA can increase or decrease boom-bust cycles in emerging markets. The study firstly assessed whether the rating agencies have an impact on the market using the event study methodology as well as employing a Granger causality test in order to establish the extent to which sovereign rating leads or causes changes in yields spreads beyond and above other observable yield determinants. They found a significant impact of upgrades and downgrades on spreads for a combination of ratings by the three agencies. The Granger causality test revealed that changes in sovereign ratings are mutually interdependent with changes in bond yield.
Past ratings reflect a variety of factors, including wars, revolutions, fiscal and monetary policies, and external shocks. As we enter the new millennium, fiscal discipline, debt management, structural inefficiencies constraining productivity, and the contingent liabilities arising from weak banking systems are among the significant economic policy challenges facing many sovereign and sub-sovereign entities. The associated credit risk, which may seem manageable for a time, can quickly spring up as events in a number of emerging market countries since 1997 (Larraín et al., 1997). Rating agencies believe that an understanding of sovereign and sub-sovereign ratings’ criteria is more relevant now than ever before.
The emergence of decentralization in developed countries in the 90s contributed to changing fiscal and tax relationships between the central and regional political levels. The shift had significant concerns on the borrowing policy of local and regional governments because their borrowing capacity, their resorting to international capital market and their dependence on credit ratings are all-greater than before as asserted by (Huang et al., 2004).
Some existing literature on the determinants of sovereign credit ratings focused on some macroeconomic, qualitative and risk factors. A lot more studies focus on time-varying models of credit ratings as examined by (Reusens and Croux, 2017) and models with debt levels conditional on debt being above or below endogenously determined debt threshold levels by (Hmiden and Cheikh, 2016).
The costly nature of credit rating is due to the fact that rating agencies invest large amount of time and human resources to perform the credit rating process. These lead to more effort, which is required in order to simulate the credit rating process of rating agencies through statistical (Gaillard, 2009) and machine learning methods (Hajek and Michalak, 2013). The difficulty in designing such models lies in the subjectivity of the credit rating process. Complex relations between financial and other variables are evaluated. Such intricate process makes it difficult to categorize credit ratings (rating classes) through statistical methods. Machine learning methods can be applied for the modelling of such complex relations. These make accurate predictions of credit ratings possible. This is important for all market participants to make investment decisions including investors, financial institutions and sub-sovereign entities.
Prior literature on the prediction of sub-sovereign credit ratings has been limited to statistical methods (Gaillard, 2009). Here we aim to fill this gap and employ a variety of machine learning methods to predict sub-sovereign credit ratings. We hypothesize that machine learning methods significantly outperform the previously used statistical methods. Therefore, the main aim of this paper is to develop an accurate forecasting model based on machine learning. We examine its forecasting accuracy on two forecasting horizons, one and two years ahead. To consider the ordinal character of the rating classes, classification cost (cost-sensitive) is used as an objective function.
The paper is structured as follows. In section 2, we provide a review of related literature. Section 3 presents the research methodology. Section 4 shows the results and the final section concludes the paper.
Related Literature
The primary activity of rating agencies is to issue ratings for bonds and other debt obligations of corporates. They also publish overall issuer ratings, to which the agencies sometimes refer as senior indiscreet ratings. The two main objectives are steady and precise of ratings, which can be conflicting resulting in a trade-off. The exact definition of issue ratings differs along the agencies. It usually is a measure of long run overall credit quality, but can possibly take into account additional information on expected recovery amounts. The ratings assigned by Standard & Poor’s are expressed in letterform, ranging from AAA, the highest, to CCC, the lowest. These ratings represent an attempt to divide a pattern of risk into discrete risk classes based on an assessment of the capacity of the debt issuer to pay interest and repay the principal in accordance with the terms of the issue.
The assessment of the credit risk of provincial governments (sub-sovereign credit ratings) takes into account actual and projected developments in a wide number of areas, including demographic economic, financial and debt indicators. Informed judgment by the rating agency analysts also plays an important role. The highest rating, AAA, indicates an extremely strong capacity to pay interest and repay principal, while the lowest rating, CCC, indicates a serious vulnerability to default on payment of interest and or repayment of principal. Debt rated from AAA to BBB is considered “investment” grade, while debt rated at BB and below is considered “speculative” grade. Since 1974, plus and minus symbols have been attached to the ratings from AA to CCC in order to show relative standing within the major rating categories. Standard & Poor’s also introduced rating outlooks in the summer of 1989, which indicate the likely direction of the next rating change if current economic and financial conditions continue. A higher credit rating shows a low credit risk. According to the assessed object, credit ratings of the state, company, provincial governments, financial institution, single bond, etc. exist.
Credit rating is a result of a credit rating process and a rating class defined on a rating scale to represent it. Rating classes are allotted to assessed objects whiles credit ratings are used by bond investors, debt issuers, and governmental officers to measure the risk of companies. They provide a means of determining risk premiums and marketability of bonds, allowing firms issuing debt to estimate the likely return investors require. Bankers and companies considering providing credit rely on credit ratings to make important investment decisions; many regulatory requirements for financial decisions are based on credit ratings, etc. Credit ratings are costly to obtain because rating agencies invest large amount of time and human resources to perform the credit rating process. Therefore, much effort has been made in order to simulate the credit rating process of rating agencies through machine learning methods (Hajek and Olej, 2011; Hajek and Michalak, 2013; Zhong et al., 2014; Jones et al., 2015). ). Credit ratings will enable subnational with above average ratings to negotiate better collateral and guarantee agreements.
Sovereign and sub-sovereign ratings are usually the assessment of each government’s ability and willingness to serve its debts in full and on time. Rating is a forward-looking evaluation of the default probability. Sovereign (sub-sovereign) ratings address the credit risks of national (regional) governments but not the precise default risk of other issuers. Ratings given to other private and public sector entities in each country can, and often do vary. Ratings of some issuers could be the same as the sovereign’s, while others are a bit lower. The borrowing requirements of the regional governments of developing industries have increased since the mid-1900’s (Gaillard, 2006).
Investors with much interest in foreign firms give more attention to the sovereign rating where the firm is located as well as the rating allocated to the firms (Martell, 2005). Sovereign rating is very important because it affects the domestic market operations. The sovereign credit rating industry derives most of its fee income from governments which lobby ratings of their bond issues. The industry can be considered as a duopoly where the two leading agencies Moody’s Investor Service and Standard and Poor’s fight for market share between each other as well as with smaller agencies. The fear of losing demand from governments which look for ratings as their securities may slow down rating depreciations in periods of extreme capital inflows. The high share of split ratings shows difference in the evaluation of sovereign risk that can be partly traced to the attempt of small agencies to gain market share by rating more generously than the market leaders.
The important set of research places emphases on the determinants of credit ratings. The existing research on these subjects has been analyzed in order to address the issues relating to the methodology applied, the data collection, the construction of indicators and variables best suitable for the research goals, and the understanding of the results. Looking over the years, (Flandreau and Flores, 2009) presented a unique comparison of sovereign ratings and findings that Standard and Poor’s and Moody’s ratings turned out to be slightly more accurate than those of Fitch.
Research Methodology
In this study, sub-sovereign credit ratings cover both developed and emerging countries, including Europe, North and South America, Africa and other parts of the world. The input data was obtained from Moody’s Credit Rating agency for the years 2003-2007, with the output credit ratings from 2008 and 2009 for one-year and two-year ahead forecasts, respectively. In these ratings, the input variables are designed specifically for the credit rating assessment, based on the variables presented by Moody’s. Specifically, the forecasting model was based on several categories of variables, including economic, financial, debt, etc. In this paper, a comprehensive time series dataset of sub-sovereign entities was collected over the period of 2003–2007, and 257 regions was extracted from Moody’s ratings and categorized into 15 rating classes. The study was designed to minimize the cost of classification.
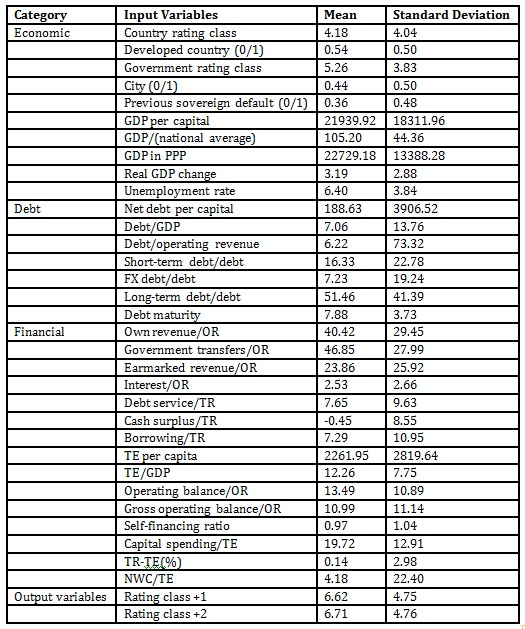
The input variables (Table 1) were extracted from Moody’s financial reports from 2003 to 2007. These variables represent the inputs of models, while the rating classes 1 (one-year forecasting horizon) and 2 (two-year forecasting horizon) from Moody’s rating agency stand as the outputs of the models.
The economy, which is most probably generates the resources to repay the sub-sovereign debt. Country and government rating class show long-term foreign currency credit ratings for sovereign and government bonds (Mohapatra et al., 2017). GDP per capita is a percentage of national GDP per capita and it is included to gauge relative economic performance and assess the likely impact of redistributive programs on fiscal performance. GDP/national average denotes the relative wealth levels which may be unevenly distributed across a country and reflect regional concentrations of economic activity. These differences may influence the fiscal capacities of sub-sovereign governments. GDP in PPP represents the current exchange rates that is used as the basis to measure economic size for the purpose of international rankings, however, it does not fully account for real cost-of-living differences across countries, they may, in certain cases, inaccurately reflect relative standards-of-living. Real GDP change is the economic growth, as measured by the annual percentage change in GDP, adjusted for inflation, it is a key variable of economic performance. The unemployment rate indicates the size of the output gap and of the under-utilization of human resources, as well as a signal of potential political pressure on government to take action to stimulate the economy.
Net debt per capital is the ratio of net direct and guaranteed debt over population that provides an internationally comparable gauge of debt levels. Debt/GDP is the amount of total gross government debt as a percentage of GDP. It shows the key factors for the sustainability of government finance. The short-term debt includes the total debt instruments with maturity period less than a year, for example government securities and treasury bills. The long-term debt instruments are payable within a period of time more than one year. Debt maturity is the principal amount of note, draft and any other debt instruments due for payment to investors by the government. It outlines the length of time until the debt obligation of the government stock matures or redeemed.
Own revenue encompasses all revenue -taxes, charges and other revenue generating sources, partially controlled, by the government. This ratio indicates whether the government has financial flexibility or not to address its fiscal challenges that may arise. Governmental transfers capture all revenues transferred from higher levels of government, whether intended as general fiscal support or as cost-sharing for particular spending categories. Earmarked revenue refers to all revenue flows that are dedicated to specific purposes, other than debt service, which ultimately limit the debt service capacity of a government. Interest/operating revenue shows the government’s ability to execute interest payment from operating revenue. Debt service helps in some cases to ascertain potential fiscal pressures on government as a result of excessive debt burden. The borrowing ratio helps to ascertain the annual cash requirement of government. Total expenditure as a percentage of GDP measures the impact or effect of a subgroup government’s expenses on the entire national economic output. Operating balance used to determine the structural capacity of government to maintain operating expenditure below operating revenue. A self-financing ratio with a value less than one implies the need for borrowing to meet capital budget requirements. The NWC ratio provides a point-in-time view of an entity’s liquidity position and provides an indication of the need for market access in the short-term. Below is the brief description of steps of the methodology.
Step 1: Proposal of variables are the input variables in (Table 1) that was extracted from Moody’s financial reports from 2003 to 2007. These variables represent the inputs of the models, while the rating classes 1 (one-year forecasting horizon) and 2 (two-year forecasting horizon) from Moody’s rating agency stand as the outputs of the models. The forecasting model was based on several categories of variables, including economic, financial and debt.
Step 2: Data collection is a collection of a comprehensive time series dataset of sub-sovereign entities that was collected over the period of 2003–2007 that was extracted from Moody’s rating from 257 regions categorized into 15 rating classes. The study was designed to minimize the cost of classification.
Step 3: Data preprocessing, the data was cleaned by filling in missing attributes, then transformed through normalization and aggregation to reduce the number of attributes of the variables for the analysis.
Step 4: Data analysis, Statistica is used to analyze the descriptive statistics such as the mean and standard deviation of the variables.
Step 5: Cost matrix is proposed to take the ordinal character of the output into account.
Step 6: Various machine learning algorithms are used to forecast sub-sovereign credit ratings. The experiments were carried out in WEKA.
Step 7: Statistical tests were performed to detect significant differences between the ROC and average cost of the model.
In Table 1 below, Statististca is used to analyze the input variables to obtain the descriptive statistics such as the mean and the standard deviations for their institutional quality, economic structure and performance, debt profile and the financial performance.
Table 1: Input and output variables for sub-sovereign credit rating forecasting
Legend: TR is total revenue, TE is total expenditure, OR is operating revenue, and NWC is net working capital.
Methods
Here the machine learning methods used for forecasting are briefly presented.
The Naïve Bayes algorithm is a very simple and probabilistic and an efficient classification algorithm classifier that calculates a set of probabilities by counting the frequencies and combinations of values in a given data set. The algorithm uses Bayes theorem and assumes all attributes to be independent, given the value of the class variable.
A Bayesian network, Bayes network, belief network, Bayesian model or probabilistic directed acyclic graphical model is a probabilistic graphical model (a type of statistical model) that represents a set of random variables and their conditional dependencies via a directed acyclic graph.
J48 is an algorithm used to generate a decision tree developed by Ross Quinlan. J48 version was used with the minimum no. of instances per leaf = 2, and confidence factor for pruning = 0.25.
Random Forest is an ensemble learning method for classification, regression and other tasks that operate by constructing a multitude of a decision tree training time and outputting the class that is of the mode or the mean prediction of the individual tree. Maximum depth of trees was set as unlimited, no. of trees to be generated = 100, and no. of variables randomly sampled as candidates at each split = log2 (#predictors) + 1. Simple logistics is an algorithm used to classify building logistic regression models.
A Support Vector Machine (SVM) is a supervised machine learning algorithm that can be used for both classification and regression purposes. SVMs are more commonly used in classification problems and as such, finding a hyperplane that best divides a dataset into two classes. SMO algorithm with complexity parameter C= {1, 2, 3, … , 15}, polynomial kernel function with exponent = {1, 2}, RBF kernel function with gamma = 0.01. SMO is an algorithm that generally substitutes all missing values and changes nominal attributes into binary ones. It also normalizes all attributes by default in the case that the coefficients in the output are based on the normalized data.
Radial basis function (RBF) neural networks are neural nets that have three layers. The first input layer feeds data to a hidden intermediate layer. The hidden layer processes the data and transports it to the output layer.
Multilayered Perception (MLP) is a feedforward artificial neural network that generates a set of outputs from a set of inputs. MLP is characterized by several layers of inputs nodes connected as a direct graph between the input and the output layers. MLP uses backpropagation for training of the network. The following setting was used for MLP: neurons in hidden layer = {1, 2, 3, ….,15}, learning rate = 0.1, and no. of iterations = 500.
AdaBoost is a stochastic gradient boosting machine which is used with short decision trees. After the first tree is created, the performance of the tree on each training instance is used to weigh how much attention the next tree created should pay to each training instance. The training data that is hard to predict is given more weight, which makes it easier to predict instances with less given weight. Models are created sequentially one after the other with each updating the weights on the training instances that affect the learning performance of the next tree in the sequence. After all the trees are built, predictions are made for the new data, and the performance of each tree is weighted by how accurate it was on the training data. Much attention is paid on correcting mistakes by the algorithm which is important that, the clean data with outliers is removed. The number of iteration used was = 10, and the weight of threshold was = 100.
Bagging, which is same as Bootstrap Aggregating, is a technique to decrease the variance of predictions by generating another data to train from the original dataset using combinations with repetitions to produce multisets of the same cardinality or size as the original data. When the size of the training set increases, the force predictive model can’t be improved, but it just decreases the variance by narrowly turning the prediction to an expected outcome.
Stacking generally involves training a learning algorithm to combine the predictions of several other learning algorithms. The algorithms are trained using the available data, and then a combiner algorithm is trained to make a final prediction using all the predictions of the other algorithms as additional inputs. When arbitrary combiner algorithm is used, stacking can theoretically represent any of the ensemble techniques described in this article, although in practice, a single-layer logistic regression model is often used as the combiner. The number of folds used for cross validation is = 10 and the random number =2 is used as seed.
Table 2 below illustrates the 15-rating classes of the rating agencies used as the cost matrix used to determine the cost sensitivity.
Table 2: Cost matrix
Source: own calculations
Results
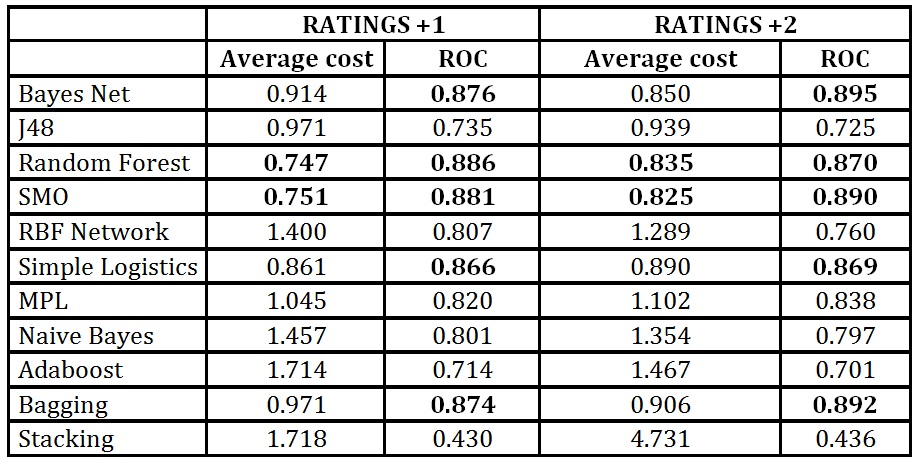
In Table 3 below, average results across 10-fold cross-validation are presented. 10 folds were generated as 66/34 percent split of training/testing data. This procedure avoids the overfitting of the machine learning methods.
For Rating +1, The outcome of Adaboost resulted with an average cost of 1.714, with an ROC of 1.467 and stacking also had a higher results of 1.718 and Naïve Bayes algorithm achieved 1.4571 average cost and 0.801 ROC (area under receiver operating characteristics). The ROC shows how the algorithms perform on all classes on average. In other words, all the algorithms with a high ROC value indicate that they performed well also on imbalanced classes. In case of sub-sovereign credit ratings, these are the best and the worst credit ratings. The result of stacking was the worst one, together with the Adaboost, Naïve Bayes and RBF neural network. Similar results were also observed for Rating +2. In contrast, Random Forest and SMO algorithm performed best for both forecasting horizons, providing almost two-times lower classification cost compared with Stacking, Adaboost and Naïve Bayes. As expected, the cost increased with a longer forecasting horizon (for Rating +2). To compare the results, we performed Student’s paired t-test and marked the significantly better results at p<0.05 in bold in Table 3. Obviously, the differences were significant for both accuracy measures, in particular for average cost. The empirical hypotheses articulated in the beginning of this chapter from the results of the sub-sovereign credit rating forecasting signifies that Random Forest and SMO algorithm performed significantly better than the statistical methods.
The results strongly suggest that the machine learning models based on current available financial and economic data could present accurate classifications of credit ratings. Even though, the rating agencies and many other institutional writers stresses on the importance of subjective analyses in determining the ratings, it seemed that a small list of input variables largely determines the rating results. This also asserts that the set of variables discovered in this study represents the most relevant information for the credit rating decision.
The proposed model gives an easier idea of the evaluation of the sub-sovereign credit rating for public administration managers, banks, investors, or rating agencies. In future, such models should be developed in a way to make it possible to precisely forecast credit rating. This can be realized by using input variables significant for credit rating process and, consequently, by the classification of the sub-sovereigns into rating classes.
Table 3: Results of sub-sovereign credit rating forecasting
Source: own calculations
Conclusion
Credit ratings contribute greatly to the capability and clarity within the financial markets. They have become the precondition for the development of emergence of the capital markets and also a very important tool in the regulatory context. This paper has examined the cost sensitivity of the various machine learning methods of algorithms conducted from a comprehensive time series dataset of sub-sovereign entities over the period of 2003–2007 that was extracted from Moody’s rating agency. The main purpose was to develop an accurate decision-support system that minimizes cost of credit rating classification for sub-sovereign entities across countries and world regions. Each side of the economic, financial and debt and budget, revenues and expenditures were examined to provide sufficient inputs to the machine learning models.
Random Forest was found to have the most accurate forecasts with 0.747 average cost for Rating +1 (and 0.835 for Rating +2) and ROC of 0.886 for Rating +1 (0.870 for Rating +2). SMO performed relatively better for Rating +2. It is therefore recommended to combine Random Forest for a short-term credit rating prediction and SMO algorithm for a long-term forecasting.
This paper was limited in several ways such as the unavailability of more recent data. Moreover, a more precise costs matrix defined by experts based on actual costs would also be beneficial. The experimentation was carried out in WEKA.
Acknowledgement
This article was supported by the grant No. SGS_2017_017 of the Student Grant Competition.
Beck, R., Ferrucci, G., Hantzsche, A., and Rau-Goehring, M. (2017). ‘Determinants of sub-sovereign bond yield spreads’ – The role of fiscal fundamentals and federal bailout expectations. Journal of International Money and Finance, 76, 72-98.
Bennell, J. A., Crabbe, D., Thomas, S., & Ap Gwilym, O. (2006). ‘Modelling sovereign credit ratings: Neural networks versus ordered probit,’ Expert Systems with Applications, 30(3), 415-425.
Berglund, A. and Fransson, C. ( 2012), ‘Sovereign Credit Rating Effects on Equity Markets –Applied on US Data,’ Halmstads Högskola.
Cantor, R. and Packer, F. (1996), ‘Determinants and impact of sovereign credit ratings’, Federal Reserve Bank of New York, Economic Policy Review, 2(2), 37-53.
Cantor, R., and Packer, F. (1994). ‘The credit rating industry,’ Quarterly Review, (Sum), 1-26.
Cheung, S. (1996). ‘Provincial Credit Ratings in Canada –An Ordered Probit Analysis,’ Working Paper 96-6.
Flandreau, M., and Flores, J. H. (2009). ‘Bonds and brands: foundations of sovereign debt markets,’ 1820–1830. The Journal of Economic History, 69(3), 646-684.
Gaillard, N. (2009) ‘The determinants of Moody’s sub-sovereign ratings,’ International Research Journal of Finance and Economics, 31(1), 194-209.
Gaillard, N. (2006), ‘Determinants of Moody’s and S&P’s Subsovereign Credit Ratings’. Fondation Nationale Des Sciences Politiques: France.
Hajek, P. (2011), ‘Municipal credit rating modelling by neural networks,’ Decision Support Systems, 51(1), 108-118.
Hajek, P., and Michalak, K. (2013), ‘Feature selection in corporate credit rating prediction,’ Knowledge-Based Systems, 51, 72-84.
Hájek, P., and Olej, V. (2011), ‘Credit rating modelling by kernel-based approaches with supervised and semi-supervised learning,’ Neural Computing and Applications, 20(6), 761-773.
Hmiden, OB. and Cheikh, NB. (2016), ‘Debt-threshold effect in sovereign credit ratings: new evidence from nonlinear panel smooth transition models’. Finance Research Letters, 19, 273-278.
Huang, Z., Chen, H., Hsu, C. J., Chen, W. H., and Wu, S. (2004), ‘Credit rating analysis with support vector machines and neural networks: a market comparative study,’ Decision Support Systems, 37(4), 543-558.
Larraín, G., Reisen, H. and von Maltzan, J. (1997), ‘Emerging Market Risk and Sovereign Credit Ratings,’ OECD Development Centre, Technical Papers, no. 124.
Jones, S., Johnstone, D., and Wilson, R. (2015), ‘An empirical evaluation of the performance of binary classifiers in the prediction of credit ratings changes,’ Journal of Banking & Finance, 56, 72-85.
Kim, S., and Park, S. (2016), ‘Credit Rating Inflation during the 2000s: Lessons from the US State Governments,’. International Journal of Economics and Financial Issues, 6(1).
Liu, L., and Tan, K. S. (2009), ‘Subnational credit ratings: A comparative review,’ World Bank Working Paper 5013.
Mohapatra, S., Nose, M., and Ratha, D. (2017), ‘Determinants of the distance between sovereign credit ratings and sub-sovereign bond ratings: Evidence from emerging markets and developing economies,’ Applied Economics, 1-23.
Paudyn, B. (2013), ‘Credit rating agencies and the sovereign debt crisis: Performing the politics of creditworthiness through risk and uncertainty,’ Review of International Political Economy, 20(4), 788-818.
Reinhart, CM. (2001), ‘Do sovereign credit ratings anticipate financial crises?Evidence fromemerging markets,’ Mimeo, School of Public Affairs, University of Maryland, College Park.
Reinhart, CM and Rogoff, KS. (2004), ‘Serial default and the paradox of rich to poor capital flows,’ National Bureau of Economic Research.
Reisen, H., and Von Maltzan, J. (1999), ‘Boom and bust and sovereign ratings,’ International Finance, 2(2), 273-293.
Reusens, P., and Croux, C. (2017), ‘Sovereign credit rating determinants: a comparison before and after the European debt crisis,’ Journal of Banking and Finance, 77, 108-121.
Zhong, H., Miao, C., Shen, Z., and Feng, Y. (2014), ‘Comparing the learning effectiveness of BP,’ ELM, I-ELM, and SVM for corporate credit ratings. Neurocomputing, 128, 285-295.