Beata Sofrankova, Dana Kiselakova, Veronika Cabinova and Erika Onuferova
University of Presov in Presov, Slovakia
Volume 2018,
Article ID 916196,
Journal of Eastern Europe Research in Business and Economics,
13 pages,
DOI: 10.5171/2018.916196
Received date: 13 March 2018; Accepted date: 17 May 2018; Published date: 17 August 2018
Academic Editor: Beata Ślusarczyk
Cite this Article as:
Beata Sofrankova, Dana Kiselakova, Veronika Cabinova and Erika Onuferova (2018)," The Importance of Research and Development Spending In the Context of Global Competitiveness and the Innovation Potential of the V4 Countries", Journal of Eastern Europe Research in Business and Economics, Vol. 2018 (2018), Article ID 916196,
DOI: 10.5171/2018.916196
Innovations are considered under the current conditions as one of the key sources and drivers to strengthen not only the economic but also the social prosperity of countries and their competitiveness. The paper focuses on revealing the relationship between research and development expenditure and the level of global competitiveness and innovation activity of V4 countries. Secondary data representing the Global Competitiveness Index (GCI), the World Competitiveness Index (WCI) and the Global Innovation Index (GII) for the 2011-2016 period were used to assess global competitiveness. Indicators of gross domestic expenditure on R&D (GERD) according to each sector of performance were obtained from the Eurostat database. In the assessment framework of the global competitiveness and innovation activity of the V4 countries, the Czech Republic is the leader, as it has reached almost double the average spending on research and development (€ 280.92 per capita) compared to the average of € 158.84 per capita in the V4 countries. The results of the correlation and regression analysis confirmed the dependence between R&D amount and competition and innovation activity assessment of V4, and a direct relationship between R&D expenditure increase (GERD_T per capita) and the growth of values of the analyzed indexes was indicated. We have achieved the best results of our analysis in assessing the interrelationship between the Innovation Activity (GII) and all the R&D expenditure variants of V4 countries. Finally, we can conclude that the growth of R&D spending can make a significant contribution to increasing the competitiveness and level of innovation activities of the V4 countries.
Keywords: R&D expenditure per capita, Global Competitiveness Index, World Competitiveness Index, Global Innovation Index, V4 countries
Introduction
Authors Rajnoha and Dobrovic (2017) state that actual business environment has changed dramatically and depends especially on the performance in generating and utilizing new knowledge, information systems, innovations and management techniques and tools for creating the higher business performance. Exploring the competitiveness-enhancing determinants has occupied the economists’ minds for hundreds of years. Starting with Adam Smith’s theories focused on specialization to neoclassical economists’ underlying the need to invest in physical capital and infrastructure, up to the current interest in areas such as education, professional training, technological progress, macroeconomic stability, market efficiency, etc. (Schwab, Sala-i-Martin, et al. 2014). Authors Kravcakova – Vozarova, Kotulic and Sira (2015) emphasize that market economy is a competitive economy, thus competition is a crucial part of economic activity. By Kuzmisinova (2013), global business environment provides many opportunities for expansion and application of comparative advantages. An important role in the use of these options is the ability to succeed in international markets through competitiveness of business entities and economy at all. In this context, Schultzova (2016) adds that one of the important assumptions for economic growth and long-term competitiveness is undoubtedly a stable, prosperous and attractive economic environment.
As reported by Sopkova (2012), M. Porter published one of the first concepts of international competitiveness – Porter’s Diamond Model. Even though it is focused on microeconomic factors, it also includes the role of the state. By means of this model, the author explains the nation’s competitive advantage in certain sectors on the basis of six factors. However, four most important factors were finally identified as determinants supporting or defending the creation of comparative advantage of nations:
factor conditions (human resources, material resources, capital resources, infrastructure),
home demand conditions,
firm strategy, structure and intensity of domestic competition (rivalry),
related and supporting industries supplying the inputs critical for innovation and internationalization of competitive conditions.
Methods for Evaluating the Competitiveness by Using Various Global Indexes
Early concepts of measuring competitiveness and innovation performance at the global level began to emerge since the 1980s. International institutions started to provide valuable and professional comparisons to subjects operating in the global economic environment to identify the business environment and competitiveness but also to compare and recognize the future trends of its development.
As reported by Gordiakova (2011), despite the differences within the methodologies and approaches used to assess global competitiveness (e.g. by means of indexes with applications for statistical resources), most of the methods are associated with high multi-criteriality and complexity. According to Loo (2012), the most respected organizations dealing with the assessment of nations’ competitiveness at the global level are the World Economic Forum (WEF) and the Institute for Management Development (IMD). Both institutions use macro and microeconomic concepts to analyse the efficiency of the public and private sector as well as the overall infrastructure that forms and affects national competitiveness.
Global Competitiveness Index (GCI)
Since 2005, the internationally reputable organization World Economic Forum has based its analysis of competitiveness on the GCI indicator, a comprehensive tool integrating microeconomic and macroeconomic aspects of national competitiveness into one overall index (Schwab, Sala-i-Martin, et al. 2014).
The overall GCI indicator is according to Schwab, Sala-i-Martin, et al. (2017) composed of twelve general pillars that play an important role in its quantification. These individual pillars are on the basis of their content and M. Porter’s theory integrated into three main subindexes containing the following pillars:
3rd Subindex – Innovation and sophistication factors (11th pillar: Business sophistication, 12th pillar: Innovation).
Thus, national economies can be divided into three stages of development and two “in transition” stages based on the GDP per capita and the share of mineral goods in total exports (Gordiakova 2011). In addition, the individual subindexes’ weights differ from each other on the basis of development stage economies, whereas the weights of individual indicators remain constant.
By author Parausic, et al. (2014), the GCI indicator is based on “hard” statistical data and “soft” data. “Hard data” are completed from publicly available sources (International Monetary Fund, World Bank, UNESCO, World Health Organization, etc.) and normalized by point evaluation from 1 (worst) to 7 (best).
World Competitiveness Index (WCI)
The World Competitiveness Yearbook has been published by the Institute for Management Development since 1989 and it is regarded to be the most comprehensive report concerning the competitiveness of countries. Based on WCI indicator, countries are analysed and ranked according to their ability to use competencies and opportunities to achieve a higher prosperity (IMD 2016).
According to Loo (2015), the overall WCI indicator is composed of four key factors, whereas each of them is made up of five subfactors (20 in total) with the same weight (5 %):
To quantify the competitiveness of countries, the IMD relies also on secondary data and primary data. Secondary data are compiled from international, national and regional organizations. Primary data are compiled from annual Executive Opinion Survey (EOS) which provides actual and more detailed information reflecting economic reality in the country. The survey is sent to participants – top managers and answers are detected as a measure of agreement or disagreement with the prepared questions or statements (IMD 2016).
Global Innovation Index (GII)
As reported by Dutta et al. (2011), the Global Innovation Index project was launched by INSEAD in 2007 with a relatively simple goal of developing new approaches and metrics better capturing the richness of innovation in society and exceeding the traditional innovatory measures such as the number of PhD students, the number of published research articles, the number of newly established research centres, patents or the amount of R&D expenditures.
In general, the GII indicator relies on two main subindexes. The Innovation Input Subindex is represented by five input pillars capturing the elements of national economy that enable the implementation of innovative activities. The Innovation Output Subindex consists of two pillars, which are considered to be the results of innovative activities within the economy. Although the Output Sub-Index includes only two pillars, it has the same weight in calculating the overall GII score. Thus, the overall GII score is the simple average of both sub-indices. The individual input and output GII pillars are furthermore made up of three other subpillars:
1st pillar: Institutions (subpillars – Political environment, Regulatory environment, Business environment),
2nd pillar: Human capital and research (subpillars – Education, Tertiary education, Research & development),
3rd pillar: Infrastructure (subpillars – ICTs, General infrastructure, Ecological sustainability),
7th pillar: Creative outputs (subpillars – Intangible assets, Creative goods and services, Online creativity) (Dutta et al. 2017).
All available official data are obtained from international organizations as the World Bank, the United Nations Educational, Scientific and Cultural Organization, the World Intellectual Property Organization, the International Energy Agency, the International Telecommunications Union as well as other selected private organizations (Dutta et al. 2017).
Data and Methodology
The main aim of this paper is to reveal the potential relations between the R&D expenditure and the competitiveness and innovation activity development in the V4 countries (Czech Republic, Hungary, Poland and Slovak Republic) during the years 2011 – 2016.
This article is primarily focused on the development analysis of:
global competitiveness by means of the GCI and WCI indicators,
innovation activity by means of the GII indicator,
R&D expenditure (per capita) by individual sectors of performance.
The analyses of V4 countries’ competitiveness position in European rankings were performed on the basis of secondary data drawn and subsequently processed from the annual Global Competitiveness reports completed by the World Economic Forum (in the case of GCI indicator) as well as from the IMD World Competitiveness Yearbooks compiled by the Institute for Management Development (in the case of WCI indicator). Information about the GII indicator’s development within the V4 countries was obtained by processing the GII annual reports.
On the other hand, secondary data concerning the gross domestic expenditure on R&D (GERD) by sectors of performance over the period 2011 – 2016, were retrieved from the Eurostat (2018) database. The private non-profit sector did not provide all the data necessary for the correct and complete comparison across the V4 countries over the analysed period, so it was not taken into account for the purposes of this research. Thus, impacts and consequences of R&D expenditure were analysed in terms of GERD (per capita) on average for:
All sectors of performance (GERD_T),
Business enterprise sector (GERD_B),
Government sector (GERD_G),
Higher education sector (GERD_E).
In accordance to the above mentioned theoretical and empirical approaches to the solved issue, the following research task was set: Is there a statistically significant relation between the R&D expenditure and the V4 countries’ competitiveness and innovation activity development?
For the purposes of further research analysis, a correlation matrix as one of the multidimensional statistical methods was applied. To reveal the interrelations and to determine the strength of interdependencies among the selected indicators, the Kendall tau non-parametric test of independence between two variables was employed. To process the above mentioned data, the STATISTICA software (version 13) was utilized.
Empirical Results
The following part of research is devoted to describing the results of performed analysis aimed at revealing the relation between R&D expenditure height (per capita) within the V4 countries and their competitiveness and innovation ratings by means of the GCI, the WCI and the GII indicators.
The Competitiveness Development Analysis of V4 Countries
The following part of competitiveness analysis was aimed at the development of GCI and WCI score within the member states of V4 countries during the years 2011 – 2016.
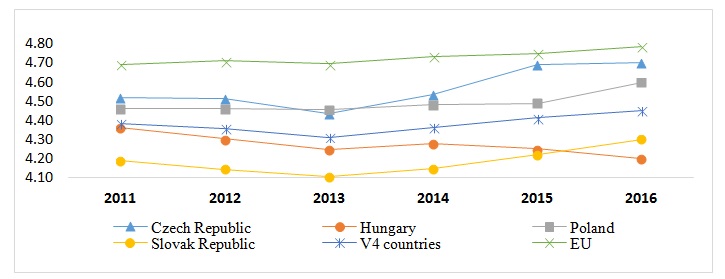
Fig. 1: The development of GCI score within the V4 countries (2011 – 2016)
Source: processing of authors
The average score of the GCI indicator within the European Union (EU) countries reached the level of 4.73, but V4 countries’ GCI value was only 4.38 on average. In addition, none of these countries was able to reach the EU average. One exception was almost recorded in 2015, when the Czech Republic nearly achieved this average, but it fell behind only by 0.06 score points. The highest average scores of the GCI indicator was reached by the Czech Republic (4.57) and Poland (4.49), whereas these values were fluctuating above the average of V4 countries. Over the analysed period, the Slovak republic occupied mostly the last positions with the average score of the GCI indicator at the level of 4.18. However, due to recent significant negative GCI score decline in the case of Hungary, Slovakia’s position is constantly improving not only at the European level, but also within the V4 countries.
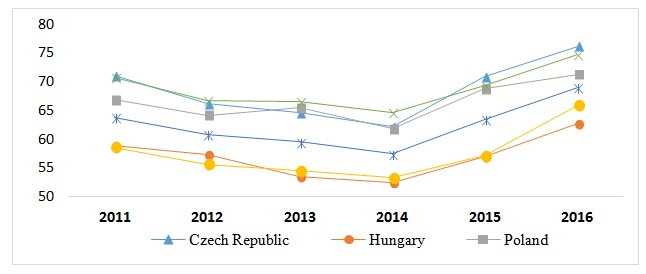
Looking at Figure 2, no significant differences in positions of individual countries compared to the GCI indicator evaluation can be seen. The dominant competitiveness position was again occupied by the Czech Republic, except in 2013, when Poland ranked 1st. Over the analysed period, the average score of the WCI indicator within the EU countries reached the level of 68.79. Only one country was able to achieve values above mentioned level – the Czech Republic in years 2011, 2015 and 2016. In recent years, the V4 countries’ WCI values are getting closer to the EU average, so competitiveness development according to this index has recorded a positively increasing trend.
Fig. 2: The development of WCI score within the V4 countries (2011 – 2016)
Source: processing of authors
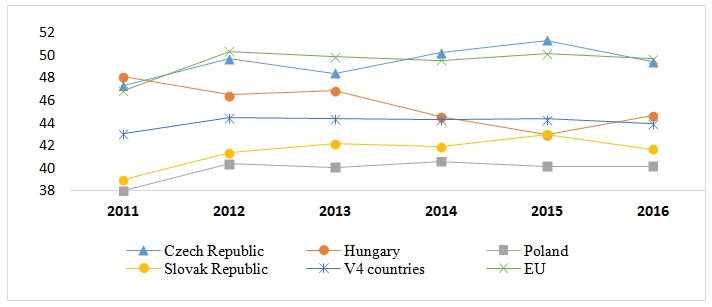
When evaluating the GII indicator development in comparison with the GCI and WCI indicator within the V4 countries, a slightly different progress in individual countries’ positions was noticed. Over the analysed period of 2011 – 2016, the EU countries’ GII indicator achieved the average value at the level of 49.40. Based on a more detailed analysis of the GII scores, the Czech Republic lagged behind the EU average only by 0.02 score points. In 2011, 2014 and 2015 it was even above the EU GII average. Interestingly, the GII scores in the case of Hungary and the Czech Republic were fluctuating above the V4 countries’ average level (44.12) over the whole period analysed. Despite the declining trend of the GII indicator, Hungary ranked 2nd, except in 2015. On the contrary, Poland reached the lowest GII scores (39.92 on average) and occupied last positions in the V4 countries’ rankings.
Fig. 3: The development of GII score within the V4 countries (2011 – 2016)
Source: processing of authors
The Development Analysis of R&D Expenditure within the V4 Countries
The next part of this study is dedicated to the development analysis of R&D expenditure per capita in the V4 countries during the years 2011 – 2016. The average values of analysed expenditure according to individual countries and performance sectors are the subject of Figure 4.
Over the period of 2011 – 2016, the Czech Republic invested in R&D activities € 280.92 per capita (regardless of the performance sector), which is almost twice as much GERD_T per capita than the V4 countries’ average (€ 158.84). The average level of R&D expenditure in Hungary reached the value of € 137.92 per capita and Slovakia’s total average investment in research and development activities were at the level of € 120.13. To conclude, the total R&D expenditure in Poland reached the lowest height (€ 96.40 per capita) among all the V4 countries member states.
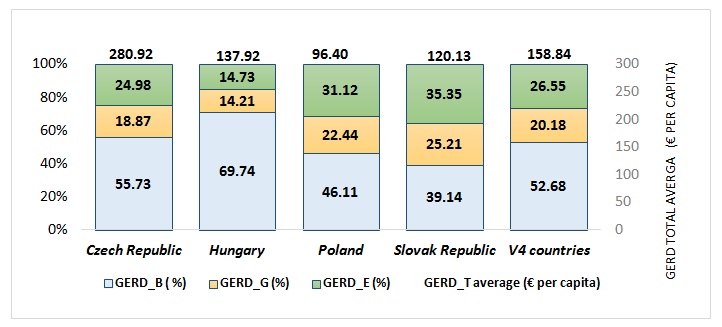
Fig. 4: The development of average R&D expenditure in V4 countries (2011 – 2016)
Source: processing of authors
When comparing the development of average R&D spending per capita by selected sectors, the V4 countries’ financial resources in innovation activities were invested mostly in the Business enterprise sector (52.68 %), followed by Higher education sector (26.55 %) and only 20.18 % of total R&D expenditure was invested into the Government sector. The most R&D expenditure per capita was invested by each country in the Business enterprise sector, whereas Hungary invested the most (69.74 %) and Slovakia the less (39.14 %) of total R&D spending in the above mentioned sector. However, there are also visible differences in the case of Government sector. In this regard, Slovakia ranked 1st (25.21 % of total R&D spending), vice versa, Hungary’s investment represented only 14.21 % of total R&D expenditure. When evaluating the share of total R&D spending in the Higher education sector, Slovakia reached also the dominant position (35.35 % of total spending on innovation activities).
Results of Correlation and Regression Analysis
To reveal the interrelations and to determine the strength of the interdependencies among the selected indicators, the non-parametric test of independence between two variables Kendall tau in the STATISTICA software was employed. The aim of the following analysis was to identify the correlation coefficients between R&D expenditure and V4 countries’ competitiveness measured by the GCI, WCI and GII indicators for the period of 2011 -2016.
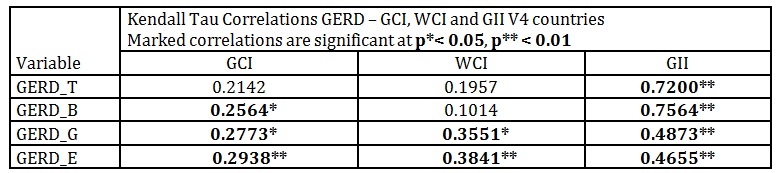
Table 1: Result of correlation analysis among the GERD and GCI, WCI and GII
Source: processing of authors
Based on the correlation coefficient values only among the R&D expenditure according to individual sectors of performance and the GCI indicator, a statistically significant dependence was confirmed. All correlation coefficients presented only small correlation intensity. Medium strong dependence was confirmed between the WCI indicator and R&D expenditure in the Government Sector and Higher Education Sector. Correlation coefficients also confirmed statistically significant relations among all variables within the GII indicator and R&D expenditure (including individual sectors). In the other part of the correlation analysis, the statistically significant dependence of R&D expenditure in relation to GII indicator with large intensity was proved. We detected the medium significance dependence in the case of GII index to two other R&D sectors (GERD_G, GERD_E). All GII indicator dependencies were identified at the significance level of p < 0.01.
When monitoring individual impacts, importance is not attributed to each factor. Therefore, it is appropriate to include factor weights when analysing the additive, multiplicative, and combined interactions between financial metrics. Then, a multi-criteria assessment of the financial level of business entities could be possible according to the established preferences (Stefko, Jencova, Litavcova and Vasanicova 2017). Thus, the next part of this study was dedicated to the analysis between determined (dependent) variables (GERD_T, GERD_B, GERD_G, GERD_E) and independent variables (GCI, WCI and GII indicator) using the regression analysis.
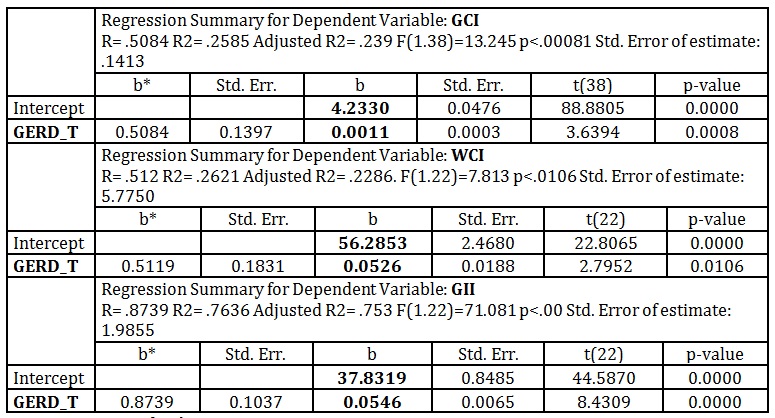
Table 2: Result of correlation analysis among the GERD and GCI, WCI and GII indicator
Source: processing of authors
It can be stated that all linear regression models (see Table 2) are acceptable according to the Fisher’s test criterion at the selected significance level of α = 5 % (p = 0.00). The determination coefficient explaining variability of the dependent variables (GCI, WCI and GII) reached the highest value of 76.36 % in the case of GII index expressed in the following regression model:
GII = 37.8319 + 0.0546 GERD_T.
This regression model indicates that increasing the total R&D expenditure (GERD_T) by one unit will cause an increase in the GII’s value by 0.0546 units (p = 0.00). Regression model also indicates (see Table 2) that in the case of zero R&D expenditures, GII index within V4 countries would achieve an average level of 37.8319 (p = 0.00). The directly proportional relations between the growth of R&D expenditure (GERD_T) and the growth of the WCI and GCI indexes were also confirmed.
Conclusion
The article was devoted to revealing the potential relations between the R&D expenditure and the competitiveness and innovation activity development in the V4 countries.
Based on the performed competitiveness analysis over the period of 2011 – 2016, it can be stated that V4 countries’ development by means of the GCI and WCI indicator was almost identical. In most cases, the Czech Republic reached the highest indexes’ scores and ranked 1st. Poland was identified as the biggest competitive rival of the Czech Republic. On the contrary, Slovakia was considered to be the weakest member of the V4 countries, even despite worsening Hungary’s GCI competitiveness development. However, the Slovak Republic reached better scores of the WCI indicator on average in comparison with Hungary.
A slightly different development in the individual countries’ positions was noticed in the case of GII indicator analysis. The Czech Republic occupied 1st positions with values almost identical to the EU average. In 2011, 2014 and 2015 it was even above this average. The second top innovation leader within the V4 countries was Hungary, although its GII indicator development recorded a predominantly declining trend (except in 2011). The worst positions within the GII indicator rankings were reached by Poland and the Slovak Republic.
The V4 countries’ positions were the same in terms of R&D expenditure as in the case of GII indicator evaluation analysis. Over the period of 2011 – 2016, the Czech Republic invested in R&D activities € 280.92 per capita (regardless of the performance sector) and it was considered to be the innovation leader within all the countries analysed. On the contrary, the total R&D expenditure in Poland reached the lowest height (€ 96.40 per capita). In terms of the structure of individual sectors of performance, the V4 countries’ financial resources in R&D activities were invested mostly in the Business enterprise sector (52.68 %), whereas Hungary invested the most (69.74 %) and Slovakia the less (39.14 %) of total R&D spending in the above mentioned sector. Thus, Slovakia reached the dominant position in the case of R&D expenditure in the Government sector (25.21 %) as well as in the Higher education sector (35.35 %).
In this regard, authors Lapinova, Varga and Sarkanova (2016) point out to the initial assumptions for the process of supporting innovation potential in the Czech and Slovak Republic. This process depends mainly on the quality and quantity of human resources and on the intensity of R&D funding. The results of study provided by Hunady, Pisar, Musa and Musova (2017) strongly suggest that higher regional GDP per capita is associated with higher regional gross domestic expenditure on R&D (GERD) per inhabitant that appears to be exponentially rising with regional GDP per capita in Visegrad countries. Authors also emphasize that for the long run growth, it is necessary to maintain balance in all components of R&D expenditure in sufficient amount. Author Szarowska (2017) quantified the impact of public research and development (R&D) expenditure on the economic growth of the 20 selected EU member states. The results confirm positive and statistically significant impact of government R&D expenditure, which is the main driver for economic growth during the analysed period.
However, the level of innovative activity of countries cannot be judged solely in terms of R&D expenditure. It is important to set up their appropriate amount, structure and interconnection with qualified human resources, innovation strategy and business environment. (Sofrankova, Kiselakova and Cabinova 20017).
The results of our correlation and regression analysis confirmed the relationship between R&D expenditure and evaluation of competitive and innovative activities of the V4 countries and indicated a directly proportional relationship between the increase of total R&D expenditure (GERD_T) and the growth scores of selected indexes. The most significant results were revealed within the relationship between the assessment of innovation activity (GII indicator) and all variants of V4 countries’ R&D expenditure.
Based on the results, we recommend increasing Slovakia’s R&D expenditure especially in the Business enterprise sector to the average value of V4 countries (52.68 %) as it has a significant impact on improving the evaluation of GII and GCI indicators.
In this context, the following possibilities to increase innovation performance of V4 countries were formulated:
increasing the total R&D spending to at least 3 % of the GDP average of the EU countries, as set out in one of the main priorities of the Europe 2020 Strategy,
increasing the private funding share of science and research as the public sector focuses only on the basic research without direct interconnection to the economy,
supporting and commercialization of loan, grant and state aid programs in the perspective areas of science, technology and innovation, as well as facilitating access to these financial funds,
more efficient use of EU structural and investment funds.
Acknowledgements
This article is one of the outputs of the project VEGA 1/0791/16 “Modern approaches to improving enterprise performance and competitiveness using the innovative model – Enterprise Performance Model to streamline Management Decision-Making Processes”.
Dell Inc. (2016). Dell Statistica (data analysis software system), version 13. software.dell.com
Dutta, S. et al. (2011), ‘Measuring innovation potential and results: the best performing economies’, The Global Innovation Index 2011: Accelerating Growth and Development, ISBN: 978-2-9522210-1-6.
Dutta, S. et al. (2017), ‘The Global Innovation Index (GII) Conceptual Framework’, The Global Innovation Index 2011: Innovation Feeding the World. ISBN: 979-10-95870-04-3
Eurostat (2018). Retrieved 13th January, 2018 from http://ec.europa.eu/eurostat/data/database
Gordiakova, Z. (2011), ‘Evaluation of the countries’ competitiveness’, TheInternational Scientific Conference “YOUNG SCIENTISTS 2011”, Košice: Technical University of Košice, Slovak Republic, 121-133.
Hunady, J., Pisar, P., Musa, H. and Musova, Z. (2017), ‘Innovation support and economic development at the regional level: Panel data evidence from Visegrad Countries’, Journal of International Studies, 10 (3), 147-160.
IMD (2016), ‘Methodology and principles of analysis. What is the IMD World Competitiveness Yearbook?’, IMD World Competitiveness Yearbook 2016. ISBN 978-2-9701085-0-4.
Kravcakova – Vozarova, I., Kotulic, R. and Sira, E. (2015), ‘V4 countries’ agricultural sector evaluation in terms of competitive advantage’, Economic Annals-XXI, 5-6, 60-63.
Kuzmisinova, V. (2013), ‘Business environment of Slovakia in the context of evaluation of international institutions and indices’, EMI: Economy Management Innovation, 5 (2), 17-25.
Lapinova, E., Varga, M. and Sarkanova, B. (2016), ‘Innovation performance and innovation potential of regions and its measurement’, Proceedings of the International Scientific Concference RIELIK 2017 – Reproduction of Human Capital, mutual links and conncestions, Praha: Vysoká škola ekonomická v Praze, Czech republic, ISBN 978-80-245-2166-4, 325-337.
Loo, M., K. (2012), ‘Competitiveness: top five nations last decade and next decade’, International Journal of Business and Management Studies, 1 (3), 391-412.
Loo, M., K. (2015), ‘The global competitiveness of BRIC nations: performance, issues and implications for policy’, Review of Integrative Business and Economics Research, 4 (4), 22-62.
Parausic, V. et al. (2014), ‘Correlation between the state of cluster development and national competitiveness in the Global Competitiveness Report of the World Economic Forum 2012-2013’, Economic research , 27 (1), 662-672.
Rajnoha, R. and Dobrovic, J. (2017), ʹManagerial Information Support for Strategic Business Performance Management in Industrial Enterprises in Slovakiaʹ, Polish Journal of Management Studies, 15(2), 194-204.
Schultzova, A. (2016), ‘Impact of tax incentives on the competitiveness of SMEs in Slovakia and in selected countries’, New Challenges in Public Finances 2016. Collection of Scientific Writings on Tax Policy. Bratislava: Ekonóm EU Bratislava. ISBN 978-80-225-4329-3.
Schwab, K. and Sala – i – Martin, X. et al. (2014), ‘The Global Competitiveness Index 2014 – 2015: Accelerating a robust recovery to create productive jobs and support inclusive growth’, The Global Competitiveness Report 2014-2015. ISBN: 978-92-95044-98-2.
Schwab, K. and Sala – i – Martin, X. et al. (2017), ‘Key findings of the Global Competitiveness Index’, The Global Competitiveness Report 2016-2017. ISBN: 978-1-944835-11-8
Sofrankova, B., Kiselakova, D. and Cabinova, V. (2017),. ‘Innovation as a source of country’s global competitiveness growth’, Innovative Economic Symposium 2017 (IES2017): Strategic Partnership in International Trade, 19th October 2017, České Budejovice, Czech Republic.
Sopkova, G. (2012), ‘Competitiveness, its theoretical definition and the position of the SR in the Global Competitiveness Report’, Proceedings of the International Scientific Conference for PhD Students and Young Scientists MERKÚR 2012, ISBN 978-80-225-3453-6, 782 – 790.
Stefko, R., Jencova, S., Litavcova, E. and Vasanicova, P. (2017), ‘Management and funding of the Healthcare system’, Polish Journal of Management Studies, 16 (2), 266-277.
Szarowska, I. (2017), ‘Does public R&D expenditure matter for economic growth? GMM Approach’, Journal of International Studies, 10 (2), 90-103.