Dunărea de Jos University of Galati, Galati, Romania
Volume 2019,
Article ID 301542,
Journal of Eastern Europe Research in Business and Economics,
9 pages,
DOI: 10.5171/2019.301542
Received date: 30 March 2016; Accepted date: 3 August 2018; Published date: 14 February 2019
Academic Editor: Oana Coca
Cite this Article as:
Silvius Stanciu and Cezar Ionut Bichescu (2019)," Romania’s Ability to Absorb European Funds: Case study Axis4 of the EFF", Journal of Eastern Europe Research in Business and Economics Vol. 2019 (2019), Article ID 301542,
DOI: 10.5171/2019.301542
Attracting non-refundable community funds for the fisheries represents an advantage for member states regarding food security, possibilities to support fishermen communities to develop complementary activities, and for the sustainable development of the fishing sector. Developing support actions to develop complementary fishing activities, with the help of LAG`s and local communities can reduce the pressure on natural resources. The research was conducted using the Gini Struck Method for assessing the degree of the market concentration. The variables analyzed were LAG’s number, Programs, National Funding for EFF, LAG’s Area and Population. The results of research have shown that there is no correlation between the size of the population or the eligible areas and the volume or the rate for absorption of funds; absorbed funds. The analysis can be useful for developing business models for local communities and fishermen or governments of member states and increasing the ability to access non-reimbursable community funds under the new EMFF 2014-2020 program. There is a high level of concentration for EFF allocated to Axis 4 in the fisheries communities in Romania, depending on the projects submitted and the support provided by the governmental organizations.
Keywords: Axis 4, EFF, LAG’s, Gini Struck, Romania
Introduction
The sustainable development of the fishing sector represents a priority for the European Union EU. Fish-based products have rich nutritious value; fish proteins were registered in the first value class from the point of view of chemical composition, with a balanced concentration of essential amino-acids, adapted to human organism. The increase in consumption of fish-based products could contribute to solve the global food security. According to United Nations, Food and Agriculture Organization FAO (2001-2016), 75% of the fish farming worldwide is used for direct consumption. Fish-based products, which cannot be used for human alimentation, represent around 33 million tons annually, and they are sold as forage (fish oil or flour), food for poultry farms and pigs or for feeding aquatic species in aquaculture. An analysis of Community funds for fisheries is performed by Stanciu (2014), which shows the importance of the fishery sector in Romania. Neculita and Moga (2014) analyzed the European Fisheries Fund (EFF) allocated in Central and Eastern Europe, and the influence of EU funds for the fisheries, by using Herfindahl–Hirschman Index.
Materials and Methods
Information concerning the development of the fishing sector in the community has been accessed using official information of the European Commission, CBI Market, Ministry of Agriculture and Rural Development of Romania. Eurostat, FAO Database, and International Trade Centre data were used for the statistical analysis. The raw data have been summarized, processed, and analysed.
EU Trade on fish and other marine products
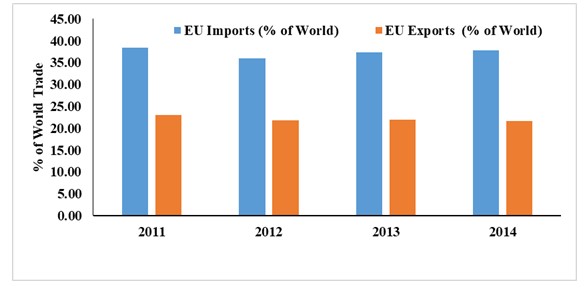
Supporting the fish farming sector in the community represents a way to reduce the EU dependency on fishery products import, and to develop a sustainable fish culture, and provides better management of natural resources. The European Commission Data (2014) show that the European market is the biggest importer of fishing and fish farming products in the world, having 35 -38% of the worldwide market. Self-sufficiency, represented by the ratio between EU production and apparent consumption, was assessed at 45% in 2011. The exports made by Member States represent 22 % of global exports (figure 1).
Figure 1: The share of European trade in fishery products in world trade
Source: Author, by using ITC (2016)
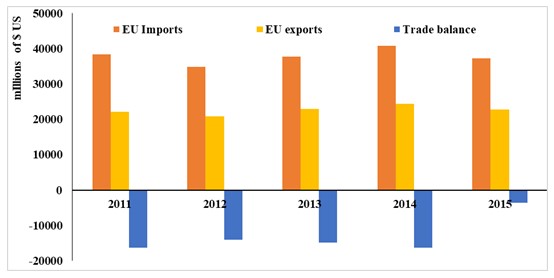
Although some progress has been made, especially as a result of EFF support for the fisheries sector, the EU trade balance on
fishery products is still unbalanced, being significantly dependent on extra-community imports (ITC, 2016).
Figure 2: The trade flows of fisheries and aquaculture products in Europe (Code 03 ITC)
Author, by using ITC data, (2016)
EU Measures to support the fishing sector
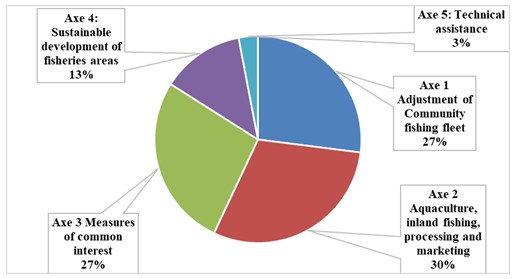
In order to increase competitiveness in the community sector, and to protect resources or reduce the EU dependency on import, 4.5 billion euro have been allocated by the Common Fisheries Programme, through the European Fisheries Fund, which began to be operational from the 1st of January 2007. The EFF focused on five priorities: adapting the EU fishing fleet; aquaculture, inland fishing, processing and marketing; collective action; sustainable development of fishing areas; and technical assistance to implement Council Regulation (EC) No 1198/2006. The distribution of funds on the 5 axis shows a relatively uniform distribution on Axis 1, 2, 3 and reduced ratios on 4 and 5 (figure 3).
Figure 3: EFF Distribution on main axis
Source: Author, by using Tokarski (2015)
The European Fisheries Fund (EFF)’s goal is to contribute to the realizing of the Common Fisheries Policy CFP objectives, being specifically focused on the conservation and the sustainable exploitation of the marine resources.
Analysis of CFP Measure on Axis 4
Funding on Axis 4 (Sustainable Development of Fisheries Areas) is based on local development strategies. The essential difference between Axis 4 and other EFF measures was not substantial given the content of the actions. In fact, many of the Axis 4 actions were close to those implemented under previous programs, such as PESCA, INTERREG or EQUAL. The main added value of Axis 4 was how these actions were implemented and correlated with the specificities of local communities. Almost 560 million euros have been earmarked to help local communities reduce their economic dependence on fish catches. Coastal communities and those close to lakes and ponds with significant employment in the fisheries sector were eligible for EU aid to increase global competitiveness, add value to fisheries products, and develop infrastructure and tourism services, environmental protection and interregional and transnational cooperation.
The promotion of Priority Axis 4 on the sustainable development of fisheries areas through the European Fisheries Fund (EFF) was driven by the complex changes affecting the fisheries sector and the challenges facing European fishing communities. The main objective of Priority Axis 4 was the sustainable development of fisheries areas in order to minimize the decline of the fisheries sector and to support the conversion of areas affected by the changes in this sector. Axis 4 complements the short-term measures of the Common Fisheries Policy (CFP) through economic, social and environmental support measures to combat the depletion of fish stocks.
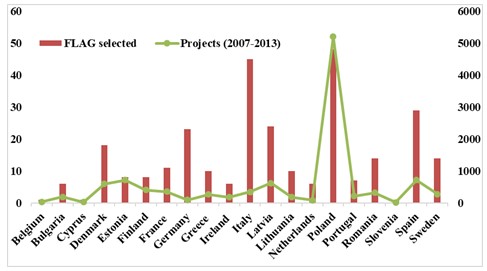
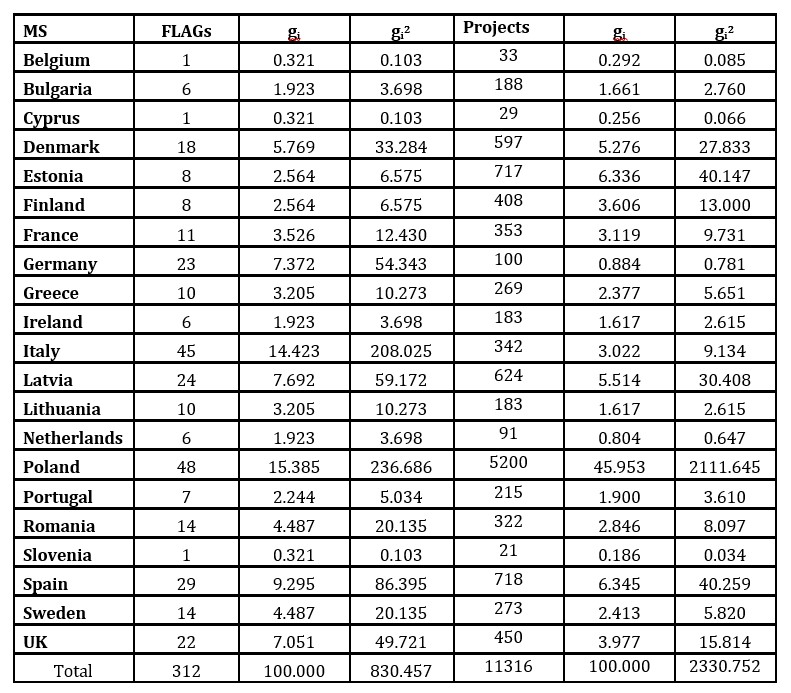
The implementation of the Axis 4 has been made by the direct implication of relevant actors in fishing areas, associated in Local Action Groups for Fishing (LAG, or FLAG in Romania) by elaborating and applying a strategy of durable development, in conformity with the needs of the specific area. In EU, the measures of Axis 4 have been done through 312 LAGs, and have implemented through 11,316 projects in 21 Member States MS (figure 4).
Figure 4: EU LAG`s and projects implemented on Axis 4
Source Author, by using European Commission Data (2015)
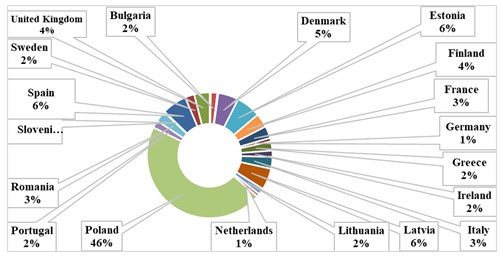
The number of LAGs in Member State ranges between one unit in Slovenia and 48 in Poland. Poland ranked the first position in EU, having 5,200 projects implemented and 319 million euro used for the Axis 4 measures. Poland is the country that has allocated the highest percentage to Axis 4, with over 45% of total Community funding for the fisheries sector (figure 5).
Figure 5: Share of funds allocated in Axis 4 by MS
Source Author, using European Commission (2014)
Poland is the state with the large number of inhabitants in eligible area (3,5 million), followed by Spain (3,4 million), and Germany (2,8 million) (figure 6).
Figure 6: Share of population and geographical areas benefiting
from the Axis 4 projects
Source Author, using EC (2015)
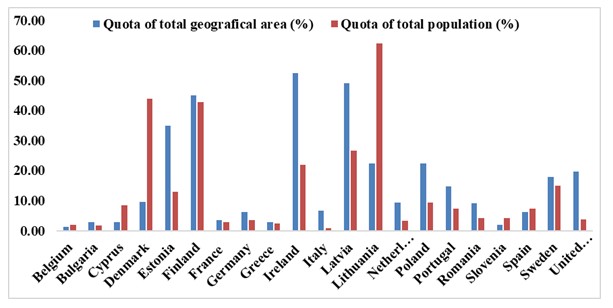
Regarding the implementation of the projects by LAGs, Finland, Spain and Poland are the Member States with the largest fishing areas for complementary fishing measures (Figure 7).
Figure 7: Areas and inhabitants in the eligible areas of Axis 4
Source Author, using European Commission (2014)
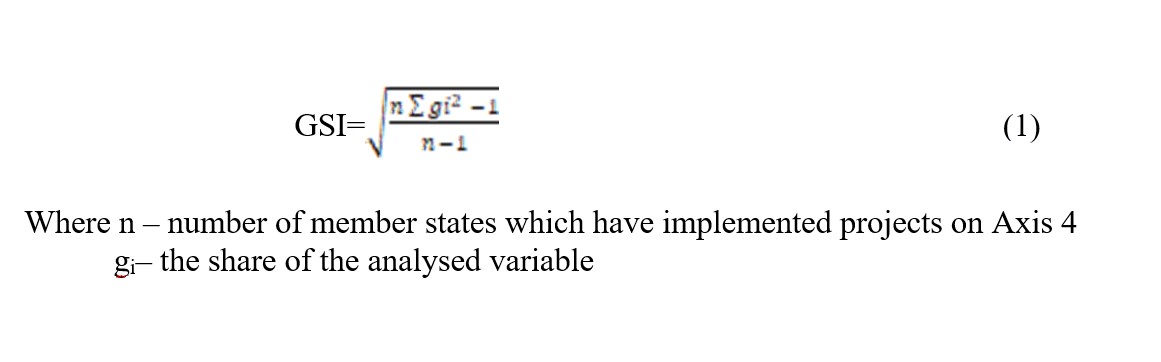
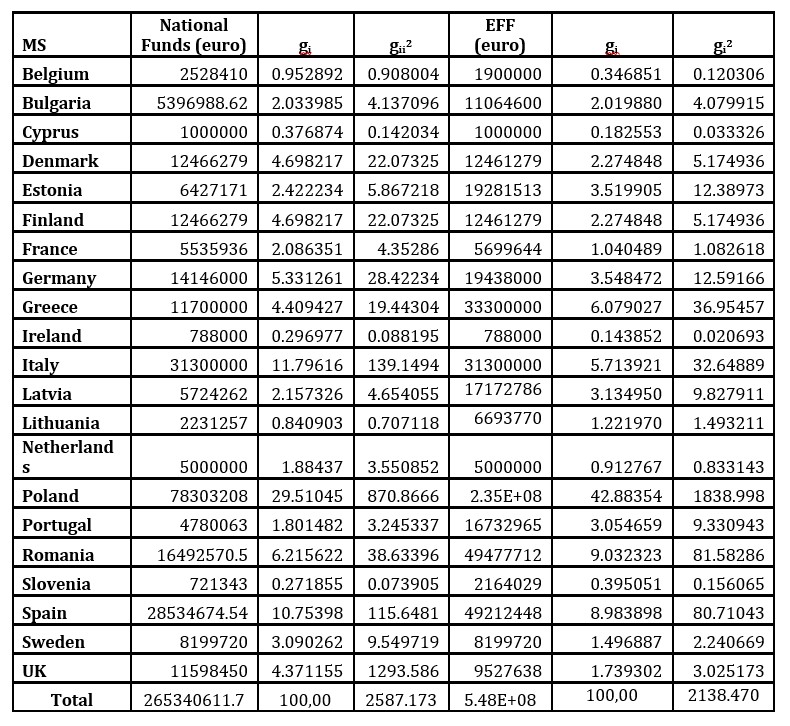
The concentration of projects and funds allocated by using Measures of Axis 4 can be analysed using the Gini Struck Method. The calculation of the Gini Struck Index GSI used the methodology proposed by Săvoiu, Crăciuneanu and Țaicu (2010) (formula 1)
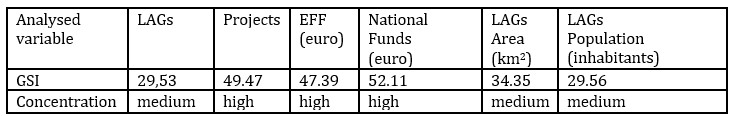
The results of the GSI are presented in table 1. The total EFF allocated to Axis 4 was 547,785,006.6 euro and has been distributed by 21 MS. 312 LAGs were created in EU, 11,316 projects have been approved for funding, and 27,427,311 inhabitants and of the targeted areas have benefited from these measures. The global area allocated to LAGs was 622,533.899 square km.
Table 1: GSI value for the variables considered
Source Author, using own research
The data presented in table 1 show a medium degree of concentration for the population, area and LAGs, while the number of projects and allocated funds has a high degree of concentration.
Conclusions
Attracting non-reimbursable Community funds in the fisheries sector could be an advantage for Member States to ensure food security. The analysis has shown that there is a high level of concentration for the EFF allocated to Axis 4 in the community, correlated with the number of projects submitted and financial support from governmental institutions. The size of the population in the target group, the eligible areas close to the fishing areas or the number of local groups built to implement complementary measures for the fisheries sector have a moderate level of concentration. There is no correlation between population size, eligible areas and attracted funds.
FAO (2001-2016), Fisheries and Aquaculture topics.Utilization and trade.Topics Fact Sheets. In: FAO Fisheries and Aquaculture Department [Online]. Rome. Updated 6 January 2016. [Retrieved March 06, 2016]. http://www.fao.org/fishery/utilization_trade/en,
Neculita, M. and Moga, L (2014), Specialisation and concentration of European Funds for agriculture and fisheries in Central and Eastern European Countries, Journal of Environmental Protection and Ecology 15, No 2, 660–668.
Săvoiu, G., Crăciuneanu, V., Țaicu, M., (2010).O metodă statistică nouă de analiză a concentrării sau diversifi cării pieţelor, Revista Română de Statistică nr. 2/2010, [Online]. [Retrieved March 10, 2016], http://www.revista destatistica.ro/Articole/2010/A3ro_2-2010.pdf.
Stanciu, S., (2014), Romanian fisheries in the European Community Context, in Economic and Social Development: Book of Proceedings, 8th International Scientific Conference on Economic and Social Development and 4th Eastern European ESD Conference: Building Resilient Economy, ISSN 1849-6903, 19 December, Zagreb, Croatia, 265-274.