The Bucharest University of Economic Studies, Bucharest, Romania
Volume 2019,
Article ID 726118,
Journal of Eastern Europe Research in Business and Economics,
27 pages,
DOI: 10.5171/2019.726118
Received date: 6 May 2019; Accepted date: 22 July 2019; Published date: 13 September 2019
Academic Editor: Nicoleta Dospinescu
Cite this Article as:
Mihai Dragnea (2019)," The Power of Personal Values on Customer Satisfaction and Retention", Journal of Eastern Europe Research in Business and Economics Vol. 2019 (2019), Article ID 726118, DOI: 10.5171/2019.726118
The study motive outlined in this article came from the need to better understand how customer retention strategies are adapting in the contemporary, ultra-dynamic economic environment, where traditional demographics are substituted by in-depth analytics of human behaviour. The paper summarizes some of the primary results of a study conducted during eight months (May 2017 – December 2018), utilizing an online self-administrated survey (with most of the inquiries on a Likert-type scale). The outcomes were handled with SPSS Statistics. The target group consisted of clients in Romania, urban area, active or self-employed, focusing on an extremely appropriate group for Romanian macroeconomic purchasing behaviour assessment: a greater level of education and earnings per individual. The main conclusions are showing direct links between traditional methods of measuring indicators related to Customer Satisfaction & Retention and chosen psychographics.
In a world where the future of Marketing Customer Management is facing exponential growth of advanced psychographics profiling instead of traditional, demographic segmentation, it becomes mandatory to explore and understand the vast eco-system of human behaviour in correlation with marketing elements. Also, as an important part of the global economy has a clear trend towards two main models, sharing economy (expected to spin to an arising concept of “Empathy Economy”) & subscription as a service, Customer Retention Strategies are rapidly increasing in importance as the above-mentioned models bring higher customer volatility than existing ones. In the same time, it was important to understand the relevance of the Customer Retention Strategies Needs proposal by Dragnea M. (2014), a research that was previously built based on the feedback received from 88 Romanian professionals involved in Customer Retention both strategy development & customer-facing functions. The main findings of the current research are covering the following directions: (1) the theory of Customer Retention Strategies Needs is confirmed; (2) strong and moderate statistical correlations between psychographics, demographics and several indicators related to Customer Retention were identified.
Objectives of the Research
Understand the level of satisfaction of consumers related to the Customer Retention Needs according to Dragnea M. (2014) and their correlations with traditional satisfaction Key Performance Indicators (KPIs).
Identify potential connections and correlations between traditional customer satisfaction, buying behaviour, previously identified Customer Retention Strategies Needs (Dragnea M., 2014) and the influence of Basic Values (Schwartz, Shalom H., 2012) in the customer behaviour.
Theoretic Considerations
Customer Retention and Loyalty – The concepts and confusion.
For better and clear understanding of the role of Customer Retention and related strategies, the definition provided in 1970 by German economist O. Hirschman was considered. This definition had the advantage of being self-explanatory, comprehensive in its simplicity, fully related to the customer behaviour and, at the same time, valid and actual across the majority of business models and organizations. Hirschman states that the opposite of retention is the answer of customers when the quality of the services and products offered by an organization is decreasing. He defined it as the exit option: “Some customers stop buying the firm’s products or some members leave the organization. […] As a result, revenues drop, membership declines, and management is impelled to search for ways and means to correct the elements which have led to exit.”(Hirschman, A.O. (1970). Exit, Voice, and Loyalty, USA: Harvard University Press).
As a confirmation that Hirschman’s definition dating almost half a century is still highly accurate, more recent works are using the same principle to explain Customer Retention. “Customer retention can be seen as the mirror image of customer defection, where a high retention rate has the same significance as a low defection rate.” (Rizal A. and Buttle F. (2001) Customer retention: a potentially potent marketing management strategy, UK: Journal of Strategic Marketing, Routledge).
Also, later on, Buttle confirms the initial definition and extends it: “Customer retention is the mirror image of customer defection or churn. High retention is equivalent to low defection. Customer retention is the maintenance of continuous trading relationships with customers over the long term.” (Buttle F. (2009) Customer Relationship Management – Concepts and Technologies, USA: Elsevier Linacre House). Though, it is arguable that the latest definition from Buttle can be at the border of the most common confusion between Customer Retention and Customer Loyalty, found in both practical and academic fields: the concepts are explained more from a lexical perspective: a loyal customer can also be considered a retained customer. For example, a similar definition with Buttle’s Customer Retention is given by Dixon, M., Freeman K., Toman, N. but for Customer Loyalty: “customers’ intention to continue doing business with a company” (Dixon, M., Freeman, K. and Toman, N. (2010), Stop trying to delight your customers, USA: Harvard Business Review).
One of the best interpretations on the differences between Customer Loyalty and Customer Retention is provided by Frances Frei, Professor of Service Management at the Harvard Business School: “When companies pay customers through discounts to remain customers, it’s a customer retention program. When companies invest in activities that increase customers’ willingness to pay a premium price, then they have a loyalty program.” (Frei. F. (2012). Uncommon Service: How to Win by Putting Customers at the Core of Your Business, USA: Harvard Business Review Press).
A definition for both Customer Retention & Loyalty that takes into account the above-mentioned differences is given by Dragnea M. (Dragnea M., (2016), This is Retention, Romania: ALL Publishing House): “Loyalty is the most desirable customer behaviour in relation to a brand, because it generates a feeling of attachment to the brand beyond rational arguments and thus, customers have no intention of leaving the brand. […] Customer Retention is the response organizations offer to customers who express in any way […] their intention to give up on their products or services, with the purpose of keeping the number of products in use, the number of clients and the revenues they generate.”
Also, another definition on Customer Loyalty that is adding value from a customer behavioural perspective is provided in the Chrestomathy of Marketing terms and concepts (Ristea, Ioan-Franc, Stegăroiu, Tănăsescu (2010), Romania: Expert Publishing House):
“Loyalty is the quality of the persons (A/N: customers) with stabile tastes, regular conduct, durable affective attachments (G. Serraf, 1985, p.113). Loyalty is distinguished as follows:
Loyalty towards a product (relative to the indirect competition);
Loyalty towards a type of distribution, a certain place for sale, a certain company;
Loyalty towards a brand.”
Therefore, for the purpose of this paper, when referring to Customer Retention and Customer Loyalty, the main differentiator is the customers’ intention (i.e. behaviour) – if there is no intention, then a Customer Loyalty strategy is in order to further increase revenue, while if there is an intention to churn, Customer Retention strategies are most suitable to keep the customer.
Customer Retention Strategies Needs
Previous researches conducted by Dragnea M., (2014, 2016), Dragnea M. and Mihăiță N. (2017) identified five needs of Customer Retention Strategies, as following, in order of their importance (with short version of terminology to be used further in this paper):
Knowing the customers and availability of information about them (Know your customers);
Retention strategies’ adaptability to external and internal customers’ feedback (Adaptability);
The power to influence customer decision (Influence decisions);
Freedom to decide the way to retain customers (Freedom in the decision of Retention);
The level of power you have to make changes (Power to Change);
The results of these researches were obtained by questioning Romanian professionals actively working on Customer Retention Strategies and customer-facing related functions.
Theory of Basic Human Values – Shalom H. Schwartz (Schwartz, Shalom H. (2012). An Overview of the Schwartz Theory of Basic Value, USA: Online Readings in Psychology and Culture).
According to Schwartz, human values are representing what is most important in human life, without any limitation related to the number of values or their levels of importance and with a unique combination for every individual. His Theory of Basic Human Values is built based on the conception that, when defining a personal, human value, it needs to have certain core features:
“Values are beliefs linked inextricably to affect.
Values refer to desirable goals that motivate action.
Values transcend specific actions and situations.
Values serve as standards or criteria.
Values are ordered by importance relative to one another.
The relative importance of multiple values guides action. Any attitude or behaviour typically has implications for more than one value.”
Schwartz defines ten values while having, as main arguments, the fact that values have an increased probability of being universal “as they are grounded in one or more of three universal requirements of human existence with which they help to cope.” – (1) needs as biological organisms; (2) social interaction; (3) groups welfare and survival needs. The ten values according to Schwartz are: “Self-direction, Stimulation, Hedonism, Achievement, Power, Security, Conformity, Tradition, Benevolence, Universalism”.
According to Schwartz, each value has its own defining goal and responds to a specific behavioural need. “Self-direction: independent thought and action-choosing, creating, exploring.” Addressing the needs of control, independence, mastery (i.e. values as freedom, curiosity, creativity);
“Stimulation: excitement, novelty, and challenge in life.” Answering the needs of diversity, stimulation for obtaining a rather positive level of energy than a frightening one (i.e. a varied life);
“Hedonism: pleasure or sensuous gratification for oneself.” As a response to the need of satisfying personal pleasure (i.e. pleasure);
“Achievement: personal success through demonstrating competence according to social standards.” Emphasizing the needs of reaching objectives, competence as imposed by social context (i.e. ambitious, successful);
“Power: social status and prestige, control or dominance over people and resources.” Feeding the needs of having authority, dominance, control (i.e. wealth, social recognition and power);
“Security: safety, harmony, and stability of society, of relationships, and of self.” Sustaining the needs of security either individual (i.e. health) or groups related (i.e. national security);
“Conformity: restraint of actions, inclinations, and impulses likely to upset or harm others and violate social expectations or norms.” Fulfilling the needs of avoiding disruption and undermining others (i.e. obedience, self-discipline).
“Tradition: respect, commitment, and acceptance of the customs and ideas that one’s culture or religion provides.” Assuring the fulfilment of needs related to social groups practices, sometimes preconceived ideas regarding faith, destiny (i.e. respect for tradition, moderation);
“Benevolence: preserving and enhancing the welfare of those with whom one is in frequent personal contact (the ‘in-group’).” Obtaining a response for the needs of affiliation, pro bono care for the well-being of others (i.e. helpful, loyal, forgiving);
“Universalism: understanding, appreciation, tolerance, and protection for the welfare of all people and for nature.” Deriving from the needs of survival of individuals and larger groups, as a resort for accepting that others are different to avoid perceived life-threatening conflict.
Also, Schwartz addresses the dynamics of the relationship between the ten basic values, proposing a circular, continuum structure in order to better define the motivational triggers when certain values are adjacent. He groups the values as following:
“Power and achievement: social superiority and esteem;
Achievement and hedonism: self-centred satisfaction;
Hedonism and stimulation: a desire for affectively pleasant arousal;
Stimulation and self-direction: intrinsic interest in novelty and mastery;
Self-direction and universalism: reliance upon one’s own judgement and comfort with the diversity of existence;
Universalism and benevolence: enhancement of others and transcendence of selfish interests;
Benevolence and tradition: devotion to one’s in-group;
Benevolence and conformity: normative behaviour that promotes close relationships;
Conformity and tradition: subordination of self in favour of socially imposed expectations;
Tradition and security: preserving existing social arrangements that give certainty to life;
Conformity and security: protection of order and harmony in relationships;
Security and power: avoiding or overcoming threats by controlling relationships and resources.”
Method
Overview
The research was done during an eight month timeframe (May 2017 – December 2018) to assure increased relevance by avoiding a time-context subjectivism of answers, using an online self-administrated questionnaire, with the majority of questions on a Likert-type scale. The choice of an online self-administrated questionnaire was considered the best option as it is aligned with the method currently widely used by companies when asking for feedback from their customers – therefore, a similar method was needed to avoid comparations discrepancies.
Also, the Likert-type scales were completed with low-end, middle and high-end verbal labels to bring more clarity for the respondents and increase the accuracy of the answers. (Krosnick J.A., (2009), Question and Questionnaire Design, Handbook of Survey Research (2nd Edition), USA: Emerald Publishing Group Limited).
Target Group
The main target group were customers in Romania, urban area, actively employed or self-employed, with focus on the most influencing and relevant for purchase behaviour analysis group in the Romanian macro-economy: a higher level of education and income per person. The assumption used for this research was that this group has the enlarged ability to change their behaviour in a less restrictive manner, as they hold both the financial conditions and education levels to make choices with a lower level of external constrains (i.e. low income per person generates a buying behaviour towards the cheaper products/services).
The questionnaire.
The questionnaire was structured in three parts:
Traditional demographics (i.e. age, gender);
Brand evaluation on General Satisfaction with the Brand in the last year (further named Customer Satisfaction Score), Churn Intention, Evaluation of Customer Retention Strategies Needs. Besides, responders were asked for how long they are using the evaluated Brand (Customer Age) and what is the main channel of interaction (Online, Using the services, Physical store).
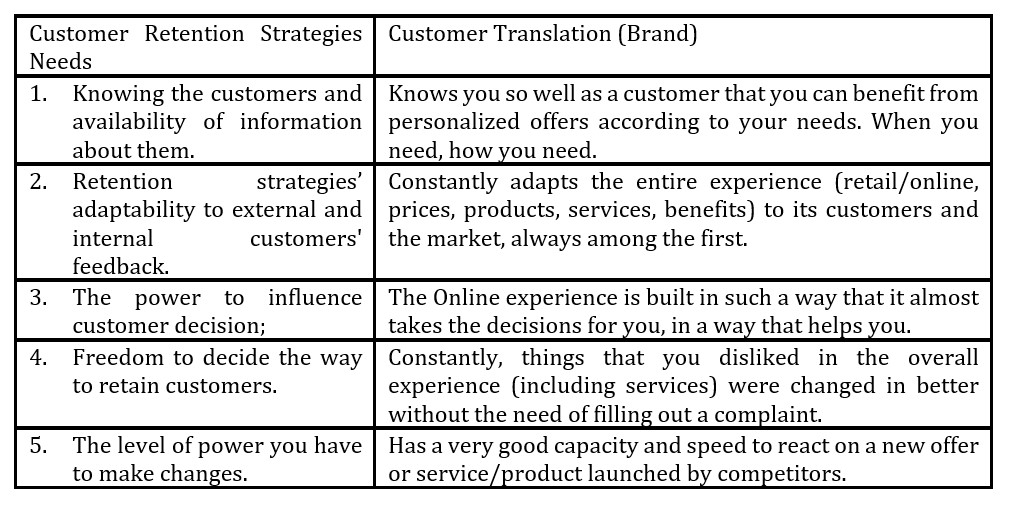
Further, the Customer Retention Strategies Needs were translated in a customer perspective, aligned with the current economic environment, increasingly oriented to the online buying experience.
Table 1: Customer Retention Strategies Needs to Customer Translation
The scales used for measuring the main brand-related indicators were:
Customer Satisfaction Score: from 1 to 10, where 10 is “very satisfied” and lower or equal to 7 is considered “Dissatisfied”;
Brand performance related to the Customer Retention Strategies Needs: from 1 to 10, where 10 is “very good performance”;
Churn Intention: from 1 to 5, where 1 is “no intention”.
Personal Values (based on Schwartz’s theory) – a choice of top three according to importance – concerning the purpose of this paper we considered the first choice – the Most Important Value;
An additional note: the level of interference with the answers was limited as the total list of values was not entirely and one-time displayed. When the main question was prompted (“What is your most important value?”), there was no value listed so respondents needed to type a value from their top of mind. Also, to avoid mislabelling of potential free text and less accurate answers due to lack of presence for the top of mind value were included as choices similar lexical variations (synonyms) of the same value (i.e. wealth – money).
Data collection and analysis
Data were collected while assuring full anonymity of respondents (to reduce social desirability bias) and up to date methods for distribution of the questionnaire, across communities considered representative for the chosen target group (i.e. social media – including paid ads, email).
The data was prepared and analysed using SPSS Statistics. The total number of responses analysed was 345 with a Cronbach’s Alpha of .771 on 7 items (Customer Satisfaction Score, Churn Intention and satisfaction with Customer Retention Strategies Needs – 5 items).
Results
1st set of results & preliminary conclusions.
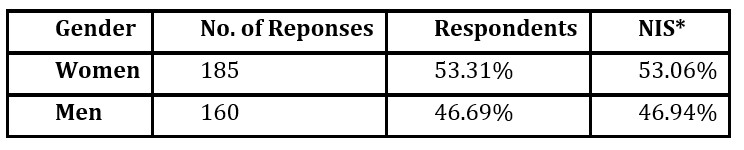
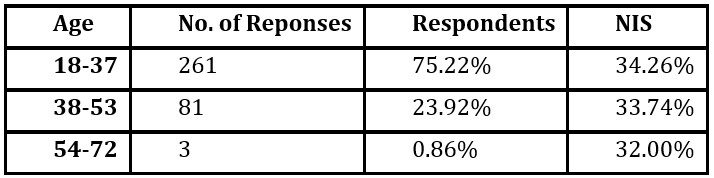
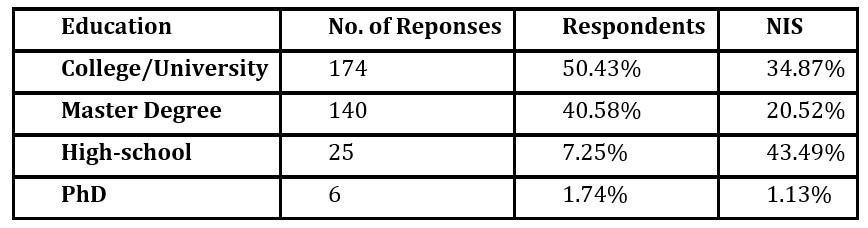
Demographic profile of the target group (*NIS stands for National Institute of Statistics in Romania):
Table 2: Demographic profile, Gender
Table 3: Demographic profile. Age
Table 4: Demographic profile, Education
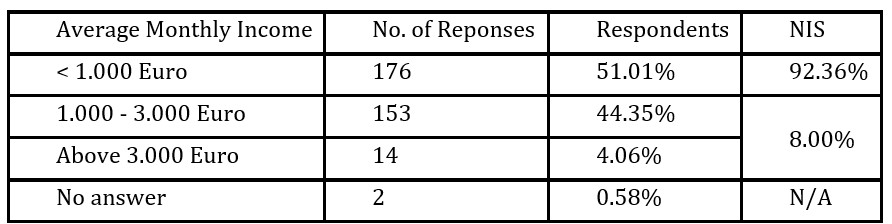
Table 5: Demographic profile, Income
As seen above, the gender distribution was in line with the Romanian NIS reported distribution, while the age, education and average monthly income distribution confirmed the validity of the focus target of this research.
Brand evaluation:
The respondents were asked to evaluate a Brand in three areas:
Customer Satisfaction Score
Churn intention
Brand performance related to Customer Retention Strategies Needs (see Table 1).
Customer Satisfaction Score (on a scale from 1 to 10, where 10 is “very satisfied”);
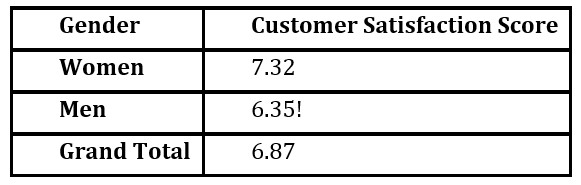
Table 6: Customer Satisfaction Score, Gender
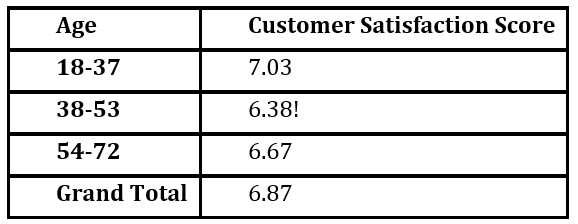
Table 7: Customer Satisfaction Score, Age
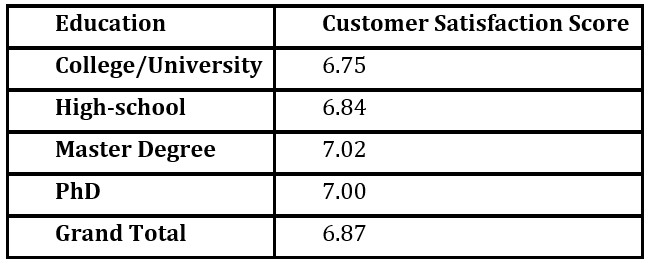
Table 8: Customer Satisfaction Score, Education
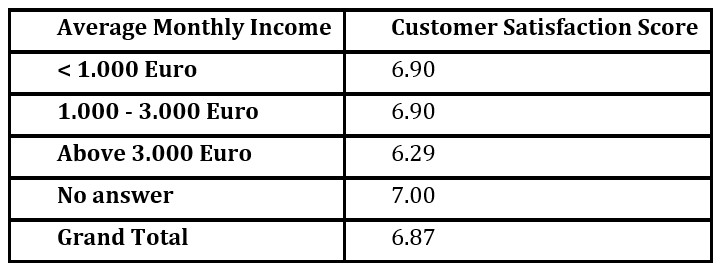
Table 9: Customer Satisfaction Score, Income
Preliminary Conclusions:
An average level of Customer Satisfaction at 6.87 while the respondents were referring to a Brand at their choice, shows a tendency among respondents to share rather less pleasant experiences.
An accentuated tendency of sharing the less pleasant experiences can be identified for the Men group (-14% vs. average), the 38-53 age group (-9% vs. average).
The other demographic segments are not showing any potentially significant differences (or no. of responses is less relevant – see “Above 3000 Euro” group).
Churn intention (on a scale from 1 to 5, where 1 is “no intention”)
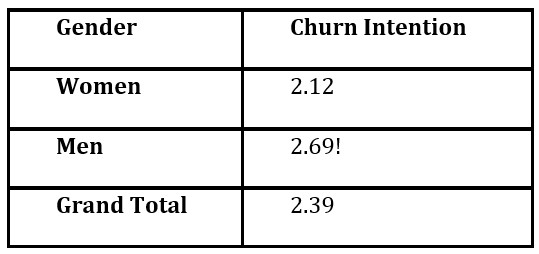
Table 10: Churn Intention, Gender
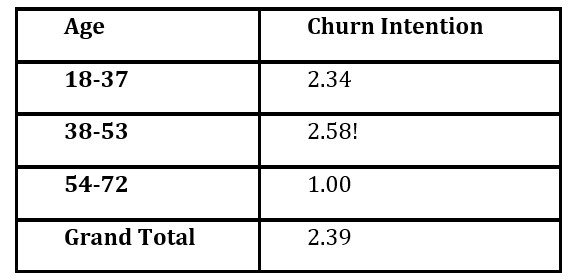
Table 11: Churn Intention, Age
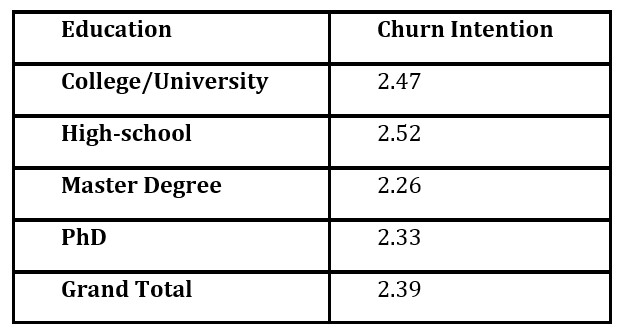
Table 12: Churn Intention, Education
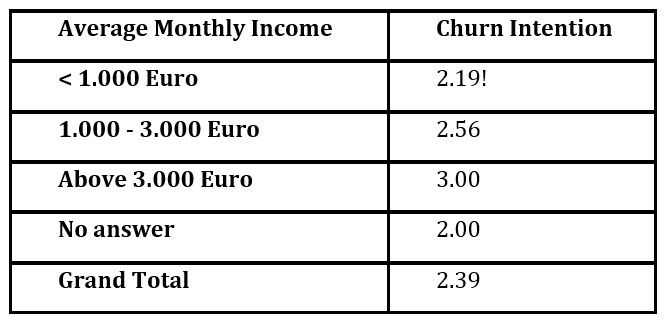
Table 13: Churn Intention, Income
Preliminary Conclusions:
An average level of Churn Intention at 2.39 shows a balanced approach from the customers when thinking about churning, although the level of satisfaction, as we saw, is closer to being dissatisfied.
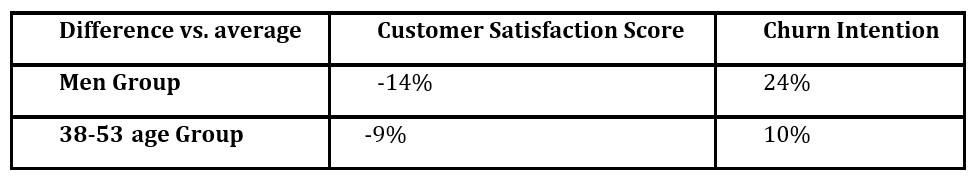
When analysing the Churn Intention for the segments with potentially significant differences in Customer Satisfaction Score vs. average (Men & 38-53 age groups) (see Table 14), a positive potential significant difference can be found, with a valid question to be answered further in this paper: Is there a statistical significant correlation between Customer Satisfaction and Churn Intention?
Table 14: Customer Satisfaction Score & Churn Intention – specific group
Also, another group stands out (<1000 Euro Average Monthly Income) with an 8% potentially significant difference vs. average.
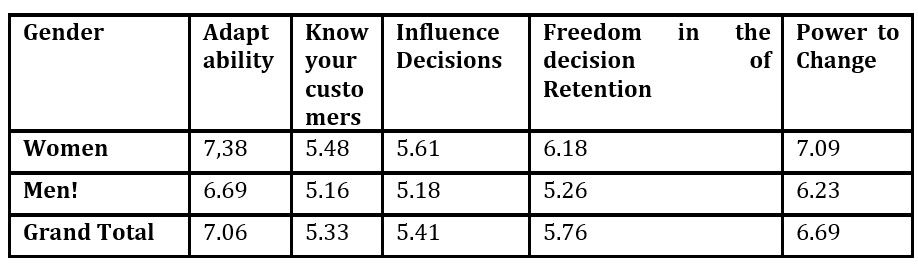
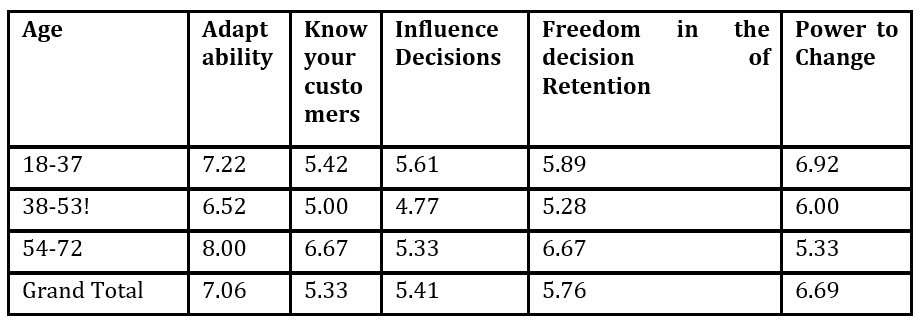
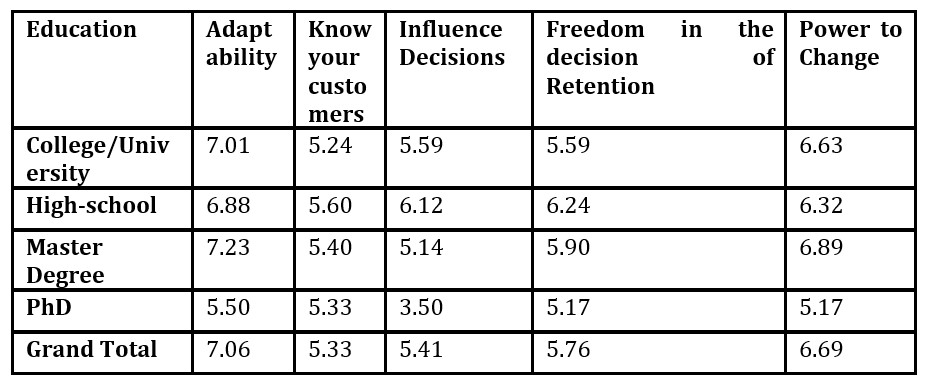
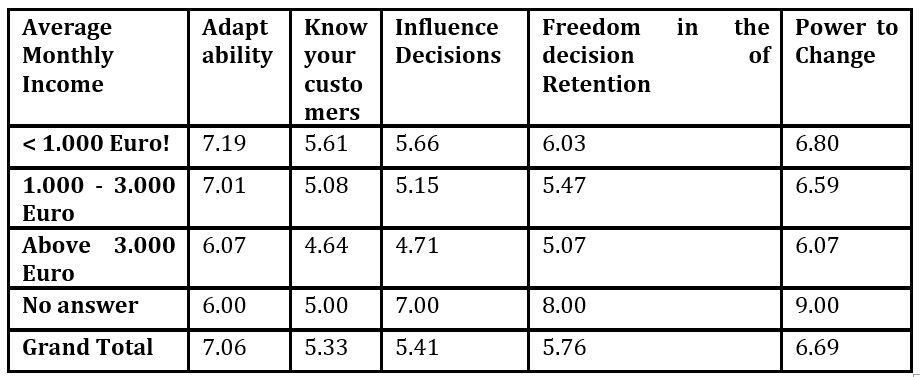
Brand performance related to the Customer Retention Strategies Needs
Preliminary conclusions: (1) Customers are mostly satisfied with the level of Brand Adaptability (7.06) and with the Brand’s Power to Change (6.69); (2) The lowest level of satisfaction is for the most important Customer Retention Strategy Need (Know your customers) – showing an important gap between Customer Retention professionals answers and how a Brand performs in the customers’ perception;
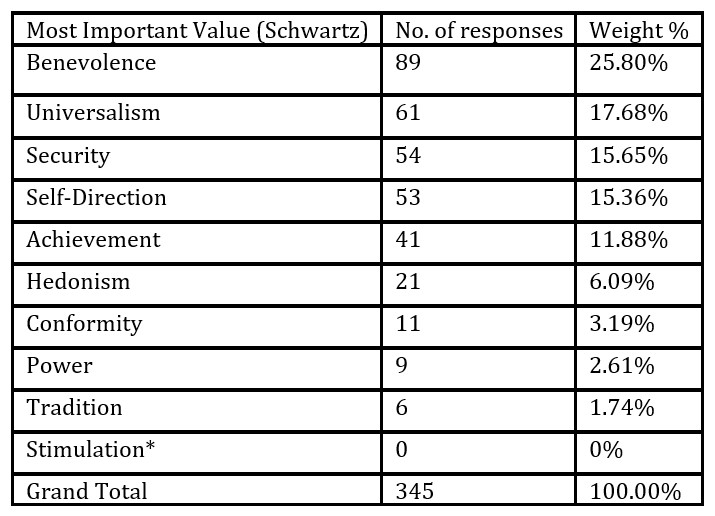
Personal Values (based on Schwartz’s theory) – Most Important Value;
Overall distribution:
Table 19: Schwartz – Most Important Personal Value
*The attributes related to the Stimulation value were not chosen by the respondents as being the most important (will not be used further in the paper).
Preliminary conclusions: according to Schwartz’s research conclusions (2012) “the vast majority of nations studied, benevolence, universalism, and self-direction values appear at the top of the hierarchy and power, tradition, and stimulation values appear at the bottom.” As it can be seen, with a minor difference between Security and Self-direction, the distribution of the Most Important Value is aligned with the Schwartz’s theory, concluding that the structure and quality of this research are both valid and accurate.
Most Important Value distribution (demographics):
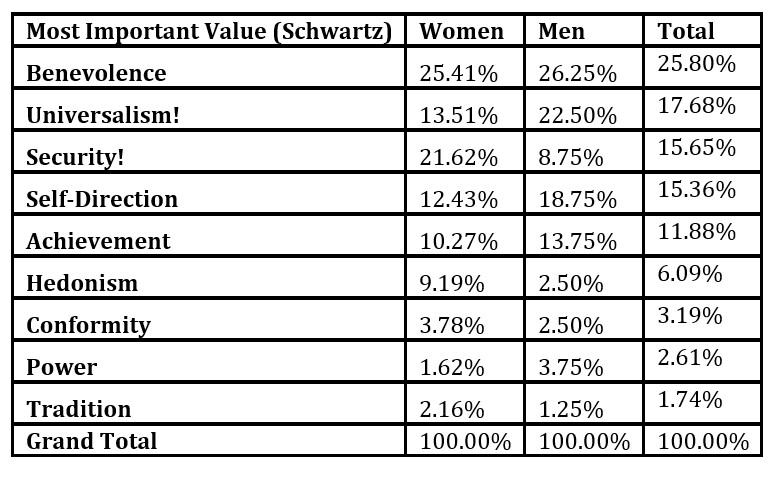
Table 20: Schwartz – Most Important Personal Value, Gender
Preliminary conclusions: two values have a potentially significant difference between Men and Women groups: Universalism & Security. The Men group is more oriented to Universalism in correlation with a higher level of importance for Self-Direction – based on Schwartz’s theory on the continuum structure, this shows “reliance upon one’s own judgment and comfort with the diversity of existence”. The Women group is highly oriented to Benevolence and Security in the detriment of Universalism – according to Schwartz’s observations Benevolence and Universalism are in contrast. Also, it is important, from the behaviour analysis perspective, to underline that, according to Schwartz, the combination of Universalism and Benevolence values expresses a higher level of anxiety-free motivations, while Security value expresses a way to manage anxiety.
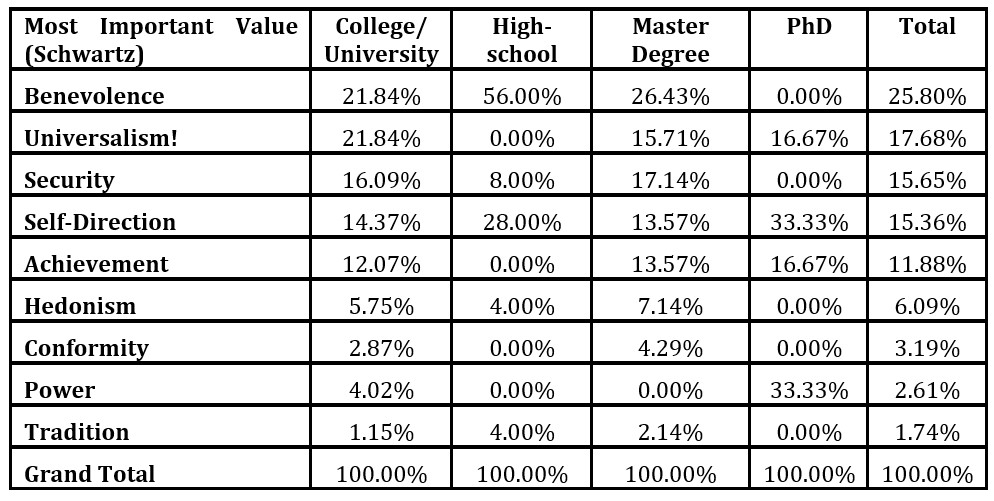
Table 21: Schwartz – Most Important Personal Value, Education
Preliminary conclusions: while excluding from the current analysis the High-School & PhD groups (due to a low number of responses vs. number of values analysed), potentially significant difference is found for Universalism and Benevolence values in College/University graduates vs. Master Degree. According to Schwartz, “Universalism values derive from survival needs”, “Benevolence values derive from the basic requirement for smooth group functioning (cf. Kluckhohn, 1951) and from the organismic need for affiliation”. So, it is viable to conclude that superior level of education comes with an increased focus for the need of belonging? Interesting to underline this in correlation with the fact that the Master Degree group represents 20% of the total population in Romania vs. 34% for College/University – therefore, a question arises: is it true that: the smaller the community you are part of, the higher the need of affiliation?
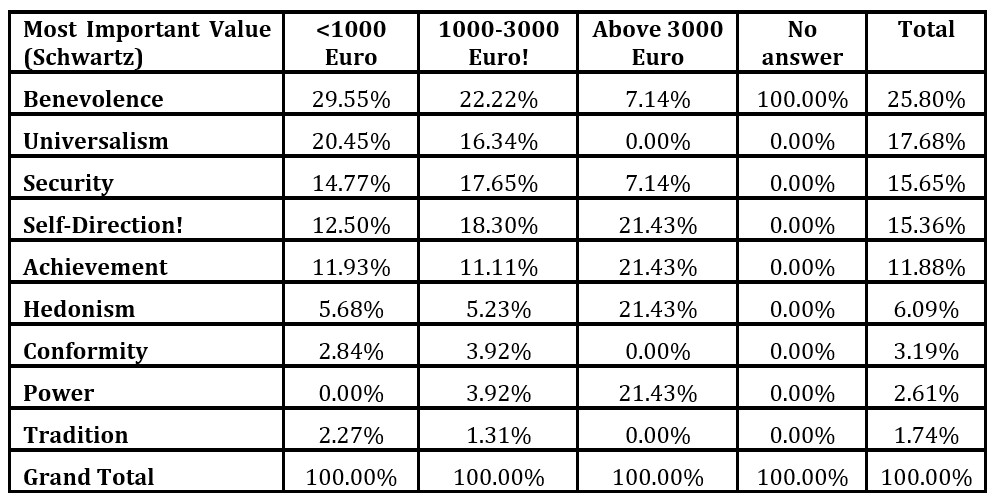
Table 22: Schwartz – Most Important Personal Value, Income
Preliminary conclusions: the same trend as above is present for the Average Monthly Income indicator for <1000 Euro and 1000-3000 Euro groups. In addition, the Self-Direction value is second in choice for the 1000-3000 Euro group and in the <1000 Euro group is in the fourth place. Besides, while acknowledging the low relevance of data for the Above 3000 Euro group in relationship with the number of values analysed, a structural change vs. other groups can become subject of future researches.
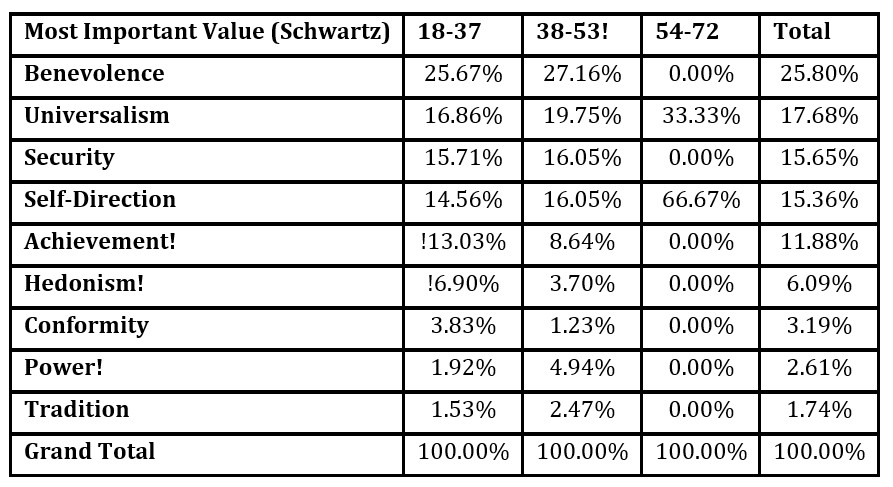
Table 23: Schwartz – Most Important Personal Value, Age
Preliminary conclusions: the segmentation per age groups does not show potentially significant differences related to the order of choice for the Most Important Value. Though, it is important to underline that for the 38-53 group, the top four choices have higher weight vs. the 18-37 group. Interesting to observe that the 18-37 group has higher weights on Achievement and Hedonism. According to Schwartz, the continuum of related motivations of the two values represents a “self-centred satisfaction” motivation.
Preliminary conclusions summary:
The research is valid and accurate from both NIS reported distribution related to the proposed target group characteristics and in relationship with Schwartz’s Theory of Basic Human values;
The level of Customer Satisfaction is oriented rather towards dissatisfaction. Therefore, to identify a potential “sweet-spot” that increases the satisfaction, two new metrics were added to segment this indicator: Main Channel of Interaction and Customer Age (the time since a customer bought the chosen Brand for the first time);
The level of customer satisfaction on Customer Retention Strategy Needs is showing a significant gap vs. the responses provided by Customer Retention professionals.
The Most Important Value (based on Schwartz’s theory) is showing potentially significant differences when analysing the results based on demographic characteristics.
2nd set of results and preliminary conclusions:
Customer Satisfaction Score, Churn Intention and Customer Retention Strategy Needs.
Level of correlation between the above-mentioned metrics.
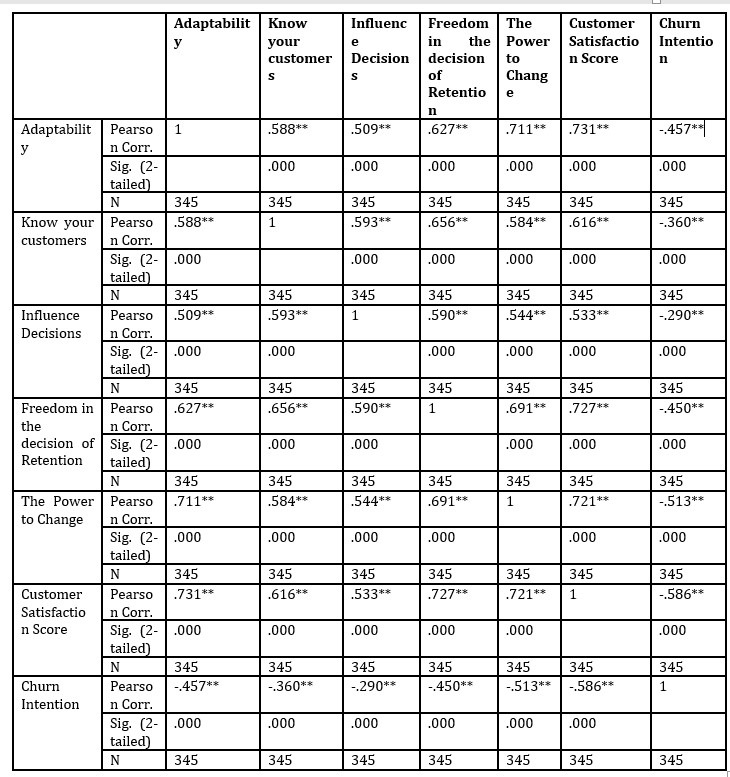
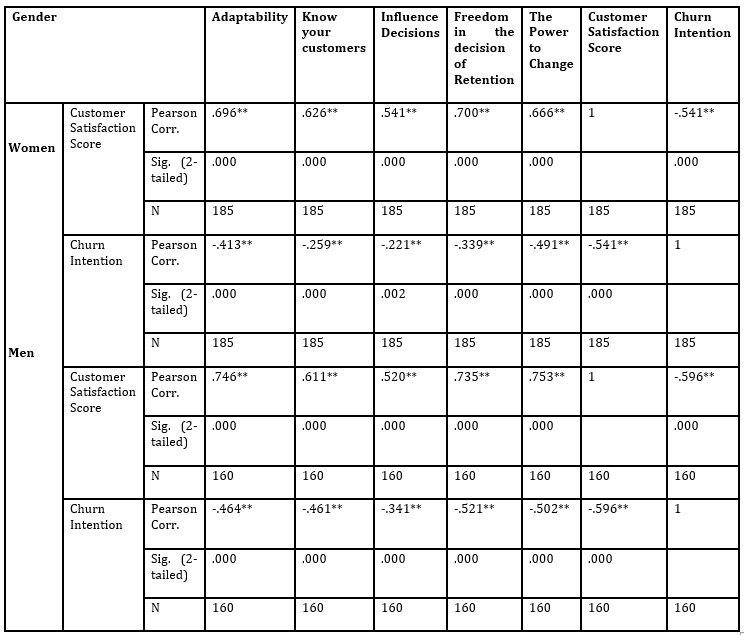
As showed in Table 24 (below), when analysing all the responses, all the metrics show moderate and strong correlations. Customer Satisfaction positively and strongly correlates, in this order, with: Adaptability, Freedom in the decision of Retention, Power to Change and Know your customers; moderately with Influence Decisions; moderately negative with Churn Intention. Also, as provided in Table 25 (below), and aligned with the preliminary conclusions, for the Men group, the correlations are slightly higher across all metrics.
Therefore, the level of customers’ satisfaction with the Customer Retention Strategy Needs is influencing both the Customer Satisfaction Score & Churn Intention metrics, validating the initial premises.
Table 24 – Correlations (**. Correlation is significant at the 0.01 level (2-tailed).)
Table 25: Correlations (**. Correlation is significant at the 0.01 level (2-tailed).)
Metrics for segmenting the Customer Satisfaction Score: Main Channel of Interaction and Customer Age:
As previously concluded, the Customer Satisfaction Score in this research is closer to the dissatisfaction area. This being the case, two new metrics were added to identify if a certain experience and level of loyalty (measured in Customer Age) that can move the score towards “satisfied”. The distribution of the Customer Satisfaction Score is as follows:
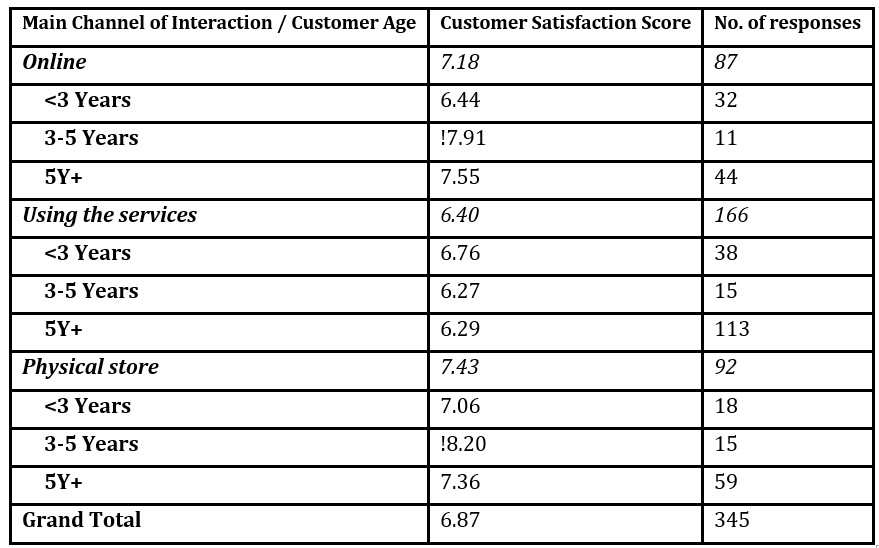
Table 26: Customer Satisfaction Score – Main Channel of Interaction & Customer Age
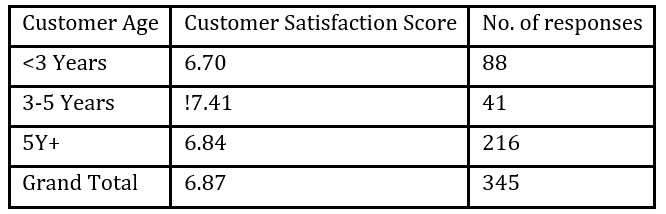
Table 27: Customer Satisfaction Score – Customer Age
Preliminary Conclusions:
The experience in the Physical store has the highest Customer Satisfaction Score, followed by Online and Using the Services;
The “sweet-spot” for Customer Age is 3-5 Years, except for cases where the customers are mostly interacting with the Brand by using services.
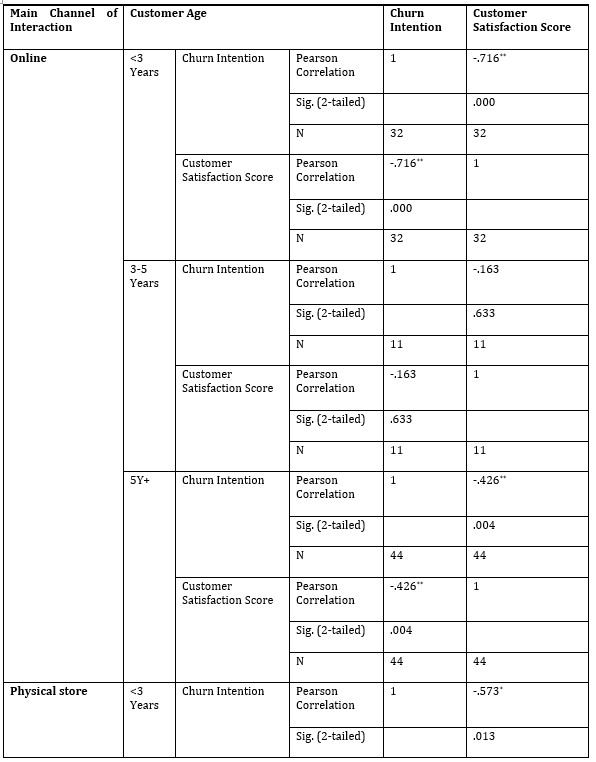
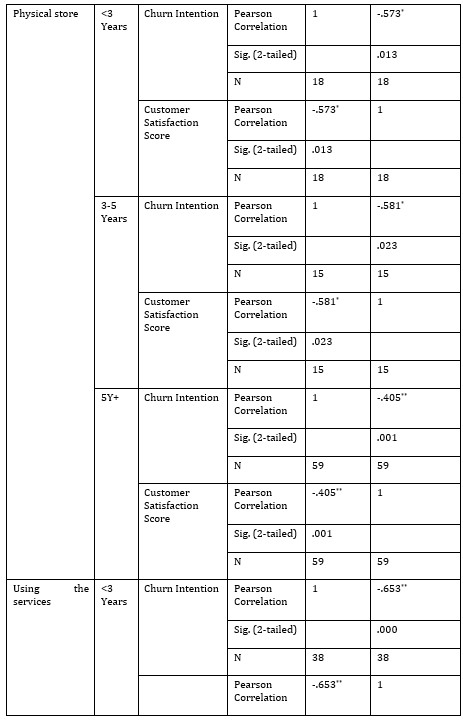
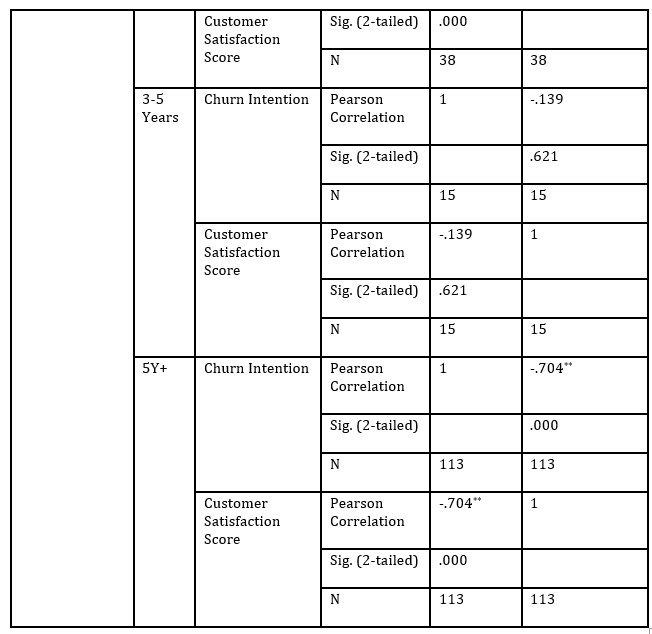
In addition to the analysis of the Customer Satisfaction Score in relation with Main Channel of Interaction & Customer Age, the correlation matrix (Table 28 below) is partially confirming the relevance of the finding:
the highest levels of correlations between Customer Satisfaction Score and Churn Intention (moderate and strong) are for the <3 Years and 5Y+ groups, except for the Physical Store, where the level of correlation is close to similar, irrespective of Customer Age group.
the highest correlations between Customer Satisfaction Score and Churn Intention (strong) are found for “Online & <3 Years” and “Using the Services & 5Y+” groups;
Table 28: Correlations (**. Correlation is significant at the 0.01 level (2-tailed).)
Most Important Value vs. Customer Satisfaction Score & Churn Intention.
If, from the demographic perspective, certain variations vs. the Most Important Value (based on Schwartz’s Theory of Basic Human Values) are identified, in order to achieve the objective of the current research, it is mandatory to understand if there is any relationship between the personal values of customers, their level of satisfaction or intention to churn. For an increased relevance and accuracy of the conclusions, there were selected only cases where the number of responses is above 35 (representing at least 10% from total).
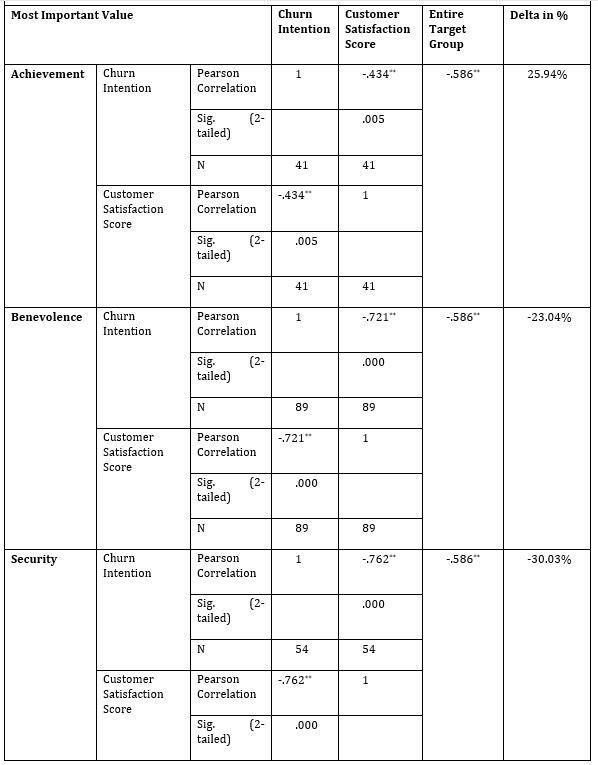
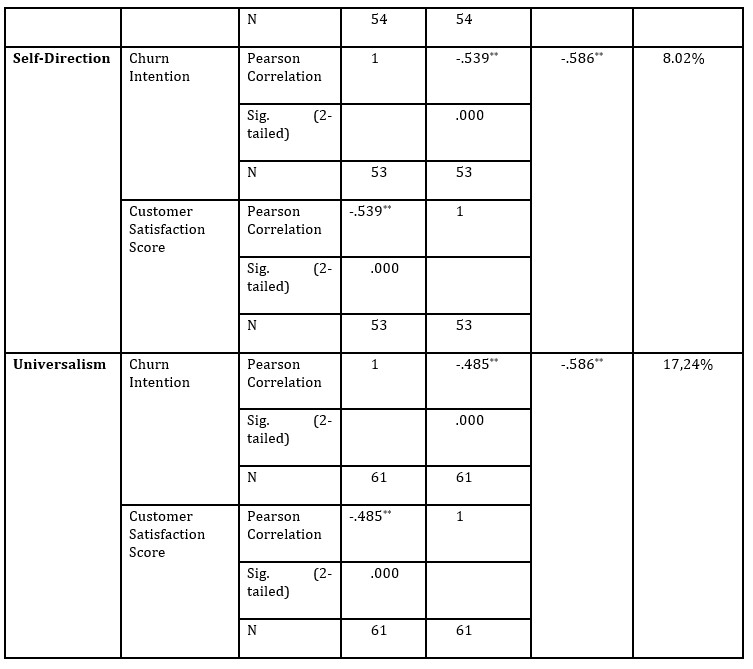
As represented in Table 29 (below), for the following Most Important Values, the Pearson Correlation between Customer Satisfaction Score and Churn Intention is higher than the one for the entire sample of answers (-.586):
Based on Schwartz’s observations, “Security values derive from basic individual and group requirements (cf. Kluckhohn, 1951; Maslow, 1965) […]”. Also, when choosing a Security value, people tend to avoid changes and conflicts. Some questions are arising for future researches: Is churning a strong change in a customer’s life? If yes, this need is influencing their level of Customer Satisfaction by considering themselves satisfied because they don’t want to change the Brand?
As for the Benevolence, Schwartz mentions that it “derives from the centrality of positive, cooperative social relations in the family, the main setting for initial and continuing value acquisition.”. Questions that might be of interest: are the customers that chose Benevolence influenced in their decision by their close friends and family? If yes, then, to retain them, a Brand needs to be communicated both to them and their closest ones?
The other values selected in Table 29 (below) are showing moderate correlation: Self-direction, Universalism and Achievement.
Table 29 : Correlations (**. Correlation is significant at the 0.01 level (2-tailed).)
When analysing the Customer Satisfaction Score and Churn Intention using traditional demographic dimension, there were mainly two groups (Men & 38-53 Age Group) for which scores prove to be significantly different vs. average. Also, for Churn Intention, the group with Average Monthly Income below 1000 Euro stood out. More precisely, women declared that tend to be more satisfied with Brand than men, but also their declared intent to churn is higher, while men are less satisfied with Brand together with a lower declared intent to churn.
The second dimension analysed in the research was composed of Customer Age and Main Channel of Interaction. The results reveal two major directions: (a) customers with 3-5 Years of Customer Age tend to be the most satisfied with Brand in addition to a potentially absent correlation between Customer Satisfaction Score and Churn Intention; (b) for Online and Physical Store channels of interaction, customers with <3 Years of Customer Age tend to be the least satisfied with Brand while the level of correlations between Customer Satisfaction Score and Churn Intention is the highest.
When adding to the above conclusions the fact that customers with Average Monthly Income below 1000 Euro have a higher declared intent to churn and the 38-53 Age Group has a lower declared intent to churn, three valid hypotheses to be further analysed in larger-scale researches are in order:
Are women with Average Monthly Income below 1000 Euro more prone to churn than men?
The age is itself a predictor of Customer Satisfaction and/or Churn Intention?
The customers most prone to churn are the ones interacting with a Brand Online or in Physical Store with <3 Years of Customer Age?
A positive response to these hypotheses can be effectively used in practice by building different Customer Retention Strategies in accordance with gender, income, Customer Age and Main Channel of Interaction.
Customer Retention Strategies Needs.
The two dimensions analysed in the research were: demographic segmentation and statistical correlation levels between the five needs, in relationship with Customer Satisfaction Score and Churn Intention.
The demographic perspective confirms the trends mentioned above – Men & 38-53 Age Groups tend to be less satisfied with the Brand performance. The statistical correlation dimension is significantly relevant for the first objective of this research (Understand the level of satisfaction of consumers related to the Customer Retention Needs and their correlations with traditional satisfaction KPIs) – all the five dimensions of the Customer Retention Needs (Adaptability, Knowing your customers, Influencing Decisions, Freedom in the decision of Retention, Power to Change) have medium and strong correlations between them and also with Customer Satisfaction Score and Churn Intention (negative).
Therefore, Customer Retention Needs theory is also supported by customers’ answers. With a more in-depth analysis on a larger sample of customers, the proposed structure can be transformed in new a standalone business model. In practice, the five elements of the potential model can be used as main pillars for Customer Retention strategies – for example, an investment in Adaptability has the significant potential to lower the Churn Intention.
Most Important Value vs. Customer Satisfaction Score and Churn Intention.
The second objective of the research was to identify potential connections and correlations between traditional customer satisfaction, buying behaviour, previously identified Customer Retention Strategies Needs (Dragnea M., 2014) and the influence of Basic Values (Schwartz, Shalom H., 2012) in the customer behaviour.
Essentially, the objective can be considered achieved. Important variations of correlations between Customer Satisfaction Score and Churn Intention, depending on the Most Important Value choice are described in the results. For customers having Security or Benevolence as Most Important Value, the level of correlation is -.762 and -.721, whilst for the ones who chose Achievement or Universalism, is -.434 and -.485. The interpretation of these results, beyond the solid affirmation that personal values clearly have a strong potential to influence the Customer Satisfaction Score and Churn Intention, can be extended to a broad analysis from the psychological theories perspective.
For example, according to Schwartz, Security value has as a defining goal “sustaining the needs of security” and expresses a way to manage anxiety. According to a study done in 2010 (Heilman, M.R., Crișan G.L., Houser D., Miclea M., Miu A.C., (2010), Emotion Regulation and Decision Making Under Risk and Uncertainty, (USA: American Psychology Association) anxiety is associated with the decreased ability in decision-making. In correlation with the Churn definition (which, in fact, is a decision to quit a product or service previously used), it is important to conclude that there is an important potential to predict Churn Intention based on psychographics. Ipso facto, longitudinal research enhanced with more psychographic elements based on psychology theories and psychology expert interpretation is firmly recommended.
Findings Summary
Taking into account the two main objectives of the current research (1) Understanding the level of satisfaction of consumers related to the Customer Retention Strategies Need and their correlations with traditional satisfaction KPIs & (2) Identifying potential connections and correlations between traditional customer satisfaction, buying behaviour and the influence of Basic Values (Schwartz, Shalom H., 2012) in the customer behaviour, the following main conclusions are relevant and scientifically accurate:
The theory of Customer Retention Strategies Needs is confirmed in terms of main directions also by the responses obtained from customers;
There are strong and moderate correlations between Customers Strategies Needs and traditional satisfaction KPIs like Customer Satisfaction Score or Churn Intention, depending on demographics specifics (i.e. gender, age, income);
There is a clear association between the traditional way of measuring customer satisfaction and behaviour related psychographics (in this case, personal values) with strong differences between certain groups (both demographic and values segmentation);
This area of research needs to be further explored and developed, as the economic environment moves with exponential speed towards human behaviour micro-segmentation.
Limitations and Future Research
The limitations of this research are mainly caused by the methodology used to collect the responses, as a certain degree of subjectivism and the gap between actual answers and actions of the respondents. To minimize the impact of these limitations, several longitudinal studies with a focus on actual customer behaviours and psychographics is recommended. Also, we recommend using more complex statistical methods (see MONALIS, Prof. Dr. Mihăiță N.).
Acknowledgment
I thank Prof. dr. Niculae Mihaiță, PhD Univ. Professor, The Bucharest University of Economic Studies, Bucharest, Romania who invested valuable expertise and offered essential assistance for the research.
References
Buttle F. (2009) Customer Relationship Management – Concepts and Technologies, Elsevier Linacre House, USA.
Dragnea M., (2016), This is Retention, ALL Publishing House, Romania.
Dragnea M. and Mihăiță N., (2017), ‘Customer Retention Strategies and Organizational Adaptability’, Proceedings of the 30th International Business Information Management Association (IBIMA), ISBN: 978-0-9860419-9-0, 8-9 November 2017, Madrid, Spain, 1291-1300.
F. (2012). Uncommon Service: How to Win by Putting Customers at the Core of Your Business, Harvard Business Review Press, USA.
Heilman, M.R., Crișan G.L., Houser D., Miclea M., Miu A.C., (2010), Emotion Regulation and Decision Making Under Risk and Uncertainty, American Psychology Association, USA.
Hirschman, A.O. (1970). Exit, Voice, and Loyalty, Harvard University Press, USA.
Krosnick J.A., (2009), Question and Questionnaire Design, Handbook of Survey Research (2nd Edition), Emerald Publishing Group Limited, USA.
Ristea, Ioan-Franc, Stegăroiu, Tănăsescu (2010), Chrestomathy of Marketing terms and concepts, Expert Publishing House, Romania.
Rizal A. and Buttle F. (2001) Customer retention: a potentially potent marketing management strategy, Journal of Strategic Marketing, Routledge, United Kingdom.
Schwartz, Shalom H. (2012). An Overview of the Schwartz Theory of Basic Value, Online Readings in Psychology and Culture, USA.