Volume 2019,
Article ID 831063,
Journal of Eastern Europe Research in Business and Economics,
16 pages,
DOI: 10.5171/2019.831063
Received date: 7 February 2019; Accepted date: 20 April 2019; Published date: 22 July 2019
Academic Editor: Okręglicka Małgorzata
Cite this Article as:
Laurentiu Stelian MIHAI (2019)," An exploratory Study Regarding the Romanian SMEs’ Leader’s Profile", Journal of Eastern Europe Research in Business and Economics Vol. 2019 (2019), Article ID 831063, DOI: 10.5171/2019.831063
The small and medium enterprises are the most important category of enterprises in the whole European Union, representing more than 99% of all private entities registered in the EU, employing around 66% of all EU’s private employees and create around 57% of the added value of the European Union. In an SME, the relationship between management and employees is tighter, thus creating certain situations in which leadership manifests differently than in a large company. In this paper, we tried to create a leadership model, using certain performance indicators from 200 Romanian SME’s and the leadership style of their owner/manager. Our results led to the development of a profile for the Romanian SME leader.
Keywords: leadership, management, leader, small and medium enterprises
Introduction
Previous research on the field of small and medium enterprises, as well as European level statistics are showing us that that the European economic system is dominated by large, multinational corporations. Their multi-billion acquisitions, their global expansion plans and (recently) the risk of failure which could shatter the European economy are dominating the news. Thus, due to their relatively low dimensions, the SME’s are easy to oversight. Despite this, more than 99% (in the European Union there are more than 22 million SME’s, of which more than 93% are micro-enterprises) of the European business are small and medium enterprises (Annual Report on European SME’s 2015/2016 and Annual Report on European SME’s 2015/2016).
The vast majority of private companies from the EU-28 are small or medium enterprises (99,8% both in 2015 and 2018), their number increasing in 2018 by almost 1.5 million since 2015, while the large companies (more than 250 employees) registered an increase of only 2000 companies from 2015 to 2018. The largest category of SME’s has been the micro-enterprises accounting for approx. 93% of all private companies from the European Union (both in 2015 and 2018), registering an increase of about 1.5 million micro enterprises from 2015 to 2018.
Moreover, SMEs have approx. 67% (more than 90 million employees as of 2015) of all the jobs from the European private sector and create more than half (57,40%) of the added value from the European business sector, representing approx. 28% of the GDP of EU-28. Moreover, the SME’s are the real backbone of the European economic system, being the main responsible for the economic growth of the EU and have a key role in the technological progress, through innovation and research and development (Annual Report on European SME’s 2015/2016, p.54). In 2018, we can observe that the number of employees working in small and medium enterprises has increased with approx. 4 million employees (66,40% of all the private sector jobs in the EU), while the added value created by the EU SMEs has increased with more than 222 billion since 2015 (56,8% of all the EU28 added value).
Eurostat data is showing that in 2013, the average ratio of business openings (defined as the number of new businesses opened in 2013 divided by the number of existing SME’s from the previous year) was 11%, while the average ratio of business closures (defined as the number of business which closed in 2013 divided by the number of existing SME’s from the previous year) was 10%. For most of the member states, the difference between the average opening ratio and the average closure ratio was low, ranging between -2% and +2%. In 2015, the average EU28 enterprise birth rate was 10% (1% decrease since 2013), while the average EU28 business death rate was 8,5% (1,5% decrease since 2013). In 2015, Lithuania registered the highest enterprise birth rate (22,7%, with 12,7% more than the EU average), while Greece registered the lowest rate (5,1%, almost 5% less than the EU average). Regarding enterprise death rates, in 2015, Portugal registered the highest ratio (15,1%, almost 7% more than the EU average) while Belgium registered the lowest ratio (3,6%, almost 5% lower than the EU average).
Only six member states, including Romania (along with France, Lithuania, Latvia, Slovenia and the United Kingdom) had the opening ratios higher than the closure ratios in 2013, while four member states (Cyprus, Croatia, Hungary and Portugal) were at the other end of the spectrum. In 2015, Bulgaria, Denmark, the Czech Republic, Croatia, Italy, Portugal and Hungary had a negative net enterprise birth rate (the difference between the birth rate and the death rate), while Spain’s enterprise birth rate was equal to the enterprise death rate (8,9% in both cases). The country with the highest average net enterprise birth rate was Lithuania (8,5%).
Very small businesses (less than 4 employees) have represented almost all of the new business openings in 2013 (the latest year for which this kind of data is available). In all the member states, except for Austria, Hungary, Luxembourg and the United Kingdom, these very small businesses represented 95% of all the new business openings. In the other four states, the very small enterprises represented between 90% and 94% of the new business openings (Annual Report on European SME’s 2015/2016, p.58).
Moreover, in 2013, these openings were focused around zero employees businesses in many member states: in almost all, but for four states (Cyprus, Hungary, Romania and the UK), zero employees business represented more than 50% of the new business openings in 2013. In ten member states (Belgium, the Czech Republic, France, Ireland, Lithuania, Malta, the Netherlands, Poland, Slovenia and Portugal), this category represented at least 80% of the new business openings in 2013 (Annual Report on European SME’s 2015/2016, p.58).
The same trend can be observed in case of business closures, where very small companies represent almost all of the business closures of 2013. Zero employee companies, as well as those with less than 4 employees represented more than 98% of the total business closures in 15 member states (Belgium, the Czech Republic, Germany, Denmark, Finland, Croatia, Italy, Malta, the Netherlands, Poland, Portugal, Romania, Sweden, Slovenia and Slovakia) and between 95% and 97% in the other 9 member states (Austria, Bulgaria, Cyprus, France, Estonia, Spain, Hungary, Ireland and Latvia). In the other 3 member states (Luxembourg, Lithuania and the United Kingdom), these two categories represented between 91% and 93% of all the business closures of 2013 (Annual Report on European SME’s 2015/2016, p.59).
Following the same trend as the business openings, most of the companies closed in 2013 had zero employees:
Thus, this kind of companies represented more than 50% of all the business closured, in all the member states, except for the UK and Cyprus;
In 13 member states (Belgium, the Czech Republic, Germany, Denmark, Finland, France, Malta, the Netherlands, Poland, Portugal, Romania, Sweden and Slovakia), the zero employees company represented 80% of all the business closures of 2013.
Despite these deficiencies, due to their small size, the low level of internal bureaucracy (compared to large enterprises) and the multi qualified staff, these enterprises have a high degree of flexibility, which, if efficiently exploited, can help the entity to overcome the recession period, minimizing the negative consequences (Mihai, 2017).
A recent study regarding the effects of inefficient leadership has shown that there is a significant relationship between the inefficient leadership and the negative effects of the employees’ performance, such as a decrease in the duration and rhythm of work, fulfilment of tasks and carelessness (Amabile et al., 2004). Thus, while the efficient leadership has a positive effect, through an increase in organizational performance and fulfilment of goals, the inefficient leadership has a negative impact upon the organizational performance and employees’ attitude (Mihai, 2015).
Unlike the large enterprises (especially the multinational corporations), the SME’s are much more vulnerable to changes in the environment, especially in the recession periods. This happens because most SME’s, especially the young ones, have an unstable market position, disloyal customers, less experienced management and less financing opportunities (Ogarcă, 2014). This statement is confirmed by the reality of Romanian SME’s during the recession: according to Ovidiu Nicolescu, the President of National Council of Small and Medium Enterprises from Romania, more than 100.000 SME’s have been closed between 2008 and 2011; 2011 is considered, officially, the year in which the Recession ended in Romania, due to the registered economic growth, even though, in that year, an average of 62 SME’s were closing every day in the country (Mihai, 2016).
According to Iancu Guda; the president of the Romanian Banking and Financial Analysts Association (AAFBR), the Romanian SMEs generate 14% of the total national income (as opposed to 26% in 2008), even though they represent 96% of all Romanian enterprises, while the large companies (4% of the total number of Romanian enterprises) generate 86% of the total national income. (Agerpres, 2018). At the same time, Iancu Guda underlines the fact that in the last 10 years, the average income/employee has remained the same in the SMEs (around 24.000 EUR/employee), but the work efficiency, from a commercial point of view, has doubled Considering that the average net wage has increased from around 370 EUR in 2008 to around 580 in 2017, these companies have a stable income/employee which makes it difficult for them to sustain this increase in the average wage (Agerpres, 2018). Thus, SME’s suffered from low productivity, which has been outperformed by the 15 consecutive increases in the minimum wage from the last decade, thus increasing their costs.
At the same time, the analyst underlines that the polarisation of the Romanian business environment is visible regarding the enterprises’ incomes, profits and liquidity, the SME’s becoming more and more vulnerable to a future recession, compared to large companies, amplifying the fragility of the middle class (Agerpres, 2018).
Other aspects regarding the SME’s that have been identified in the last ten years are low capitalisation, high debt ratio, low short-term investments, low asset efficiency, slow collection of outstanding debts and a high diversification of the inventory, above the balance level.
The Leadership Model
If the leadership is a function, it must be considered an essential part of management, whose existence depends on a series of abilities which form the leadership style of the manager. Leadership is a concept where no consensus exists between the various theoreticians who have studied this phenomenon. According to Stogdill (1974), the number of the leadership definitions equals the number of people who tried to define it; despite these, “influence” is a constant factor in many of these theories.
Nowadays, the economic environment has become more dynamic and it forced the companies to find new ways to adapt to change. In this kind of environment, in order for the companies to succeed and survive, they have to focus on flexibility, dynamicity and evolution, while avoiding stagnation.
Lovelace, Manz and Alves (2007) state that leadership can happen at both an individual level and a collective level and at an individual level, leadership is referred as self-leadership or self-management, which refers to the act of leading yourself to perform tasks that motivate you.
When talking about leadership, most experts agree that this concept is associated with influencing a certain person to act in a certain way, by their own accord. Moreover, “it involves a mutual dependency between members during the movement and related task performance” (Ulhoi and Muller, 2014, p.77). Gronn (2002) is stating that mutual interdependence refers to a reciprocal dependence between two or more members, thus permitting overlapping and related responsibilities. This complementariness enables interdependent organizational members to make use of the different technical and/or emotional strengths available (Gronn, 2002; Ulhoi and Muller, 2014). O’Toole, Galbraith, and Lawler (2002) have captured the essence of mutual interdependency as “the more interdependent the work of co-leaders, the more input they should solicit from affected others, and the more they need to coordinate between themselves” (p. 79).
Leadership experts state that this concept is one on which the success and failure of a company ultimately depends (Bennis, 2007). Both researchers and practitioners recognise leadership as a major element which affects organizational performance (Bass, 1985; Canella and Rowe, 1995; Rowe et al, 2005). These researchers have concluded that efficient leadership increase organizational performance and facilitate goal fulfilment (Bass, 1985; Gordon and Yukl, 2004). The negative effects of inefficient leadership upon the organizational performance and employees’ attitude are confirming the importance and the significance of efficient leadership.
In 1994, Moss and his colleagues have studied the leadership styles (The Leader Attributes Inventory – LAI) and developed a diagnostic analysis based on 37 attributes, characteristics, knowledge and competencies of leaders inclined to obtain performance in education.
According to Moss and his colleagues (1994, p.23), the largest values were registered for the following 26 attributes and competencies: trustworthy (,89), achievement oriented (,87), team building (,85), sensitivity and respect (,85), time management (,84), problem solving (,83), common values (,81), state of mind (,80), critical thinking (,80), networking (,80), communication (,80), conflict management (,79), delegation (,79), decision making (,78), adaptability and openness to change (,78), information management (,77), common good (,75), adequate use of leadership styles (,75), energy (,75), organizing (,74), tolerance to frustrations (,73), stress management (,73), coaching (,73), planning (,73), integrity (,72), ethics (,72), while the lowest values were registered for the following 11 attributes and competencies: perseverance (,47), initiative (,50), risk taking (,55), responsible (,62), profound (,63), enthusiastic and optimistic (,64), keen on taking responsibilities (,66), visionary (,67), motivating factor (,67), confident (,68) and tolerant (,68).
Claudio Feser, Fernanda Mayol and Ramesh Srinivasan, based on a study of 81 organizations from Asia, Europe, Latin America and North America developed a top 20 of the main characteristics of a leader. On the first place (Feser et al., 2015, p. 3) we have the capacity to support, followed by: champion of desired changes, clarifies goals, rewards and consequences, enthusiastic communicator, contributes to his partners’ development, develops and shares the collective mission, differentiates between followers, facilitates collaboration between the group members, adopts mutual respect, gives rewards, organizes the group based on their activities, makes qualitative decisions, motivates, offers a critical perspective, is result oriented, is a role model for the organizational values, looks for different perspectives and is an efficient problem solver.
Research Methodology
The main goal of our scientific research is to create a practical model, based on the existing correlations between the leadership styles and certain performance indicators of the SME’s.
Our research was conducted on a sample of 200 small and medium enterprises, as follows: Building constructions – 22 companies (11%), Specialized construction activities – 18 companies (9%), Wholesale and retail trade and repair of vehicles and motorcycles – 18 companies (9%), Wholesale trade except trade of vehicles and motorcycles – 50 companies (25%), Retail trade, except of vehicles and motorcycles – 92 companies (46%).
In order to fulfil the purpose of our scientific research, we have employed the following variables:
Leadership style (laissez-faire, democratic or autocratic), evaluated through a 24 questions survey that was applied to the owner-managers of the 200 companies included in our sample. Of these 24 questions, 15 questions are measuring (on a 5-point Likert Scale) the leadership style of the respondent, by asking questions regarding the way the respondent is making decisions, delegating responsibilities, assigning tasks, evaluating his subordinates and relating to the degree of autonomy and freedom that his subordinates have. These 15 questions are divided into 3 sets of 5 questions, each set being related to one of the three leadership styles (Democratic, Autocratic and Laissez-Faire). In order to identify the dominant leadership style, we calculated the score that each respondent registered for each of the 3 sets of questions. The leadership style which registered the highest score was considered the dominant style.
Profit: this variable was divided into 3 sub-variables: the company’s average profit before the crisis (2004-2007), during the crisis (2008-2010) and after the crisis (2011-2015). The data was collected from the publicly available financial reports of the companies.
Debt ratio: this variable was calculated by dividing the total debt with the total assets. The data was collected from the publicly available financial reports of the companies.
Employee fluctuation ratio: this variable was calculated as follows: Employee fluctuation (year1) = [(Employee number(year1) – Employee number(year0)/Average employee number (year1year0] x 100. The employee number was collected from the publicly available financial reports of the companies.
These variables having been analysed for a period of 12 years, starting with 2004 and ending with 2015, a period which we have considered relevant because it consists of three significant stages: the economic growth of before 2007, the recession between 2008 and 2010 and the recovery period which started in 2011. The relationship between the five variables were analysed separately, for each of the three stages, as well as for the whole period (2004-2015) through several statistical correlations (ANOVA, descriptive statistics, Cronbach’s Alpha, and Pearson Correlation).
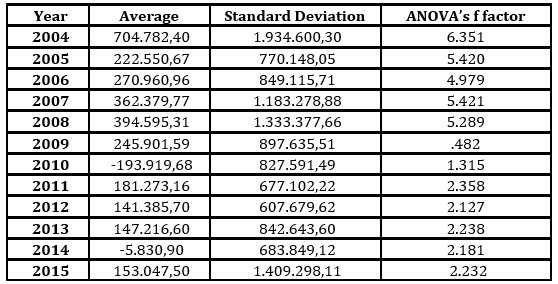
Table 1: Descriptive statistics for the SMEs’ profit
From table 1, we observe that the highest standard deviation was registered in 2004 (1.934.600,30), the same year which registered the highest average profit (704.782,40). The lowest average profit was registered in 2010 (-193.919,68) which shows us that the financial recession had a continuous influence upon the SMEs’ performances.
Regarding the F factor, we see that the highest value was registered as well in 2003 (F=6,351), while the lowest value was registered in 2009 (,482), which leads to the conclusion that some pertinent predictions regarding certain performance indicators can be made for 2-3 years intervals.
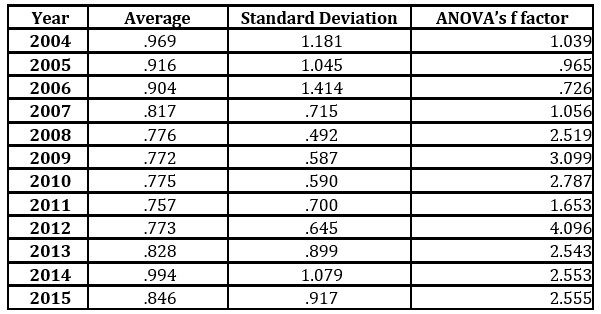
Table 2: Descriptive statistics for the SMEs’ debt ratio
Table 2 is showing us that the highest standard deviation was registered in 2006 (1.414), while the highest average debt ratio was registered in 2014, which means that the companies have started again to be more confident and borrow money from lenders.
The lowest standard deviation of the debt ratio was registered in 2008 (.492) while the lowest average debt ratio was registered in 2011 (.757), which is normal, since 2011 was the first year after the financial crisis and the companies were still recovering and the debt cost was still quite high.
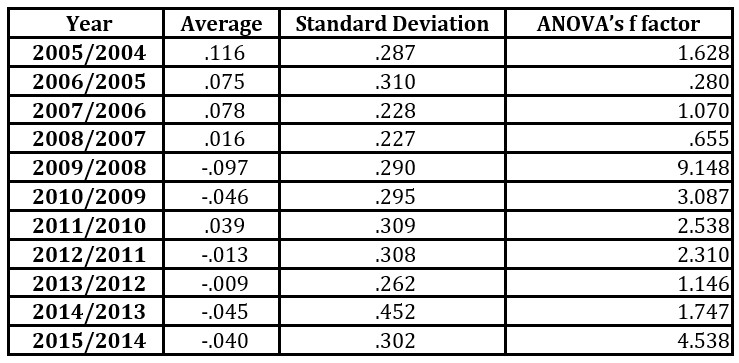
Table 3: Descriptive statistics for the SMEs’ employee fluctuation rate
Table 3 is showing us that the highest standard deviation was registered in 2014/2013 (.452), while 2005/2004 has the highest average employee fluctuation rate (.116). The lowest average employee fluctuation rate was registered in 2009/2008 (-.097), while the highest standard deviation was registered in 2008/2007 (.227)
In order to fulfil the purpose of this research and create a practical model, we have used the following research hypothesis:
H1: The leadership style has a direct and positive influence upon the debt ratio of the company;
H2: There is a direct and negative relationship between the financial crisis and the leadership style
H3: There is a direct and negative relationship between the financial crisis and the debt ratio of the company;
H4: There is a direct and negative relationship between the financial crisis and the employee fluctuation;
H5: The debt ratio has a direct and positive influence on the profit.
Results and Discussion
Hypothesis 1: The leadership style has a direct and positive influence upon the debt ratio of the company;
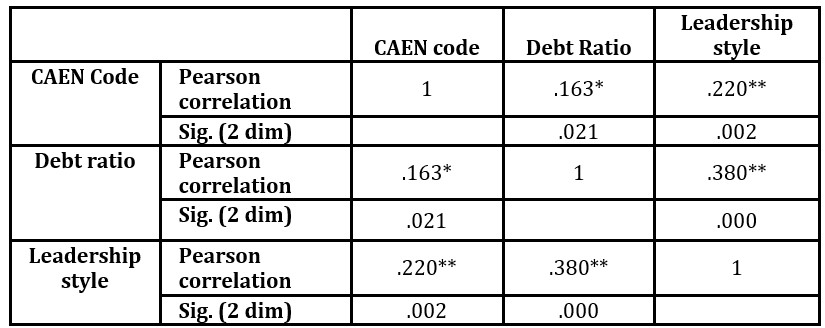
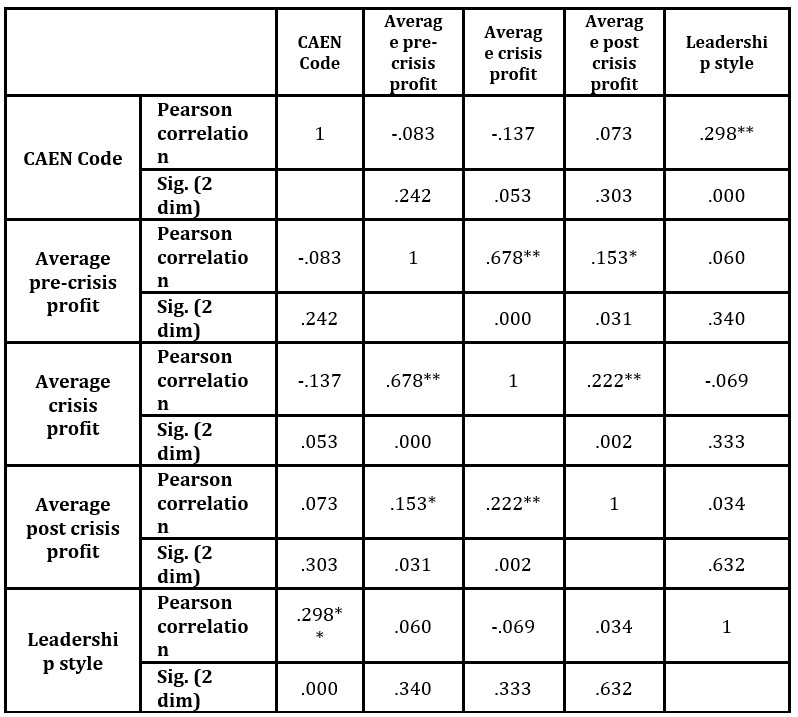
Table 4: Pearson Correlation between leadership style and debt ratio
Studying table 4, we can observe direct and positive correlations for the following items:
Leadership style and debt ratio (.380**) – which shows us that the leadership style influences directly and positively the company’s debt ratio. Thus, a democratic leadership style, correlated with low employee fluctuation leads to a reduction in the debt ratio.
Leadership style and CAEN Code (.163*) – which shows us that the company’s industry influences directly and positively the debt ratio;
With a Pearson Correlation value of .380**, Hypothesis 1: The leadership style has a direct and positive influence upon the debt ratio of the company – is validated
Hypothesis 2: There is a direct and negative relationship between the financial crisis and the leadership style
Table 5: Pearson Correlation between leadership style and financial crisis
Table 5 is showing us direct and positive influences, for the following items:
CAEN code and average post-crisis profit (.073) – we can observe a direct and positive influence of the companies’ industry upon the companies’ performances in the period that followed the recession;
Leadership style and the average pre-crisis profit (.060) – which denotes a significant positive relationship between the two items: in the economic boom before the crisis, the leaders employed a lassaiz-faire leadership styles, not involving themselves too much in the day to day operations of the company, as the employees and the companies were mature enough to be successful without too much involvement from the manager (Burlea Schiopoiu and Idowu, 2016);
Leadership style and average post-crisis profit (.034) – which is showing us that the leadership style influences directly and positively the companies’ performance in the period that followed the recession: after the crisis has passed, the managers started to limit their involvement in the company again (their involvement being the highest during the recession), having a more democratic approach as the company straightened and started becoming profitable again (Mihai, 2018);
From table 3, we can observe direct and negative influences for the following items:
Leadership style and average profit crisis profit (-.069) – which means that leadership style influences directly and negatively the companies’ performance in the crisis period
Leadership style and average crisis profit (-.069) – during the recession, the managers needed to use a more autocratic approach in order to ensure their companies survive the financial crisis. For most (if not all) managers involved in this sample, this was the first real serious crisis their companies encountered and they needed to become autocratic leaders in order to keep the company on the right path.
CAEN code and average crisis profit (-.137) – we can observe a direct but negative influence of the companies’ industry upon their performances during the crisis period, which means that the two analysed industries (constructions and trade) were strongly affected by the global financial crisis;
With a Pearson Correlation value of (-.069) – Hypothesis 2: There is a direct and negative relationship between the financial crisis and the leadership style– is validated
Hypothesis3: There is a direct and negative relationship between the financial crisis and the debt ratio of the company;
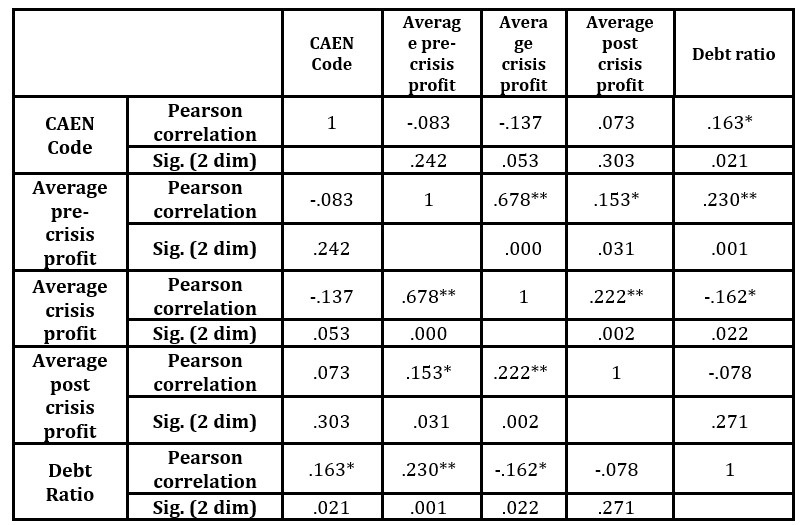
Table 6: Pearson Correlation between debt ratio and financial crisis
the Pearson Correlation between the debt ratio and the average profit before the recession is (.230), which means there is a significant but positive relationship between the two items: before the financial crisis, the companies had a high debt ratio, because they were using borrowed money for investments, as a driver for increased profitability;
the Pearson Correlation between the debt ratio and the average profit during the recession is (-.162), which means there is a significant but negative relationship between the two items: during the recession, the cost of debt has reached a very high level as banks were not as eager to lend money as they were before. Thus, the analysed companies have stopped borrowing, as their profit decreased and they already had a high level of debt from before the recession.
the Pearson Correlation between the debt ratio and the average profit after the recession is (-.078), which means there is a significant but negative relationship between the two items (but lower than the crisis period): the companies which survived the financial crisis, survived with a lower level of debt and they were starting to borrow money again (at a higher cost than before the crisis, but lower than during the crisis) in order to start investing again;
With a Pearson Correlation value of (-.162*) – Hypothesis3: There is a direct and negative relationship between the financial crisis and the debt ratio of the company – is validated
Hypothesis4: There is a direct and negative relationship between the financial crisis and the employee fluctuation;
Table 7: Pearson Correlation between employee fluctuation and financial crisis
the Pearson Correlation between the employee fluctuation and the average profit before the recession is (.073), which means there is a significant but positive relationship between the two items. Before the financial crisis, the fluctuation of the employees was quite low: the company was mature, the employees were experienced and loyal and this contributed significantly to the company’s profitability.
the Pearson Correlation between the employee fluctuation and the average profit during the recession is (-.049), which means there is a significant but negative relationship between the two items. During the financial crisis, the employee fluctuation rate has started to grow, as companies needed to restructure and resize their operations, which in many cases led to one of the following outcomes: (1) the company had to let some employees go and (2) the company had to lower the wages of their employees in order to survive the financial crisis and as a result, some employees left. Both outcomes mean a higher employee fluctuation rate, which led to a significant reduction of the profit.
the Pearson Correlation between the employee fluctuation and the average profit after the recession is (.137), which means there is a significant but positive relationship between the two items. After surviving the financial crisis, the companies started to grow again, at a slower rate, which meant they had to find new employees who could contribute to this growth, which led to a high, but positive employee fluctuation rate (Burlea Schiopoiu et al., 2017).
With a Pearson Correlation value of (-.049) – Hypothesis4: There is a direct and negative relationship between the financial crisis and the employee fluctuation – is validated
Hypothesis5: The debt ratio has a direct and positive influence on the profit.
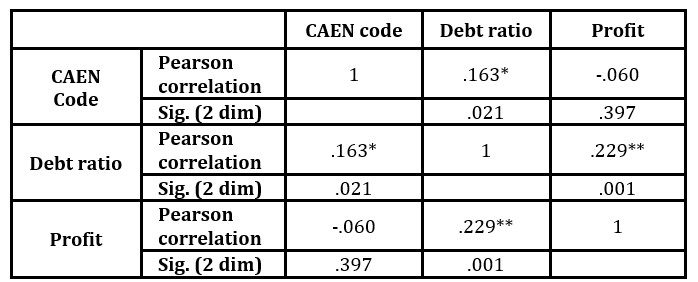
Table 8: Pearson Correlation between profit and debt ratio
Studying table 9, we can observe direct influences for the following items:
debt ratio and profit (.229**) – which shows us that the debt ratio influences directly and positively the profit. Thus, in order to register a higher profit, a company is more likely to invest borrowed money than their own, in order to maintain a high liquidity level in case a new crisis will appear;
debt ratio and CAEN code – (.163*) – which shows that the company’s industry influences directly and positively the debt ratio;
With a Pearson Correlation value of (.229**) – Hypothesis5: The debt ratio has a direct and positive influence on the profit – is validated.
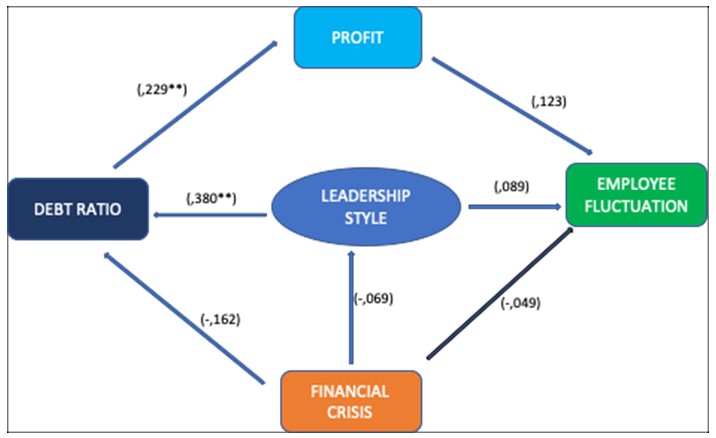
Based on the validation of these hypothesis, we have developed the following model of the correlations between the leadership style and various performance indicators.
Fig .1:The relationship between the leadership style and various performance indicators
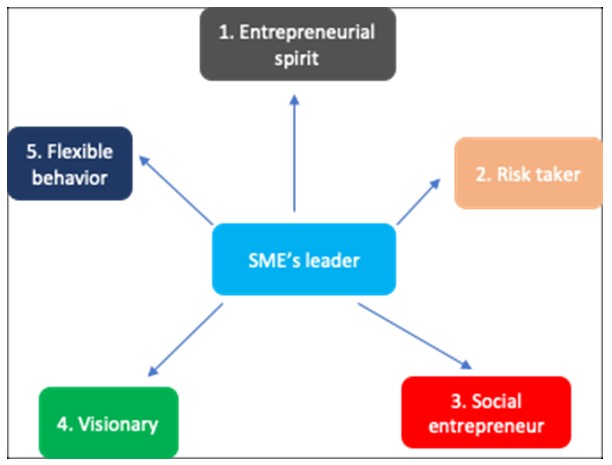
Thus, through our research, we have identified the following characteristics of the leader:
The SME’s leader is an entrepreneur who takes risks and according to economic reality, raises or lowers the debt ratio; (-.162**)
The SME’s leader is a risk taker, who can use debt in order to increase his profits. (.229**)
The SME’s leader is a social entrepreneur who focuses on both the increase of the company’s profit, as well as creating optimum work conditions for his employees both during crises and stable periods. At the same time, he is not afraid of taking harsh decisions when they are needed in order to keep the company on the right path. The leader, through his leadership style, is the binding agent between the company’s profitability and the employees’ stability (Burlea Schiopoiu, 2014). (-.049)
The leader is a visionary because, through his leadership style, he can lead his company to failure or to progress and success (.380**)
The leader has a flexible behaviour, knowing how to adapt his approach according to the situation at hand (Burlea Schiopoiu, Rainey, 2013) (-.069)
Fig. 2: The leaders’ characteristics
The leader is using his strategic position in order to efficiently manage the situation or the activities which may negatively affect the company’s performance (e.g. the economic recession has negatively influenced the employees’ retention, because the financial and economic instability has forced the company to restructure and resize their operations, which led to some employees being let go or other employees leaving because of the lower wages).
In Romania, in most of the SME’s, the power is concentrated around a single person, the leader-owner. Due to this aspect, the company can enter a crisis period, when the owner decides to transfer the power to his children. The transition of internal family values is not as important as the transition of the competencies from the current leader to his successor, no matter if the latter is his child or an external manager. The simple fact that he is part of the original management family is not sufficient anymore for the success to be accepted as a leader by their employees. This act of legitimacy for the new leader is based on demonstrating professional, relational or managerial competencies (Burlea Schiopoiu and Remme, 2017; Burlea Schiopoiu, 2008).
Conclusions
Based on the literature review and our practical research, we can state that we managed to build and validate a model of the influences of the leadership styles upon the Romanian small and medium enterprises’ performances and to draft a profile of Romanian SME’s leader which matches findings from previous researches.
Our future developments will aim to test the practical applicability of the theoretical leadership model, as well as the leader profile, that we have managed to draft through the present paper. Thus, we wish to further analyse the leadership behaviour of the Romanian SME’s owners in a turbulent environment and to test the degree in which this behaviour will continue to be framed in this model. A significant focus will be on the satisfaction the SME’s employees, as it is generated by a certain leadership behaviour, in the environment generated by the consequences of the global financial and economic recession, economic restructuring and decreasing the differences between the Romanian SME’s and their European counterpart.
Agerpres (2018, August). IMM-urile din România concentrează doar 14% din venituri, deşi ponderea lor este de 96%, Retrived from https://www.economica.net/imm-urile-din-romania-concentreaza-doar-14prc-din-venituri-desi-ponderea-lor-este-de-96prc_156699.html
Amabile, T., Schatzel, E., Moneta, G., Kramer, S. (2004). ‘Leader behaviors and the work environment for creativity: Perceived leader support’. The Leadership Quarterly, 15(1), 5–32.
Annual report on European SME’s 2015/2016
Annual report on European SME’s 2017/2018
Bass, B. (1985). Leadership and performance beyond expectations. New York, NY: Free Press.
Bennis, W. (2007). ‘The challenges of leadership in the modern world: Introduction to the special issue.’ American Psychologist, 62(1), 2–5.
Burlea Schiopoiu, A. (2014). The Dichotomy of Entrepreneurship between Business and Social, in Economics and Business Communication Challenges, editors – Wojciech Dyduch, Malgorzata Pankowska, Publishing House of University of Economics in Katowice, pp.47-56.
Burlea Schiopoiu, A. (2008). Managementul resurselor umane. Editura Universitaria, Craiova.
Burlea Schiopoiu, A., Idowu, S., Vertigas St. (2017). Corporate Social Responsibility in Times of Crisis: A Summary, pp. 261-264, DOI:10.1007/978-3-319-52839-7_14
Burlea Schiopoiu, A., Remme J. (2017). ‘The Dangers of Dispersal of Responsibilities’. Amfiteatru Economic, 19(45), pp. 464-476.
Burlea Schiopoiu, A., Idowu, S. (2016) ‘The independence of the managers: an ethical dilemma’, International Journal of Social Entrepreneurship and Innovation, 4(2), pp. 152-171.
Burlea Schiopoiu, , Rainey S. (2013). Servant leader/Servant leadership, in Encyclopedia of Corporate Social Responsibility, Editors Samuel O. Idowu, Nicholas Capaldi, Liangrong Zu, Ananda das Gupta, Springer-Verlag Berlin Heidelberg, pp. 2120-2126. DOI: 10.1007/978-3-642-28036-8_203.
Cannella, A. A., Rowe, W. G. (1995). ‘Leader capabilities, succession, and competitive context: A study of professional baseball teams’, The Leadership Quarterly, 6(1), 69–88.
Feser, C., Mayol, F., Srinivasan, R. (2015) Decoding leadership: What really matters, Mckinsey.com,
Gordon, A., Yukl, G. (2004). ‘The future of leadership research: Challenges and opportunities’ German Journal of HumanResource Management, 18(3), 359–365.
Gronn, P. (2002). ‘Distributed leadership as a unit of analysis’. The Leadership Quarterly, 13(4), 423-451.
Lovelace, K. J., Manz, C. C., & Alves, J. C. (2007). ‘Work stress and leadership development: The role of self-leadership, shared leadership, physical fitness and flow in managing demands and increasing job control’. Human Resource Management Review, 17(4), 374- 387
Mihai, L. (2015). ‘The particularities of leadership styles in Romanian Organisations’. 11th European Conference on Management, Leadership and Governance (pg. 580-587). London: Academic Conferences and Publishing International.
Mihai, L. (2016). ‘The particularities of leadership styles among Dutch small and medium business owners’ Annals of the ‘Constantin Brâncuşi’ University of Târgu Jiu, Economy Series, 6, 240-248
Mihai, L. (2017). ‘The evaluation of leadership styles prevailing in small and medium enterprises in the post crisis period’. Review of Management and Economic Engineering. 16(1), 103-117.
Mihai, L (2018). Impactul stilului de leadership asupra performantelor in intreprinderile mici si mijlocii. Craiova: Editura Universitaria Craiova, Colectia Studia doctoralia
Moss, J. Jr, Lambrecht, J.J., Jensrud, Q. și Finch, C.R. (1994). Leader Attributes Inventory, Manual. National Center for Research in Vocational Education, Berkeley, CA. Office of Vocational and Adult Education (ED), Washington, DC.
Ogarcă, R. F. (2014). Managementul IMM-urilor, Manual pentru Învățământ la Distanță.
O’Toole, J., Galbraith, J., & Lawler, E. E. I. (2002). ‘When two (or more) heads are better than one: The promise and pitfalls of shared leadership’. California Management Review, 44(4), 65 83.
Pearce, C. L., Manz, C. C., & Sims, H. P. (2008). ‘The roles of vertical and shared leadership in the enactment of executive corruption: Implications for research and practice’. Leadership Quarterly, 19(3), 353-359.
Rowe, W. G., Cannella, A., Rankin, D., Gorman, D. (2005). ‘Leader succession and organizational performance: Integratingthe common-sense, ritual scapegoating, and vicious-circle succession theories’. The Leadership Quarterly, 16(2), 197–219.
Stogdill, R. M. (1974). Handbook of leadership: A survey of theory and research. New York: Free Press.
Ulhoi, J.P & Muller, S (2014). ‘Mapping the landscape of shared leadership: A review and synthesis’. International Journal of Leadership Studies, 8(2), 66-86